
We explore how the Bayesian Gaussian Process Classifier (GPC) injects much needed agility and interpretability into default modeling.
In brief:
- Prevailing uncertainty in geopolitical, economic and regulatory environments demands a more dynamic approach to default modeling.
- Traditional methods such as logistic regression fail to address the non-linear characteristics of credit risk.
- Score-based models can be cumbersome to calibrate with expertise and can lack the insight of human wisdom.
- Machine learning lacks the interpretability expected in a world where transparency is paramount.
- Using the Bayesian Gaussian Process Classifier defines lending parameters in a more holistic way, sharpening a bank’s ability to approve creditworthy borrowers and reject proposals from counterparties that are at a high risk of default.
Historically high levels of economic volatility, persistent geopolitical unrest, a fast-evolving regulatory environment – a perpetual stream of disruption is highlighting the limitations and vulnerabilities in many credit risk approaches. In an era where uncertainty persists, predicting risk of default is becoming increasingly complex, and banks are increasingly seeking a modeling approach that incorporates more flexibility, interpretability, and efficiency.
While logistic regression remains the market standard, the evolution of the digital treasury is arming risk managers with a more varied toolkit of methodologies, including those powered by machine learning. This article focuses on the Bayesian Gaussian Process Classifier (GPC) and the merits it offers compared to machine learning, score-based models, and logistic regression.
A non-parametric alternative to logistic regression
The days of approaching credit risk in a linear, one-dimensional fashion are numbered. In today’s fast paced and uncertain world, to remain resilient to rising credit risk, banks have no choice other than to consider all directions at once. With the GPC approach, the linear combination of explanatory variables is replaced by a function, which is iteratively updated by applying Bayes’ rule (see Bayesian Classification With Gaussian Processes for further detail).
For default modeling, a multivariate Gaussian distribution is used, hence forsaking linearity. This allows the GPC to parallel machine learning (ML) methodologies, specifically in terms of flexibility to incorporate a variety of data types and variables and capability to capture complex patterns hidden within financial datasets.
A model enriched by expert wisdom
Another way GPC shows similar characteristics to machine learning is in how it loosens the rigid assumptions that are characteristic of many traditional approaches, including logistic regression and score-based models. To explain, one example is the score-based Corporate Rating Model (CRM) developed by Zanders. This is the go-to model of Zanders to assess the creditworthiness of corporate counterparties. However, calibrating this model and embedding the opinion of Zanders’ corporate rating experts is a time-consuming task. The GPC approach streamlines this process significantly, delivering both greater cost- and time-efficiencies. The incorporation of prior beliefs via Bayesian inference permits the integration of expert knowledge into the model, allowing it to reflect predetermined views on the importance of certain variables. As a result, the efficiency gains achieved through the GPC approach don’t come at the cost of expert wisdom.
Enabling explainable lending decisions
As well as our go-to CRM, Zanders also houses machine learning approaches to default modeling. Although this generates successful outcomes, with machine learning, the rationale behind a credit decision is not explicitly explained. In today’s volatile environment, an unexplainable solution can fall short of stakeholder and regulator expectations – they increasingly want to understand the reasoning behind lending decisions at a forensic level.
Unlike the often ‘black-box’ nature of ML models, with GPC, the path to a decision or solution is both transparent and explainable. Firstly, the GPC model’s hyperparameters provide insights into the relevance and interplay of explanatory variables with the predicted outcome. In addition, the Bayesian framework sheds light on the uncertainty surrounding each hyperparameter. This offers a posterior distribution that quantifies confidence in these parameter estimates. This aspect adds substantial risk assessment value, contrary to the typical point estimate outputs from score-based models or deterministic ML predictions. In short, an essential advantage of the GPC over other approaches is its ability to generate outcomes that withstand the scrutiny of stakeholders and regulators.
A more holistic approach to probability of default modeling
In summary, if risk managers are to tackle the mounting complexity of evaluating probability of default, they need to approach it non-linearly and in a way that’s explainable at every level of the process. This is throwing the spotlight onto more holistic approaches, such as the Gaussian Process Classifier. Using this methodology allows for the incorporation of expert intuition as an additional layer to empirical evidence. It is transparent and accelerates calibration without forsaking performance. This presents an approach that not only incorporates the full complexity of credit risk but also adheres to the demands for model interpretability within the financial sector.
Are you interested in how you could use GPC to enhance your approach to default modeling? Contact Kyle Gartner for more information.


Entities must consider numerous factors when transitioning to the new DRM model, it is crucial for entities to develop a clear implementation plan.
The final article from Zanders on the DRM model presents the lifecycle of the DRM model over a single hedge accounting period and the prospective and retrospective assessments that are required to be carried out to ensure that the entity is correctly mitigating its interest rate risk for the assets/liabilities designated for the Current Net Open Risk Position (CNOP). The cycle will be illustrated by Scenario 1C taken from Agenda Paper 4A – May 20231. This is a relatively simple example, more complex ones can be found within the staff paper.
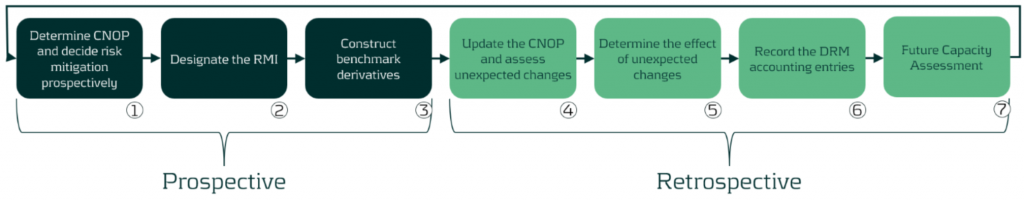
Figure 1: DRM Cycle
Prospective (start of the hedge accounting period)
The first three steps are related to the prospective assessment in the DRM model cycle.
The use of the prospective assessment is to ensure that the model is being used to mitigate interest rate risk and achieve the target profile that is set out in the RMS. The RMS should include the following:
- The risk mitigation cannot create new risks
- The RMI has to transform the CNOP position to a residual risk position that sits within the target profile (TP)
Step 1: The entity decides on the securities to be hedged and calculates the net open risk position (from an outstanding notional perspective) per time bucket.
In the example below the company has floating and fixed exposures. The business in this case has a five-year fixed mortgage starting in 20x2 which is fully funded by a five-year floating rate liability. The focus period is 20x2 (start of the hedge accounting period) to 20x3 (end of the hedge accounting period) and so the first period 20x1 has been removed. The entity manages its entity-level interest rate risk for a 5-year time horizon, based on notional exposure in ∆NII and has decided to set the TP to be +/-EUR 500 in each of the repricing periods. Below we present the total fixed and total floating exposures from the product defined above). The individual breakdown of the fixed and floating is not required as each exposure is hedged as a total. The exposure are positions at year end.
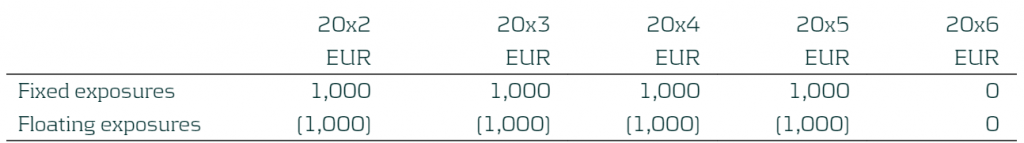
Table 1: CNOP of the Entity with yearly buckets
Step 2: The entity will calculate the RMI based on the designated derivatives. The entity decided to mitigate 80% of the risk through the use of the following derivatives (existing and new). Please note that is a combination of derivatives from all the derivatives available in the books:
- A 5-year pay fixed receive floating IR swap with notional of EUR 1,000, traded on 1st January 20x1 (DD Swap 1) (existing deal).
- A 4-year receive fixed pay floating IR swap with notional of EUR 200, traded on 1st January 20x2 (DD Swap 2)
This leads to the designated derivatives with the following exposures:
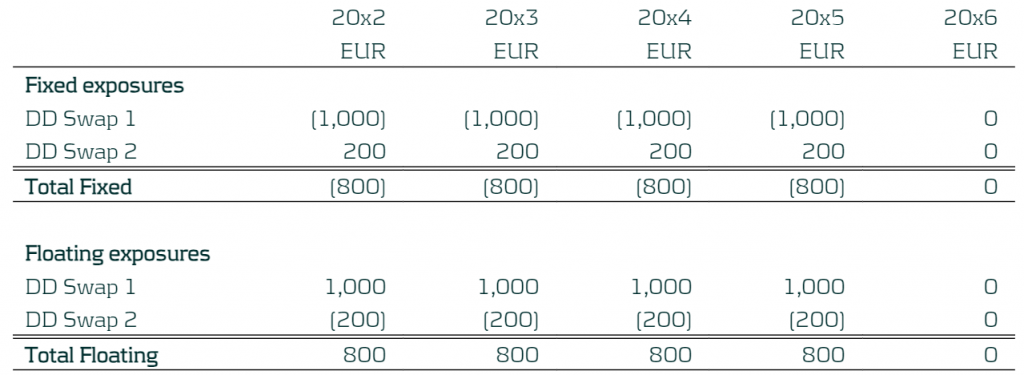
Table: Exposures of the Designated Derivatives
The exposures of the designated derivatives can then be compared to the CNOP as shown below:
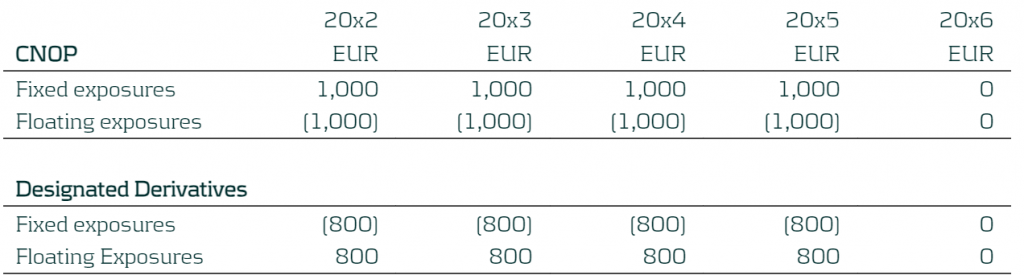
Table 2: Exposures of the CNOP and Designated Derivatives
As the entity manages its interest rate risk based on ∆NII, the RMI focuses on the floating exposure.
The prospective test is performed by comparing the CNOP and Designated Derivatives exposures at each time bucket to see whether this moves the residual risk inside the TP (+/- EUR 500) set out within the RMS and not providing an over-hedge position. In this case the residual risk will be 0 (80% of CNOP versus DD exposures) and so the prospective assessments pass for all the time buckets.
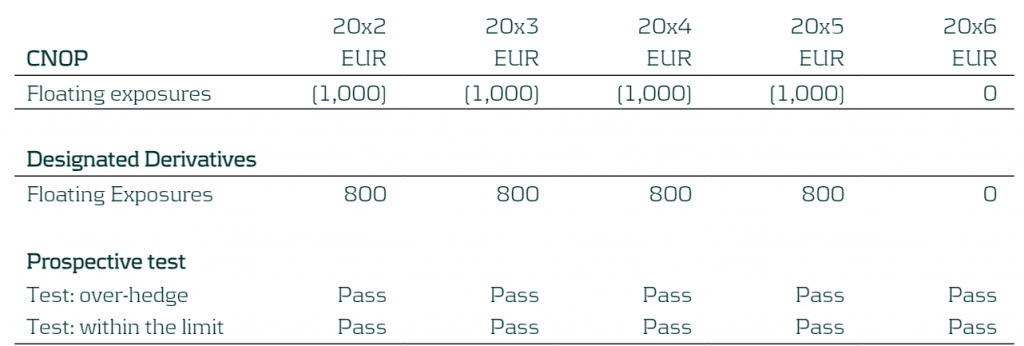
Table 3: Prospective test
Step 3: Benchmark derivatives (hypothetical derivatives) are constructed based on the RMI calculated above.

Table 4: Benchmark Derivatives created for the Fixed and Floating Exposures
Retrospective (end of the hedge accounting period)
The following steps are related to the retrospective assessment of the DRM model.
The IASB requires a retrospective assessment, to check that risks have been mitigated, as well as a future capacity assessment for each period2. This is to ensure the company is correctly mitigating its interest rate risk, ensuring the CNOP sits within their TP and to quantify the potential misalignment arising from unexpected changes (during the hedge accounting period).
Step 4: The entity updates the CNOP with the latest ALM information (note that new business is excluded from the updated CNOP).
In this example, the financial asset was repaid fully at the end of 20x5. The revised expectation is that it will be partially repaid per end 20x4 and the rest repaid end 20x5.
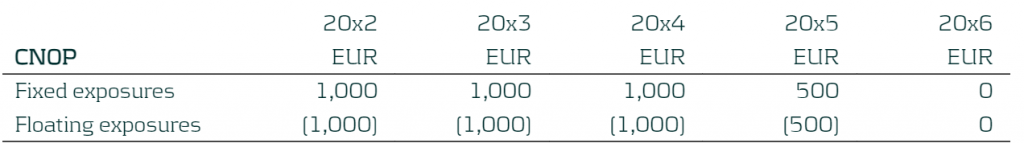
Table 5: Updated CNOP
Step 5: The potential misalignment due to unexpected changes is calculated. The new CNOP is compared to the RMI that was set in Step 2. Misalignments can occur due to:
- Difference in changes in the fair value of the designated derivatives and benchmark derivatives (i.e: different fixed rate, fair value adjustments)
- The effect of the unexpected changes in the current net open position during the period
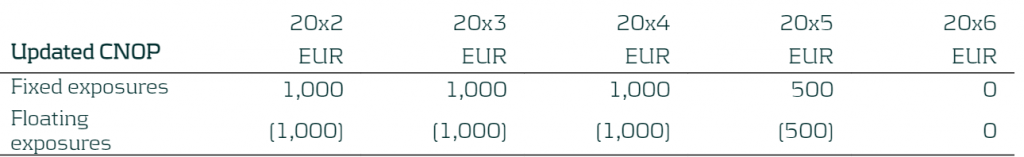
Table 6: Updated CNOP
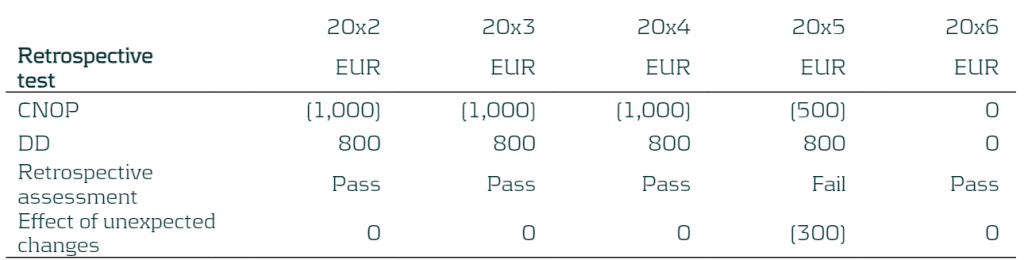
Table 7: Determining the effect of unexpected changes
If there are misalignments and the entity breaches the retrospective assessment, meaning that it has been over-mitigating its risk, the benchmark derivatives will need to be revised. One way in which this can be achieved is through the creation of additional benchmark derivatives which can represent the misalignment occurring. These will be based on the prevailing benchmark interest rates.
Therefore, for this example, the entity will construct two additional benchmark derivatives to represent these changes:
- A 4-year pay fixed rate receive floating IR swap with notional of EUR 300, maturing on the 31st December 20x5 (BD Swap 3)
- A 3-year receive fixed pay floating IR swap with notional of EUR 300, maturing on 31st December 20x4 (BD Swap 4)
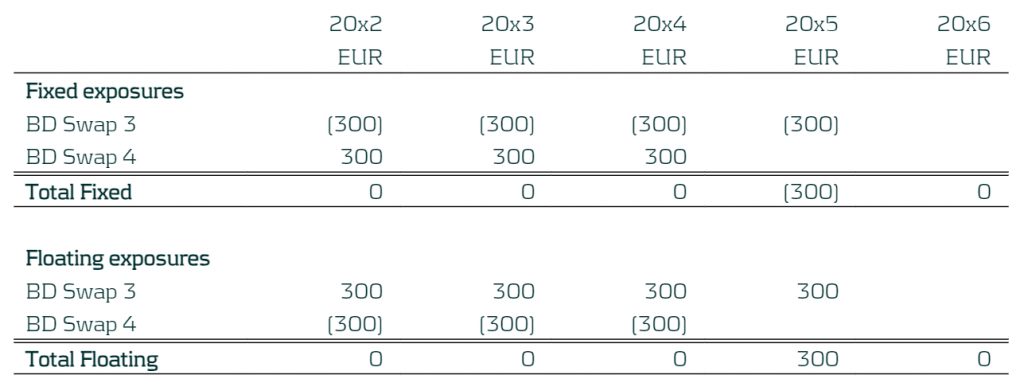
Table 8: Additional Benchmark Derivatives
Step 6: The hedge accounting adjustments are calculated, and the DRM model outputs are required to be booked3:
- a) The designated derivatives to be measured at fair value in the statement of financial position.
- b) The DRM adjustments to be recognised in the statement of financial position, as the lower of (in absolute amounts):
- The cumulative gain or loss on the designated derivatives from the inception of the DRM model.
- The cumulative change in the fair value of the risk mitigation intention attributable to repricing risk from the inception of the DRM model. This would be calculated using the benchmark derivatives (from step 3 and step 5) as a proxy.
- c) The net gain or loss from the designated derivatives calculated in accordance with (a) and the DRM adjustment calculated in accordance with (b) would be recognised in the statement of profit or loss.
The table below presents the EUR booking figures for this example. Figures are for the period 20x2 to 20x3.
The underlying items block represents the interest rate paid/received for the financial asset and financial liability for the period.
The designated derivative block presents the fair value movement of the designated derivatives for the period and the realised cash flow (net interest rate paid or received) on these instruments (trading income).
The DRM adjustment block presents the fair value movement of the benchmark derivatives for the period and the realised cash flow on these instruments (trading income).
BS represents a balance sheet account when IS represents an income statement account.
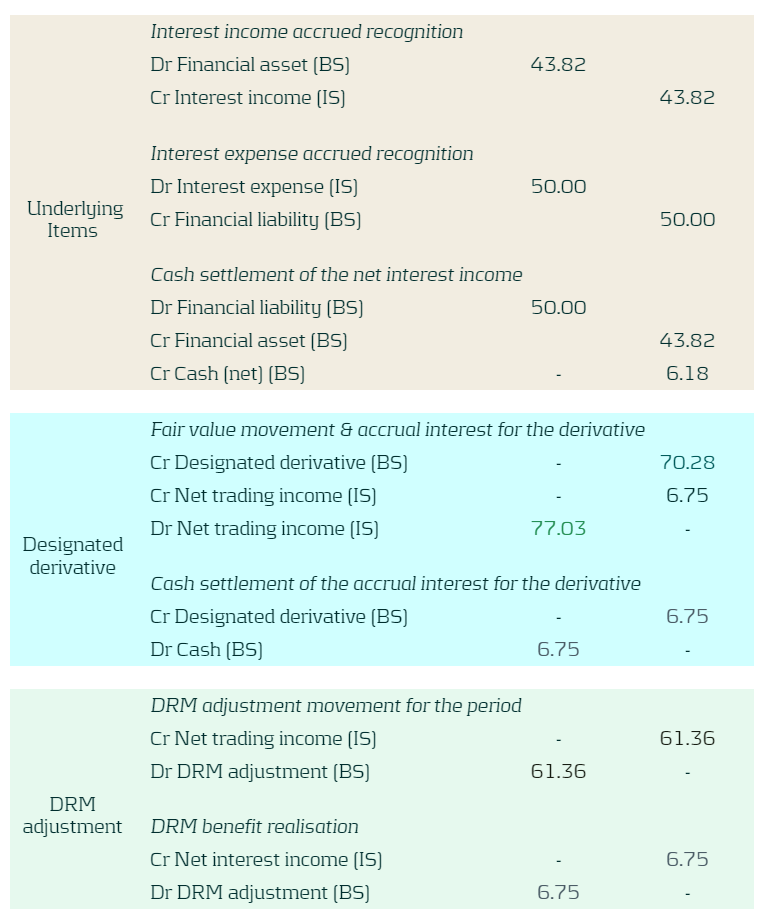
Table 9: Booking figures
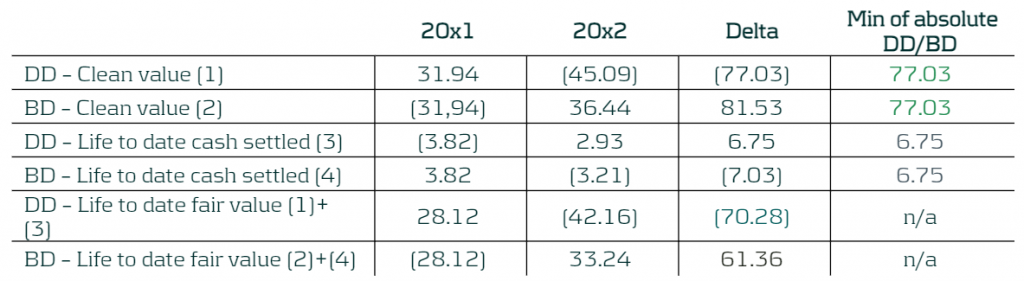
Table 10: Booking figures calculation
Step 7: The last step is the future capacity assessment which was introduced by the IASB in February 2023 and is still under development so the final implementation of this is still to be released. This step is used to replace the previous retrospective assessment that compared the CNOP sensitivity to the TP. The IASB have yet to release more information on the methodology. The example shown does not assume that the future capacity assessment is carried out.
What Next?
The IASB plans to publish an exposure draft by 2025 and so companies start thinking about their process for onboarding the DRM model in their accounting process. The DRM model introduces a range of changes to the hedge accounting framework and the transition process will not be an easy switch. Therefore, companies need to ensure that they have a clear and concise implementation plan to ensure a smooth transition. Involvement from stakeholders from across the company such as (IT, Front Office, Risk, Accounting, Treasury) is required to ensure the project is implemented correctly and in time.
What can Zanders offer?
Transitioning to the new DRM model can be difficult due to the dynamic nature of the model, especially with a more complex balance sheet. Zanders can provide a wide range of expertise to support in the onboarding of the DRM model into your company’s hedging and accounting. We have supported various clients with hedge accounting– including impact analyses, derivative pricing and model validation, and are familiar with the underlying challenges. Zanders can manage the whole project lifecycle from strategizing the implementation, alignment with key stakeholders and then helping design and implement the required models to successfully carry out the hedge accounting at every valuation period.
For further information, please contact Pierre Wernert, or Alexander Oldroyd.
Read our other blogs and learn more on Rethinking Macro Hedging: Introduction to DRM, and Rethinking Macro Hedging: What are the Key Components of the DRM Model?
Citations
- Agenda Paper 4A ↩︎
- The capacity, introduced in Staff Paper 4B – February 2023, assessment is still subject to further development. ↩︎
- Staff Paper 4A – May 2022 ↩︎

The Basel IV reforms, effective January 1, 2025, introduce significant changes to credit risk management.
The Basel IV reforms published in 2017 will enter into force on January 1, 2025, with a phase-in period of 5 years. These are probably the most important reforms banks will go through after the introduction of Basel II. The reforms introduce changes in many areas. In the area of credit risk, the key elements of the banking package include the revision of the standardized approach (SA), and the introduction of the output floor.
In this article, we will analyse in detail the recent updates made to real estate exposures and their impact on capital requirements and internal processes, with a particular focus on collateral valuation methods.
Real Estate Exposures
Lending for house purchases is an important business for banks. More than one-third of bank loans in the EU are collateralised with residential immovable property. The Basel IV reforms introduce a more risk-sensitive framework, featuring a more granular classification system.
Standardized Approach
The new reforms aim for banks to diminish the advantages gained from using the Internal Ratings-Based (IRB) model. All financial institutions that calculate capital requirements with the IRB approach are now required to concurrently use the standardized approach. Under the Standardized Approach, financial institutions have the option to choose from two methods for assigning risk weights: the whole-loan approach and the split-loan approach.
Collateral Valuation
A significant change introduced by the reforms concerns collateral valuation. Previously, the framework allowed banks to determine the value of their real estate collateral based on either the market value (MV) concept or the mortgage lending value (MLV) concept. The revised framework no longer differentiates between these two concepts and introduces new requirements for valuing real estate for lending purposes by establishing a new definition of value. This aims to mitigate the impact of cyclical effects on the valuation of property securing a loan and to maintain more stable capital requirements for mortgages. Implementing an independent valuation that adheres to prudent and conservative criteria can be challenging and may result in significant and disruptive changes in valuation practices.
Conclusion
To reduce the impact of cyclical effects on the valuation of property securing a loan and to keep capital requirements for mortgages more stable, the regulator has capped the valuation of the property, so that it cannot for any reason be higher than the one at origination, unless modifications to that property unequivocally increase its value. Regulators have high expectations for accounting for environmental and climate risks, which can influence property valuations in two ways. On the one hand, these risks can trigger a decrease in property value. On the other hand, they can enhance value, as modifications that improve a property's energy performance or resilience to physical risks - such as protection and adaptation measures for buildings and housing units - may be considered value-increasing factors.
Where Zanders can help
Based on our experience, we specialize in assisting financial institutions with various aspects of Basel IV reforms, including addressing challenges such as limited data availability, implementing new modeling approaches, and providing guidance on interpreting regulatory requirements.
For further information, please contact Marco Zamboni.

The aim of the DRM model is to tie together hedge accounting with risk management strategy so that an entity’s effort to mitigate interest rate risk is better reflected within their financial statement.
In the second instalment of the Zanders series on the DRM model, the Risk Management Strategy (“RMS”) and the DRM process are introduced and with it the new concepts that the IASB have established. The RMS sets out how an entity will manage its interest rate risk, which is the basis of every other part of the DRM model. The IASB has laid out the following expectations for a company’s RMS1:
- Process to approve and amend RMS
- Risk management levels and scope of assets and liabilities
- Risk metrics used
- Range of acceptable risk limits (i.e. the target profile)
- Risk aggregation method and risk management time horizon
- Methodologies to estimate expected cash flows and/or core demand deposits.
Changes to the RMS that result in a change in the target profile (“TP”), lead to a discontinuation of the hedge2. The IASB will further deliberate on when the discontinuation occurs and whether such changes lead to discontinuation of the model at a future date3.
The overall aim of the model is to compare the target profile (“TP”) with the current net open positions (“CNOP”) and thereby produce a risk mitigation intention (“RMI”), which represents the amount of risk that the entity intends to mitigate through the use of designated derivatives. The IASB has tentatively decided that each separate currency should have its own DRM model.
Below a figure of the DRM process can be found that shows how the different components of the model relate to each other. In the following sections a detailed explanation will be provided for each of these elements.

Figure 1: DRM process
As part of the RMS the entity is required to define the target risk metric. The company cannot change this metric for each period and must stick to the metric specified within the RMS. However, the RMS can specify the use of a different metric over different future time horizons. E.g. the company’s RMS could be to stabilise NII for the first three years on notional exposure and then the present value using PV01 for the following years.
Current Net Open Position
The first step in implementing the model is to decide on the assets and liabilities that should be hedged through the DRM framework. The eligible assets and liabilities are currently:
- Financial assets or liabilities must be measured at amortised cost under IFRS 9
- Future transactions that result in financial assets or financial liabilities that are classified as subsequently measured at amortised cost under IFRS 9 ($4.2.1).
Furthermore, the IASB has imposed the following criteria on the eligible assets/liabilities that can be designated in the CNOP4, 5; an asset/liability is only eligible if all the criteria are met:
| No. | Eligibility criteria for the Assets/Liabilities as hedged items |
| 1 | The effect of credit risk does not dominate the changes in expected future cashflows. |
| 2 | Future transactions must be highly probable except in the case of transactions that are the reinvestment or refinancing of existing financial assets/liabilities6. |
| 3 | Items already designated in a hedge accounting relationship are not eligible. |
| 4 | Items must be managed on a portfolio basis for interest rate risk management purposes. |
Table 2: Criteria for Assets & Liabilities
An asset/liability is eligible for the CNOP if all the above criteria are met. The IASB has explored other eligible assets/liabilities and have concluded that assets/liabilities that are FVOCI7 are recommended to be eligible while the ones that are FVPL8 were not recommended to be eligible. Equity was deemed not to be eligible for designation in the CNOP. Since the DRM model is still under review, the eligible assets/liabilities could change before the draft is finalised. Therefore, we advise companies to stay up to date with the latest information.
Target Profile
The Target Profile (TP) is linked to a company’s RMS. It sets the risk limits on the CNOP, before risk mitigation actions can be initiated. When the company assesses the risk over different time buckets, it needs to be consistent with the company’s RMS. All of this should be clearly documented within the company’s RMS. The TP should be set at the time when the hedge relationship is designated. The company can also take action to mitigate risks even before the limits are breached. Stakeholders have raised concerns regarding the granularity for the TP. Therefore, the IASB will conduct further research in this area to identify a common principle to be used universally for the allocation of risk limits for the TP.9
Risk Mitigation Intention
The Risk Mitigation Intention (RMI) is a calculated metric based on the company's efforts, through the use of derivatives, to reduce its CNOP for each period to align with the TP outlined in the RMS. Once the RMI is set, it cannot be changed retrospectively. When an entity is deciding on its RMI the following should be considered10:
- The RMI cannot exceed the CNOP. When entities monitor their CNOP by time buckets, this must hold for any time bucket
- The RMI needs to transform the CNOP position to a residual risk position that sits within the TP
- The RMI needs to be evidenced by real actions taken such as the actual derivates traded in the market
Stakeholders have been concerned that they may not be able to faithfully mitigate the risk with market traded instruments due to liquidity. E.g. there may be little liquidity for a nine-year interest rate swap to hedge an asset that reprices in nine years in the CNOP. Therefore, the IASB has tentatively stated that an entity could use a 10-year swap for a 9-year hedge. Then in the model the RMI is set to be 0 for the 10th year and the benchmark derivative matures on the 9th year. Therefore, the misalignment due to the extra year for the designated derivative would be reported in the profit and loss11.
Designated Derivatives
Designated derivatives are the instruments that mitigate interest risk for the company. These are entered into with external counterparties. They are also used to evidence the RMI that a company is taking. The full list of designated derivatives has not been set, it is expected it will contain interest rate swaps (including basis swaps), forward starting swaps and forward rate agreements12. In Staff Paper 4C – July 2023, the AISB recommended that non-linear derivatives, except for net written options, are eligible as designated derivatives.
Benchmark Derivatives
Benchmark derivatives (BD) are based on the same concepts as IFRS 9’s hypothetical derivatives. These are used to measure the efficacy of the hedging. The benchmark derivatives are based on the following specified characteristics13:
- The benchmark derivative is constructed to be on-market at designation – i.e constructing a “hypothetical” derivative that is nil at zero, where the floating leg replicates the managed risk, and the fixed leg is calibrated to the yield curve. Note that benchmark derivatives are only constructed once and are therefore not reset at every period.
- A benchmark derivative cannot be used to include features in the value of the RMI that only exist in the designated derivative (but not the RMI) – This means that features from the designated derivative cannot be used in the benchmark derivative if they don’t exist in the RMI.
- The amount of risk and the tenor of the benchmark derivative is prescribed by the RMI and expressed in the risk metric (i.e. KPI) the entity manages at the repricing time period – E.g. if an company is using PV01 as the managed KPI, the amount of risk is measured as the sensitivity of one basis point shift in the managed yield curve.
Transitioning to the new DRM model can be difficult due to the dynamic nature of the model, especially with a more complex balance sheet. Zanders can provide a wide range of expertise to support in the onboarding of the DRM model into your company’s hedging and accounting. We have successfully supported various clients with hedge accounting– including impact analyses, derivative pricing and model validation, and are familiar with the underlying challenges. Zanders can manage the whole project lifecycle from strategizing the implementation, alignment with key stakeholders and then helping design and implement the required models to successfully carry out the hedge accounting at every valuation period. As the deadline is quickly approaching it would benefit entities to start assessing the key characteristics of the DRM model in order to understand how to change their current framework to the new one.
For further information, please contact Pierre Wernert, or Alexander Oldroyd.
Read our other blogs and learn more on Rethinking Macro Hedging: Introduction to DRM and The DRM Cycle: The Model in Action.
Citations
- IASB Webcast – October 2022 ↩︎
- Staff Paper 4A – November 2021 ↩︎
- Staff Paper 4A – April 2023 ↩︎
- Staff Paper 4B – April 2018 ↩︎
- Staff Paper 4A – February 2023 ↩︎
- Staff Paper 4C – April 2023 ↩︎
- Fair Value through Other Comprehensive Income ↩︎
- Fair Value through Profit or Loss. ↩︎
- Staff Paper AP4 – July 2022 ↩︎
- Staff Paper 4A – May 2022 ↩︎
- Staff Paper 4B – April 2023 ↩︎
- Staff Paper 4C – July 2023 ↩︎
- Staff Paper 4B – April 2023 ↩︎

First in a series of articles by Zanders introducing the Dynamic Risk Management model proposed by the IASB to revolutionize hedge accounting for dynamic portfolios
The current standards for hedge accounting present significant challenges for financial institutions engaged in dynamically hedging their portfolios. The corresponding type of hedging accounting, known as “macro fair value hedge accounting”, is covered under IAS 39; however, the regulations fall short as they are unable to accurately reflect an organization’s risk management strategies in its financial reporting. In some instances, companies cannot apply hedge accounting as their hedge is deemed to be ineligible unless they perform some form of proxy hedging strategies. To address these issues, the international Accounting Standards Board (“IASB”) have introduced the Dynamic Risk Management (“DRM”) approach, which is intended to offer a more effective method for entities to apply macro hedging.
The current timeline by the IASB is for a first draft to be released in 2025. This article forms the first in a series of three that will delve into the DRM model, explore its improvements over the current regulations and provide a demonstration of a practical implementation of the current proposal. The insights provided within this series, are Zanders’ understanding drawn from the discussion papers that the IASB has released and so the information is subject to change before the publication of the draft in 2025.
The IASB is aiming for the DRM model to allow readers of the financial statement to gain the following insights:
- The entity’s interest rate risk management strategy and how it is applied to manage interest rate risk.
- How the entity’s interest rate risk management activities may affect the amount, timing and uncertainty of future cash flows.
- The effect of the DRM model on the entity’s financial position and financial performance.
Within the May 2022 Staff Paper1, the IASB staff have identified a list of deficiencies of the current IAS 39 and IFRS 9 standards. The main limitations identified were:
| Number | Area | Description of limitation |
| 1 | Closed Portfolios | The current regulations are designed for “closed portfolios” and requires the direct linkage of hedged items with a hedge. This causes problems as currently an “open portfolio” would be viewed as a set of multiple “closed portfolios”, each with short periodic lifespans. This leads to challenges, as any “open portfolio” hedge relationships need to be tracked individually and its hedge adjustments amortized accordingly. |
| 2 | Risk Management on a net basis | Generally, entities will manage their exposures to interest rate risk on a net basis. However, currently hedges need to be managed on a gross basis. This means that interest rate risk management can be incorrectly represented to achieve the accounting requirements. |
| 3 | Dual character of net interest rate risk position | The repricing risk of the net interest rate risk position arises from a combination of variable and fixed-rate exposures. The economic mismatch has both fair value and cash flow variability when interest rates change, and entities try to mitigate both aspects economically. However, the current hedge accounting requirements state that the hedging relationship must be designated as either a fair value hedge with the fixed rate item or as a cash flow hedge with the variable item. |
| 4 | Demand deposits | Under the current regulations demand deposits cannot be hedged by banks as, from an accounting perspective, the fair value is constant. Since banks are unable to apply hedge accounting to demand deposits, they cannot accurately portray their risk management within the financial statements. |
The next two articles in this series will provide a comprehensive exploration of the DRM model and introduce the new concepts that the IASB has proposed. The next article offers a breakdown of the Risk Management Strategy (“RMS”) within the DRM model, how it factors into a company’s overarching strategy for managing their interest rate risk. It will cover the new concepts that the IASB have established. The third and final article in this series will provide an overview of the DRM cycle as well as an example taken from the IASB of how the DRM model would be applied in practice for a singular accounting period. Stay tuned!
What can Zanders offer?
Transitioning to the new DRM model can be difficult due to the dynamic nature of the model, especially with a more complex balance sheet. Zanders can provide a wide range of expertise to support in the onboarding of the DRM model into your company’s hedging and accounting. We have supported various clients with hedge accounting– including impact analyses, derivative pricing and model validation, and are familiar with the underlying challenges. Zanders can manage the whole project lifecycle from strategizing the implementation, alignment with key stakeholders and then helping design and implement the required models to successfully carry out the hedge accounting at every valuation period.
For further information, please contact Pierre Wernert, or Alexander Oldroyd.
Read our other blogs and learn more on The DRM Cycle: The Model in Action, and Rethinking Macro Hedging: What are the Key Components of the DRM Model?
Preventing problematic debt situations or increase access to finance after default recovery?
In countries worldwide, associations of credit information providers play a crucial role in registering consumer-related credits. They are mandated by regulation, operate under local law and their primary aim is consumer protection. The Dutch Central Credit Registration Agency, Stichting Bureau Krediet Registratie (BKR), has reviewed the validity of the credit registration period, especially with regards to the recurrence of payment problems after the completion of debt restructuring and counseling. Since 2017, Zanders and BKR are cooperating in quantitative research and modeling projects and they joined forces for this specific research.
In the current Dutch public discourse, diverse opinions regarding the retention period after finishing debt settlements exist and discussions have started to reduce the duration of such registrations. In December 2022, the four biggest municipalities in the Netherlands announced their independent initiative to prematurely remove registrations of debt restructuring and/or counseling from BKR six months after finalization. Secondly, on 21 June 2023, the Minister of Finance of the Netherlands published a proposal for a Credit Registration System Act for consultation, including a proposition to shorten the retention period in the credit register from five to three years. This proposition will also apply to credit registrations that have undergone a debt rescheduling.
The Dutch Central Credit Registration Agency, Stichting Bureau Krediet Registratie (BKR) receives and manages credit registrations and payment arrears of individuals in the Netherlands. By law, a lender in the Netherlands must verify whether an applicant already has an existing loan when applying for a new one. Additionally, lenders are obligated to report every loan granted to a credit registration agency, necessitating a connection with BKR. Besides managing credit data, BKR is dedicated to gathering information to prevent problematic debt situations, prevent fraud, and minimize financial risks associated with credit provision. As a non-profit foundation, BKR operates with a focus on keeping the Dutch credit market transparent and available for all.
BKR recognizes that the matter concerning the retention period of registrations for debt restructuring and counseling is fundamentally of societal nature. Many stakeholders are concerned with the current discussions, including municipalities, lenders and policymakers. To foster public debate on this matter, BKR is committed to conducting an objective investigation using credit registration data and literature sources and has thus engaged Zanders for this purpose. By combining expertise in financial credit risk with data analysis, Zanders offers unbiased insights into this issue. These data-driven insights are valuable for BKR, lawmakers, lenders, and municipalities concerning retention periods, payment issues, and debt settlements.
Problem Statement
The Dutch Central Credit Registration Agency, Stichting Bureau Krediet Registratie (BKR) receives and manages credit registrations and payment arrears of individuals in the Netherlands. By law, a lender in the Netherlands must verify whether an applicant already has an existing loan when applying for a new one. Additionally, lenders are obligated to report every loan granted to a credit registration agency, necessitating a connection with BKR. Besides managing credit data, BKR is dedicated to gathering information to prevent problematic debt situations, prevent fraud, and minimize financial risks associated with credit provision. As a non-profit foundation, BKR operates with a focus on keeping the Dutch credit market transparent and available for all.
The research aims to gain a deeper understanding of the recurrence of payment issues following the completion of restructuring credits (recidivism). The information gathered will aid in shaping thoughts about an appropriate retention period for the registration of finished debt settlements. The research includes both qualitative and quantitative investigations. The qualitative aspect involves a literature study, leading to an overview of benchmarking, key findings and conclusions from prior studies on this subject. The quantitative research comprises data analyses on information from BKR's credit register.
External International Qualitative Research
The literature review encompassed several Dutch and international sources that discuss debt settlements, credit registrations, and recidivism. There is limited research published on recidivism, but there are some actual cases where retention period are materially shortened or credit information is deleted to increase access to financial markets for borrowers. Removing information increases information asymmetry, meaning that borrower and lender do not have the same insights limiting lenders to make well-informed decisions during the credit application process. The cases in which the retention period was shortened or negative credit registrations were removed demonstrate significant consequences for both consumers and lenders. Such actions led to higher default rates, reduced credit availability, and increased credit costs, also for private individuals without any prior payment issues.
In the literature it is described that historical credit information serves as predictive variable for payment issues, emphasizing the added value of credit registrations in credit reports, showing that this mitigates the risk of overindebtedness for both borrowers and lenders.
Quantitative Research with Challenges and Solutions
BKR maintains a large data set with information regarding credits, payment issues, and debt settlements. For this research, data from over 2.5 million individuals spanning over 14 years were analyzed. Transforming this vast amount of data into a usable format to understand the payment and credit behavior of individuals posed a challenge.
The historical credit registration data has been assessed to (i) gain deeper insights into the relationship between the length of retention periods after debt restructuring and counseling and new payment issues and (ii) determine whether a shorter retention period after the resolution of payment issues negatively impacts the prevention of new payment issues, thus contributing to debt prevention to a lesser extent.
The premature removal of individuals from the system of BKR presented an additional challenge. Once a person’s information is removed from the system, their future payment behavior can no longer be studied. Additionally, the group subject to premature removal (e.g. six months to a year) after a debt settlement registration constitutes only a small portion of the population, making research on this group challenging. To overcome these challenges, the methodology was adapted to assess the outflow of individuals over time, such that conclusions about this group could still be made.
Conclusion
The research provided BKR with several interesting conclusions. The data supported the literature that there is difference in risk for payment issues between lenders with and without debt settlement history. Literature shows that reducing the retention period increases the access to the financial markets for those finishing a debt restructuring or counseling. It also increases the risk in the financial system due to the increased information asymmetry between lender and borrower, with several real-life occasions with
increased costs and reduced access to lending for all private individuals. The main observation of the quantitative research is that individuals who have completed a debt rescheduling or debt counseling face a higher risk of relapsing into payment issues compared to those without debt restructuring or counseling history. An outline of the research report is available on the website of BKR.
The collaboration between BKR and Zanders has fostered a synergy between BKR's knowledge, data, and commitment to research and Zanders' business experience and quantitative data analytical skills. The research provides an objective view and quantitative and qualitative insights to come to a well informed decision about the optimal registration period for the credit register. It is up to the stakeholders to discuss and decide on the way forward.


Take-aways for bank risk management, supervision and regulation
Early October, the Basel Committee on Banking Supervision (BCBS) published a report[1] on the 2023 banking turmoil that involved the failure of several US banks as well as Credit Suisse. The report draws lessons for banking regulation and supervision which may ultimately lead to changes in banking regulation as well as supervisory practices. In this article we summarize the main findings of the report[2]. Based on the report’s assessment, the most material consequences for banks, in our view, could be in the following areas:
- Reparameterization of the LCR calculation and/or introduction of additional liquidity metrics
- Inclusion of assets accounted for at amortized cost at their fair value in the determination of regulatory capital
- Implementation of extended disclosure requirements for a bank's interest rate exposure and liquidity position
- More intensive supervision of smaller banks, especially those experiencing fast growth and concentration in specific client segments
- Application of the full Basel III Accord and the Basel IRRBB framework to a larger group of banks
Bank failures and underlying causes
The BCBS report first describes in some detail the events that led to the failure of each of the following banks in the spring of 2023:
- Silicon Valley Bank (SVB)
- Signature Bank of New York (SBNY)
- First Republic Bank (FRB)
- Credit Suisse (CS)
While each failure involved various bank-specific factors, the BCBS report highlights common features (with the relevant banks indicated in brackets).
- Long-term unsustainable business models (all), in part due to remuneration incentives for short-term profits
- Governance and risk management did not keep up with fast growth in recent years (SVB, SBNY, FRC)
- Ineffective oversight of risks by the board and management (all)
- Overreliance on uninsured customer deposits, which are more likely to be withdrawn in a stress situation (SVB, SBNY, FRC)
- Unprecedented speed of deposit withdrawals through online banking (all)
- Investment of short-term deposits in long-term assets without adequate interest-rate hedges (SVB, FRC)
- Failure to assess whether designated assets qualified as eligible collateral for borrowing at the central bank (SVB, SBNY)
- Client concentration risk in specific sectors and on both asset and liability side of the balance sheet (SVB, SBNY, FRC)
- Too much leniency by supervisors to address supervisory findings (SVB, SBNY, CS)
- Incomplete implementation of the Basel Framework: SVB, SBNY and FRB were not subject to the liquidity coverage ratio (LCR) of the Basel III Accord and the BCBS standard on interest rate risk in the banking book (IRRBB)
Of the four failed banks, only Credit Suisse was subject to the LCR requirements of the Basel III Accord, in relation to which the BCBS report includes the following observations:
- A substantial part of the available high quality liquid assets (HQLA) at CS was needed for purposes other than covering deposit outflows under stress, in contrast to the assumptions made in the LCR calculation
- The bank hesitated to make use of the LCR buffer and to access emergency liquidity so as to avoid negative signalling to the market
Although not part of the BCBS report, these observations could lead to modifications to the LCR regulation in the future.
Lessons for supervision
With respect to supervisory practices, the BCBS report identifies various lessons learned and raises a few questions, divided into four main areas:
1. Bank’s business models
- Importance of forward-looking assessment of a bank’s capital and liquidity adequacy because accounting measures (on which regulatory capital and liquidity measures are based) mostly are not forward-looking in nature
- A focus on a bank’s risk-adjusted profitability
- Proactive engagement with ‘outlier banks’, e.g., banks that experienced fast growth and have concentrated funding sources or exposures
- Consideration of the impact of changes in the external environment, such as market conditions (including interest rates) and regulatory changes (including implementation of Basel III)
2. Bank’s governance and risk management
- Board composition, relevant experience and independent challenge of management
- Independence and empowerment of risk management and internal audit functions
- Establishment of an enterprise-wide risk culture and its embedding in corporate and business processes.
- Senior management remuneration incentives
3.Liquidity supervision
- Do the existing metrics (LCR, NSFR) and supervisory review suffice to identify start of material liquidity outflows?
- Should the monitoring frequency of metrics be increased (e.g., weekly for business as usual and daily or even intra-day in times of stress)?
- Monitoring of concentration risks (clients as well as funding sources)
- Are sources of liquidity transferable within the legal entity structure and freely available in times of stress?
- Testing of contingency funding plans
4. Supervisory judgment
- Supplement rules-based regulation with supervisory judgment in order to intervene pro-actively when identifying risks that could threaten the bank’s safety and soundness. However, the report acknowledges that a supervisor may not be able to enforce (pre-emptive) action as long as an institution satisfies all minimum requirements. This will also depend on local legislative and regulatory frameworks
Lessons for regulation
In addition, the BCBS report identifies various potential enhancement to the design and implementation of bank regulation in four main areas:
1. Liquidity standards
- Consideration of daily operational and intra-day liquidity requirements in the LCR, based on the observation that a material part of the HQLA of CS was used for this purpose but this is not taken into account in the determination of the LCR
- Recalibration of deposit outflows in the calculation of LCR and NSFR, based on the observation that actual outflow rates at the failed banks significantly exceeded assumed outflows in the LCR and NSFR calculations
- Introduction of additional liquidity metrics such as a 5-day forward liquidity position, survival period and/or non-risk based liquidity metrics that do not rely on run-off assumptions (similar to the role of the leverage ratio in the capital framework)
2. IRRBB
- Implementation of the Basel standard on IRRBB, which did not apply to the US banks, could have made the interest rate risk exposures transparent and initiated timely action by management or regulatory intervention.
- More granular disclosure, covering for example positions with and without hedging, contractual maturities of banking book positions and modeling assumptions
3. Definition of regulatory capital
- Reflect unrealised gains and losses on assets that are accounted for at amortised cost (AC) in regulatory capital, analogous to the treatment of assets that are classified as available-for-sale (AFS). This is supported by the observation that unrealised losses on fixed-income assets held at amortised cost, resulting from to the sharp rise in interest rates, was an important driver of the failure of several US banks when these assets were sold to create liquidity and unrealised losses turned into realised losses. The BCBS report includes the following considerations in this respect:
- If AC assets can be repo-ed to create liquidity instead of being sold, then there is no negative impact on the financial statement
- Treating unrealised gains and losses on AC assets in the same way as AFS assets will create additional volatility in earnings and capital
- The determination of HQLA in the LCR regulation requires that assets are measured at no more than market value. However, this does not prevent the negative capital impact described above
- Reconsideration of the role, definition and transparency of additional Tier-1 (AT1) instruments, considering the discussion following the write-off of AT1 instruments as part of the take-over of CS by UBS
4. Application of the Basel framework
- Broadening the application of the full Basel III framework beyond internationally active banks and/or developing complementary approaches to identify risks at domestic banks that could pose a threat to cross-border financial stability. The events in the spring of this year have demonstrated that distress at relatively small banks that are not subject to the (full) Basel III regulation can trigger broader and cross-border systemic concerns and contagion effects.
- Prudent application of the ‘proportionality’ principle to domestic banks, based on the observation that financial distress at such banks can have cross-border financial stability effects
- Harmonization of approaches that aim to ensure that sufficient capital and liquidity is available at individual legal entity level within banking groups
Conclusion
The BCBS report identifies common shortcomings in bank risk management practices and governance at the four banks that failed during the 2023 banking turmoil and summarizes key take-aways for bank supervision and regulation.
The identified shortcomings in bank risk management include gaps in the management of traditional banking risks (interest rate, liquidity and concentration risks), failure to appreciate the interrelation between individual risks, unsustainable business models driven by short-term incentives at the expense of appropriate risk management, poor risk culture, ineffective senior management and board oversight as well as a failure to adequately respond to supervisory feedback and recommendations.
Key take-aways for effective supervision include enforcing prompt action by banks in response to supervisory findings, actively monitoring and assessing potential implications of structural changes to the banking system, and maintaining effective cross-border supervisory cooperation.
Key lessons for regulatory standards include the importance of full and consistent implementation of Basel standards as well as potential enhancements of the Basel III liquidity standards, the regulatory treatment of interest rate risk in the banking book, the treatment of assets that are accounted for at amortised cost within regulatory capital and the role of additional Tier-1 capital instruments.
The BCBS report is intended as a starting point for discussion among banking regulators and supervisors about possible changes to banking regulation and supervisory practices. For those interested in engaging in discussions related to the insights and recommendations in the BCBS report, please feel free to contact Pieter Klaassen.
[1] Report on the 2023 banking turmoil (bis.org) (accessed on October 19, 2023)
[2] Although recognized as relevant in relation to the banking turmoil, the BCBS report explicitly excludes from its consideration the role and design of deposit guarantee schemes, the effectiveness of resolution arrangements, the use and design of central bank lending facilities and FX swap lines, and public support measures in banking crises.

Following the regime shift towards steeply increased interest rates, banks face the challenge of keeping their outcomes for the supervisory outlier test (SOT) on the economic value of equity (EVE) within regulatory thresholds. What causes this? And what can banks do?
Over the past decades, banks significantly increased their efforts to implement adequate frameworks for managing interest rate risk in the banking book (IRRBB). These efforts typically focus on defining an IRRBB strategy and a corresponding Risk Appetite Statement (RAS), translating this into policies and procedures, defining the how of the selected risk metrics, and designing the required (behavioral) models. Aspects like data quality, governance and risk reporting are (further) improved to facilitate effective management of IRRBB.
Main causes of volatility in SOT outcomes
The severely changed market circumstances evidence that, despite all efforts, the impact on the IRRBB framework could not be fully foreseen. The challenge of certain banks to comply with one of the key regulatory metrics defined in the context of IRRBB, the SOT on EVE, illustrates this. Indeed, even if regularities are assumed, there are still several key model choices that turn out to materialize in today’s interest rate environment:
- Interest rate dependency in behavioral models: Behavioral models, in particular when these include interest rate-dependent relationships, typically exhibit a large amount of convexity. In some cases, convexity can be (significantly) overstated due to particular modeling choices, in turn contributing to a violation of the EVE SOT criterium. Some (small and mid-sized) banks, for example, apply the so-called ‘scenario multipliers’ and/or ‘scalar multipliers’ defined within the BCBS-standardized framework for incorporating interest rate-dependent relationships in their behavioral models. These multipliers assume a linear relationship between the modeled variable (e.g., prepayment rate) and the scenario, whereas in practice this relationship is not always linear. In other cases, the calibration approach of certain behavioral models is based on interest rates that have been decreasing for 10 to 15 years, and therefore may not be capable to handle a scenario in which a severe upward shock is added to a significantly increased base case yield curve.
- Level and shape of the yield curve: Related to the previous point, some behavioral models are based on the steepness (defined as the difference between a ‘long tenor’ rate and a ‘short tenor’ rate) of the yield curve. As can be seen in Figure 1, the steepness changed significantly over the past two years, potentially leading to a high impact associated with the behavioral models that are based on it. Further, as illustrated in Figure 2, the yield curve has flattened over time and recently even turned into an inverse yield curve. When calculating the respective forward rates that define the steepness within a particular behavioral model, the downward trend of this variable that results due to the inverse yield curve potentially aggravates this effect.
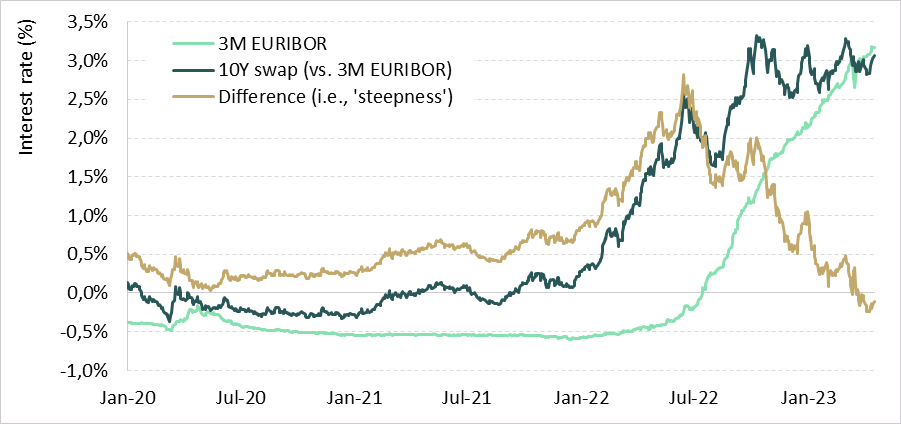
Figure 1: Development of 3M EURIBOR rate and 10Y swap rate (vs. 3M EURIBOR) and the corresponding 'Steepness'
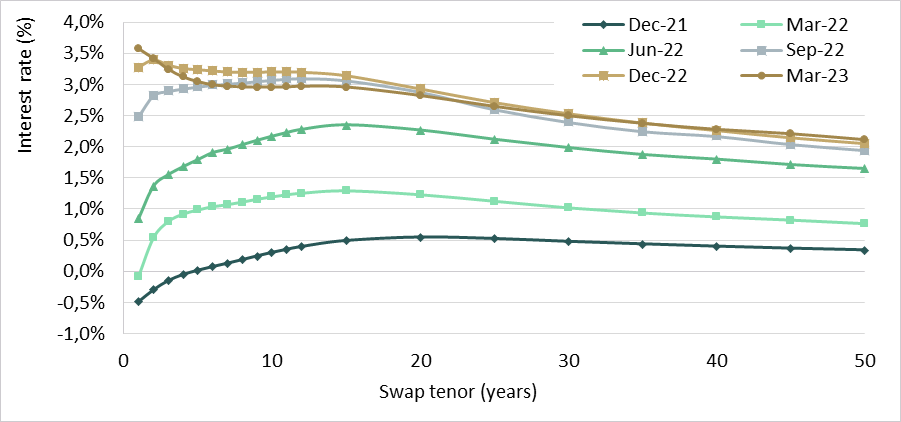
Figure 2: Development of the yield curve over the period December 2021 to March 2023.
- Hidden vulnerability to ‘down’ scenarios: Previously, the interest rates were relatively close to, or even below, the EBA floor that is imposed on the SOT. Consequently, the ‘at-risk’ figures corresponding to scenarios in which (part of) the yield curve is shocked downward, were relatively small. Now that interest rates have moved away from the EBA floor, hidden vulnerability to ‘down’ scenarios become visible and likely the dominating scenario for the SOT on EVE.
- Including ‘margin’ cashflows: Some banks determine their SOT on EVE including the margin cashflows (i.e., the spread added to the swap rate), while discounting at risk-free rates. While this approach is regulatory compliant, the inclusion of margin cashflows leads to higher (shocked) EVE values, and potentially leads to, or at least contributes to, a violation of the EVE threshold.
What can banks do?
Having identified the above issues, the question arises as to what measures banks should consider. Roughly speaking, two categories of actions can be distinguished. The first category encompasses actions that resolve an inadequate reflection of the actual risk. Examples of such actions include:
- Identify and re-solve unintended effects in behavioral models: As mentioned above, behavioral models are key to determine appropriate EVE SOT figures. Next to revisiting the calibration approach, which typically is based on historical data, banks should assess to what extent there are unintended effects present in their behavioral models that adversely impact convexity and lead to unrepresentative sensitivities and unreliably shocked EVE values.
- Adopt a pure IRR approach: An obvious candidate action for banks that still include margins in their cashflows used for the EVE SOT, is to adopt a pure interest rate risk view. In other words, align the cashflows with its discounting. This requires an adequate approach to remove the margin components from the interest cashflows.
The second category of actions addresses the actual, i.e., economic, risk position of bank. One could think of the following aspects that contribute to steering the EVE SOT within regulatory thresholds:
- Evaluate target mismatch: As we wrote in our article ‘What can banks do to address the challenges posed by rising interest rates’, a bank’s EVE is most likely negatively affected by the rise in rates. The impact is dependent on the duration of equity taken by the bank: the higher the equity duration, the larger the decline in EVE when rates rise (and hence a higher EVE risk). In light of the challenges described above, a bank should consider re-evaluating the target mismatch (i.e. the duration of equity).
- Consider swaptions as an additional hedge instrument: Convexity, in essence, cannot be hedged with plain vanilla swaps. Therefore, several banks have entered into ‘far out of the money’ swaptions to manage negative convexity in the SOT on EVE. From a business perspective, these swaptions result in additional, but accepted costs and P&L volatility. In case of an upward-sloping yield curve, the costs can be partly offset since the bank can increase its linear risk position (increase duration), without exceeding the EVE SOT threshold. This being said, swaptions can be considered a complex instrument that presents certain challenges. First, it requires valuation models – and expertise on these models – to be embedded within the organization. Second, setting up a heuristic that adequately matches the sensitivities of the swaptions to those of the commercial products (e.g., mortgages) is not a straightforward task.
How can Zanders support?
Zanders is thought leader in supporting banks with IRRBB-related topics. We enable banks to achieve both regulatory compliance and strategic risk goals, by offering support from strategy to implementation. This includes risk identification, formulating a risk strategy, setting up an IRRBB governance and framework, policy or risk appetite statements. Moreover, we have an extensive track record in IRRBB and behavioral models, hedging strategies, and calculating risk metrics, both from a model development as well as a model validation perspective.
Are you interested in IRRBB related topics? Contact Jaap Karelse, Erik Vijlbrief (Netherlands, Belgium and Nordic countries) or Martijn Wycisk (DACH region) for more information.

CEO Laurens Tijdhof explains the origins and importance of the Zanders group’s purpose.
The Zanders purpose
Our purpose is to deliver financial performance when it counts, to propel organizations, economies, and the world forward.
Recently, we have embarked on a process to align more effectively what we do with the changing needs of our clients in unprecedented times. A central pillar of this exercise was an in-depth dialogue with our clients and business partners around the world. These conversations confirmed that Zanders is trusted to translate our deep financial consultancy knowledge into solutions that answer the biggest and most complex problems faced by the world's most dynamic organizations. Our goal is to help these organizations withstand the current macroeconomic challenges and help them emerge stronger. Our purpose is grounded on the above.
"Zanders is trusted to translate our deep financial consultancy knowledge into solutions, answering the biggest and most complex problems faced by the world's most dynamic organizations."
Laurens Tijdhof

Our purpose is a reflection of what we do now, but it's also about what we need to do in the future.
It reflects our ongoing ambition - it's a statement of intent - that we should and will do more to affect positive change for both the shareholders of today and the stakeholders of tomorrow. We don't see that kind of ambition as ambitious; we see it as necessary.
The Zanders’ purpose is about the future. But it's also about where we find ourselves right now - a pandemic, high inflation and rising interest rates. And of course, climate change. At this year's Davos meeting, the latest Disruption Index was released showing how macroeconomic volatility has increased 200% since 2017, compared to just 4% between 2011 and 2016.
So, you have geopolitical volatility and financial uncertainty fused with a shifting landscape of regulation, digitalization, and sustainability. All of this is happening at once, and all of it is happening at speed.
The current macro environment has resulted in cost pressures and the need to discover new sources of value and growth. This requires an agile and adaptive approach. At Zanders, we combine a wealth of expertise with cutting-edge models and technologies to help our clients uncover hidden risks and capitalize on unseen opportunities.
However, it can't be solely about driving performance during stable times. This has limited value these days. It must be about delivering performance despite macroeconomic headwinds.
For over 30 years, through the bears, the bulls, and black swans, organizations have trusted Zanders to deliver financial performance when it matters most. We've earned the trust of CFOs, CROs, corporate treasurers and risk managers by delivering results that matter, whether it's capital structures, profitability, reputation or the environment. Our promise of "performance when it counts" isn't just a catchphrase, but a way to help clients drive their organizations, economies, and the world forward.
"For over 30 years, through the bears, the bulls, and black swans, financial guardians have trusted Zanders to deliver financial performance when it matters most."
Laurens Tijdhof
What "performance when it counts" means.
Navigating the current changing financial environment is easier when you've been through past storms. At Zanders, our global team has experts who have seen multiple economic cycles. For instance, the current inflationary environment echoes the Great Inflation of the 1970s. The last 12 months may also go down in history as another "perfect storm," much like the global financial crisis of 2008. Our organization's ability to help business and government leaders prepare for what's next comes from a deep understanding of past economic events. This is a key aspect of delivering performance when it counts.
The other side of that coin is understanding what's coming over the horizon. Performance when it counts means saying to clients, "Have you considered these topics?" or "Are you prepared to limit the downside or optimize the upside when it comes to the changing payments landscape, AI, Blockchain, or ESG?" Waiting for things to happen is not advisable since they happen to you, rather than to your advantage. Performance when it counts drives us to provide answers when clients need them, even if they didn't know they needed them. This is what our relationships are about. Our expertise may lie in treasury and risk, but our role is that of a financial performance partner to our clients.
How technology factors into delivering performance when it counts.
Technology plays a critical role in both Treasury and Risk. Real-time Treasury used to be an objective, but it's now an imperative. Global businesses operate around the clock, and even those in a single market have customers who demand a 24/7/365 experience. We help transform our clients to create digitized, data-driven treasury functions that power strategy and value in this real-time global economy.
On the risk management front, technology has a two-fold power to drive performance. We use risk models to mitigate risk effectively, but we also innovate with new applications and technologies. This allows us to repurpose risk models to identify new opportunities within a bank's book of business.
We can also leverage intelligent automation to perform processes at a fraction of the cost, speed, and with zero errors. In today's digital world, this combination of next generation thinking, and technology is a key driver of our ability to deliver performance in new and exciting ways.
"It’s a digital world. This combination of next generation of thinking and next generation of technologies is absolutely a key driver of our ability to deliver performance when it counts in new and exciting ways."
Laurens Tijdhof
How our purpose shapes Zanders as a business.
In closing, our purpose is what drives each of us day in and day out, and it's critical because there has never been more at stake. The volume of data, velocity of change, and market volatility are disrupting business models. Our role is to help clients translate unprecedented change into sustainable value, and our purpose acts as our North Star in this journey.
Moreover, our purpose will shape the future of our business by attracting the best talent from around the world and motivating them to bring their best to work for our clients every day.
"Our role is to help our clients translate unprecedented change into sustainable value, and our purpose acts as our North Star in this journey."
Laurens Tijdhof

Financial institutions spend billions per year in their fight against fraud.
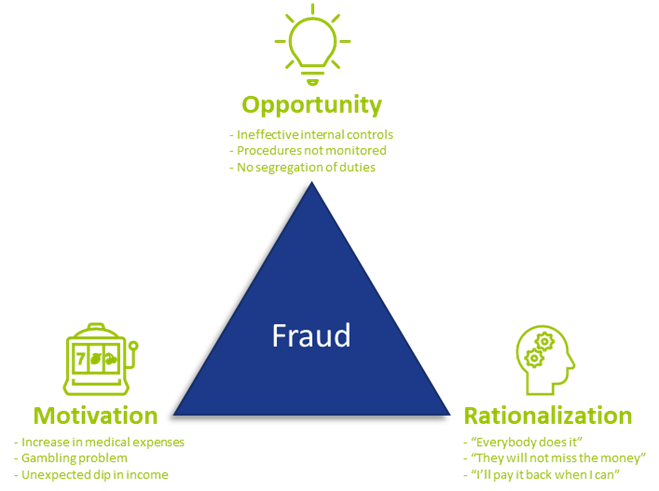
With every improvement, fraudsters look for and find new opportunities to exploit. When the opportunity arises, some people see a big incentive or pressure to commit fraud, and most will be able to justify to themselves why it is acceptable to commit fraud (as shown in the Fraud triangle – Figure 1). Unfortunately, the impact of fraud on organizations, individuals and society in general is substantial.
In a recent report by the Association of Certified Fraud Examiners (ACFE), Occupational Fraud 2022: A report to the nations, it is estimated that organizations lose about 5% of their revenue each year due to employees committing fraud against their employer. It is estimated that more than USD 4.7 trillion is lost worldwide to occupational fraud. Of these, most cases were identified through a tip to a hotline and most were not detected until 12 to 18 months later. The longer the fraud was undetected, the higher the loss. But organizations do not only fight fraud internally; external threats are also on the rise. As businesses evolve and processes are automated and digitalized, fraud activities become much more complex.
Data and modeling approach to fraud prevention
To effectively prevent fraud, it first needs to be identified. Traditionally, employees are trained to identify anomalies or inconsistencies in their daily work environment. It is still crucial that your employees know what to look for and how to spot suspicious activities. But due to the complexities and vast amounts of information available, and because fraudsters are becoming more sophisticated, it becomes much more difficult to determine whether a potential customer is a fraudster or a real client.
The good news is that digitalization and increased data availability provides the opportunity for data analytics. It is important to note here that it does not completely replace your current processes; it should be used in addition to your traditional prevention and/or detection methods to be more effective to proactively identify and prevent fraud in your organization.
Benefits of data analytics
Traditionally, sampling was done on a population to test for fraud instances, but this may not be as effective because it only looks at a small population. Because fraud numbers reported usually being small (but with a large monetary impact), it is possible to overlook valuable insights if only samples of populations are investigated. Ideally, all data should be included to identify trends and potential fraudulent activities, and with data analytics that is possible. By analyzing large amounts of data, organizations can identify patterns and trends that may indicate fraudulent activity. It can help to improve the accuracy of fraud detection systems, as they can be trained to recognize these patterns.
Data analytics can increase efficiency by reducing false positives and false negatives and assists organizations to automate parts of the fraud detection processes, which can save time and resources. This allows the business to focus on other important strategic objectives and tasks such as customer service and product development.
By using data analytics to identify and prevent fraudulent activity, organizations can help to protect their customers against financial losses and other harm. Customer trust and loyalty are built when organizations show they are serious about the welfare and safety of their customers.
Detecting and preventing fraud
Reality is that preventing fraud upfront or in an early stage is much more economical and beneficial than having to detect fraud after the fact, as investigations are time-consuming and the fraud is not always easy to proof in court. Moreover, by the time it is detected, a loss may have already been incurred. Using data analytics to identify fraudsters and fraudulent activities earlier, can protect the bottom line by reducing financial losses and improving the organization’s overall financial performance.
By using analytics to detect and prevent fraud, organizations can demonstrate to regulatory bodies that they are taking compliance seriously. Reporting suspicious transactions and activities to regulatory bodies is a key component of complying with anti-money laundering and counter-terrorism financing legislation, and analytics can assist with identifying these transactions and activities more effectively.
Data analytics can be used to prevent fraud at onboarding, detect it in the existing customer base, and to make your operational processes more efficient. More specifically, data analytics can be used and leveraged as follows:
- Identifying outlier trends and hidden patterns can highlight areas and/or transactions that are more vulnerable to fraud.
- Automating identification of exceptions removes manual intervention and makes the identification criteria more consistent.
- Traditional physical reviews using limited resources to investigate is time-consuming. Data analytics can be used to prioritize the ones with the highest impact and risk, e.g. investigate the suspicious transactions with the highest value first.
- Combining data from different data sources to feed into a model provides a more holistic view of a customer or scenario than looking at individual transactions or applications in isolation.
- Both structured and unstructured data can be used to prevent and detect fraud.
- Fraud propensity model scoring can run automatically and generate results to be reviewed and investigated in real-time or near real-time.
- Analyzing relationships between various entities and customers using Social Network Analysis (SNA). Traditionally, networks/links were identified by the investigator while building a case. By using analytics, less time is needed to identify these relationships. Also, it identifies valuable links previously unknown, as additional levels of relationships can be examined.
- Specific modus operandi identified by the organization’s internal fraud team can be translated into data models to automate identification of similar cases. (See Case study below)
- Applying a fraud model to the organization’s bad debt book can assist with your collections strategy. Fraudsters never intended to pay and focusing your collection efforts on them wastes time and valuable resources. Most efforts should be on those cases where money can be collected.
Case study
The Zanders data analytics team has experience with applying data analytics within a company to identify customers who create synthetic profiles at point of application. By working closely with investigators, a model was developed in which one out of every three applications referred for investigation was classified as fraudulent.
The benefit of introducing analytics was twofold – from an onboarding- and existing customer point of view. The number of fraudsters identified before onboarding increased, preventing (potential) losses. Using the positive identified frauds at point of application, and checking the profile against the existing book, helped to identify areas that were more vulnerable where investigation should be prioritized.
The project proved that:
- Data analytics is valuable and combining it with insights from the operational teams is powerful.
- The buy-in from the stakeholders made the model more effective. If the team investigating the alert does not trust the model or does not know what to look for, there will be resistance in investigating the alerts.
- Taking your internal fraud team on a data and analytics journey is a must. They need to understand the impact that their decisions and captured outcomes can have on future models.
- Challenges with false positives (within business appetite and investigation capacity) are a reality, but having a model is better than searching for a needle in a haystack. Learning from the results and outcomes of the investigations, even if they were false positives, will enhance your next model.
- One size does not fit all. Fraud models need to be tailored to the business’ needs.
Conclusion
While using data analytics to identify fraudulent activities is an investment, organizations need to outweigh the benefit of incorporating data analytics in their current processes against the potential losses. Fraud not only results in monetary losses, it can lead to reputational damage and have an impact on the organization’s market share as customers will not do business with an organization where they don’t feel protected. Your customers also expect great customer service and implementing proactive fraud prevention measures increases confidence in your organization.
How can Zanders help your organization?
Did you find this article helpful but do you still have questions or need additional assistance? Our team of experts is ready to assist you in finding the solutions you need. Please feel free to reach out to us to discuss your needs in more detail. Whether you’re looking for advice on a specific project or just need someone to exchange ideas with, we are here to assis


