IFRS 9 - Annual Report Study


Zanders has conducted an annual report study for IFRS 9 results across 4 different European markets. These regions are the Nordics, the Netherlands, DACH and the UK.
First, these regions were analyzed independently such that common trends and differences could be noted within. These results were aggregated for each region such that these regions could be compared with each other. The results show that within European regions the year-on-year trends are similar between banks, but that across these regions the trends do differ across the years. Because the systemic macroeconomic trends the last years were similar between regions (Covid-19 and the war in Ukraine ), it shows that there are significant cultural differences in how ECLs are modelled. This shows that there is a need for alignment between European regions for which Zanders can assist. Namely, we have a presence in each of these regions and are actively monitoring development in the area of IFRS 9 (also see our previous research on IFRS 9).
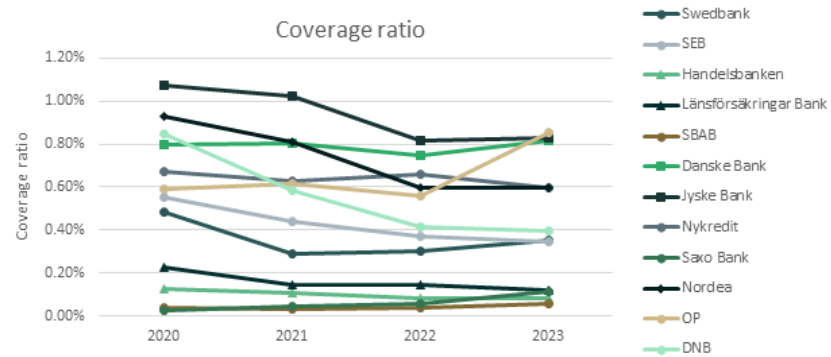
Nordics
The overall coverage ratios for most of the Danish, Swedish, Norwegian and Finnish banks1 (Nordic region) showed a slightly decreasing trend from 2020 to 2023, except for OP, which had a significant absolute increment of 0.25% to 0.86% in 2023 compared with the previous three years due to an increase in the stage 2 coverage ratio and a higher Stage 1 to 2 ratio. OP also had the highest overall coverage ratio among the sampled banks. The decreasing trend in the overall coverage ratio was primarily attributed to the decline in the Stage 3 coverage ratio.
On the other hand, the change in the Stage 1 coverage ratio was relatively stable over the years, with an absolute difference of less than 0.09% between the maximum and minimum values across the four-year period. The Stage 2 coverage ratio exhibited a similar trend across banks, except for Jyske Bank, which showed a volatile pattern, with an absolute difference of over 3% between the maximum and minimum values throughout the four years, peaking at 4.74% in 2023. In addition, the overall and the Stage 3 coverage ratios varied from 0.06% to 0.86% and 16.3% to 45.6% across banks in 2023.
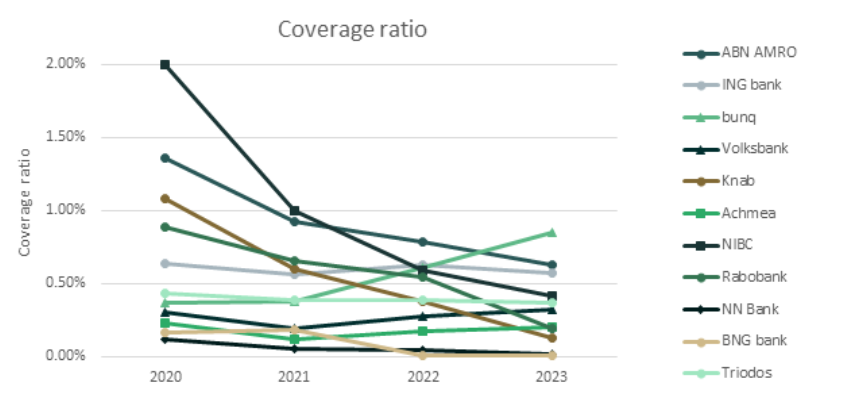
Netherlands
There was a slight decrease in the overall ECL results for the Dutch market2 over the four-year study period (also see the previous research on the Dutch market). This was primarily driven by an improved macroeconomic outlook and a further reversal of manual overlays that were applied during the COVID-19 period (e.g., ABN AMRO).
Compared with 2022, larger banks (Rabobank and ABN AMRO) showed a decrease in the overall coverage ratio with a higher weight given to the up scenario. In contrast, smaller banks tended to have a higher coverage ratio due to shifting more weight from the up scenario to the base scenario or changes in the underlying models.
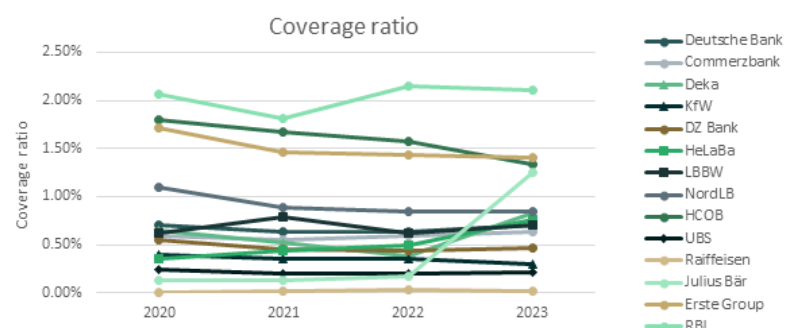
DACH
For the German, Austrian and Swiss region (DACH),3 a relatively stable trend was observed in the overall coverage ratio from 2020 to 2022, which was then countered by a sharp upward trend from 2022 to 2023. Among the banks noted, RBI stood out from its peers in reporting significantly higher overall, Stage 2 and Stage 3 coverage ratios during the study period. RBI is one of Austria's leading corporate and investment banks, operating in Central and Eastern European markets. In some Eastern European countries, Stage 2 loans remain exceptionally high, at 15 to 20 percent, leading to large overall and Stage 2 coverage ratios.
Compared to 2022, the increase in the overall coverage ratio can be attributed to higher Stage 2 coverage ratios for half of the sampled banks. Julius Bär also experienced an exceptionally high stage 3 coverage ratio of up to 93% in 2023, primarily from its Lombard loan portfolio.
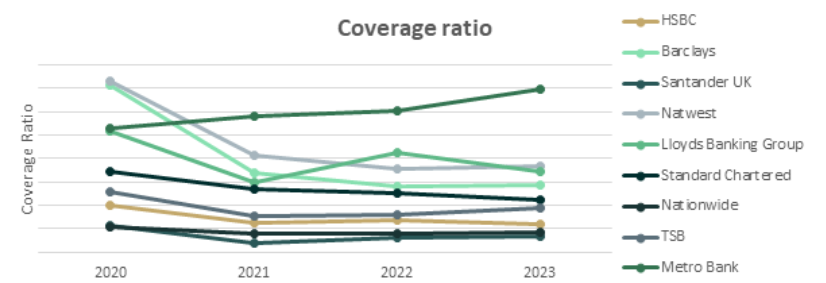
UK
During the benchmarking period from 2020 to 2023, most UK banks4 reported a decrease in the overall coverage ratio from 2020 to 2021. Then the overall coverage ratio stabilized for the remaining two years, except for one of the sampled banks, whose coverage ratio had been increasing since 2021 and recorded the second-highest overall coverage ratio in 2024 (i.e. 1.6% vs. the median of 0.8% for all sampled UK banks).
The highest coverage ratio of all years is from Monzo. As a relatively new digital bank focused on expanding, Monzo has significantly expanded its lending in recent years, with a doubling of the gross carrying amount in the latest reporting period. However, their overall coverage ratios remained high, at around 14% to 14.6% over the past two years. In the figure below (and the figures at the end of the article), Monzo has been excluded, as it individually inflated the results and rendered the other results unreadable.
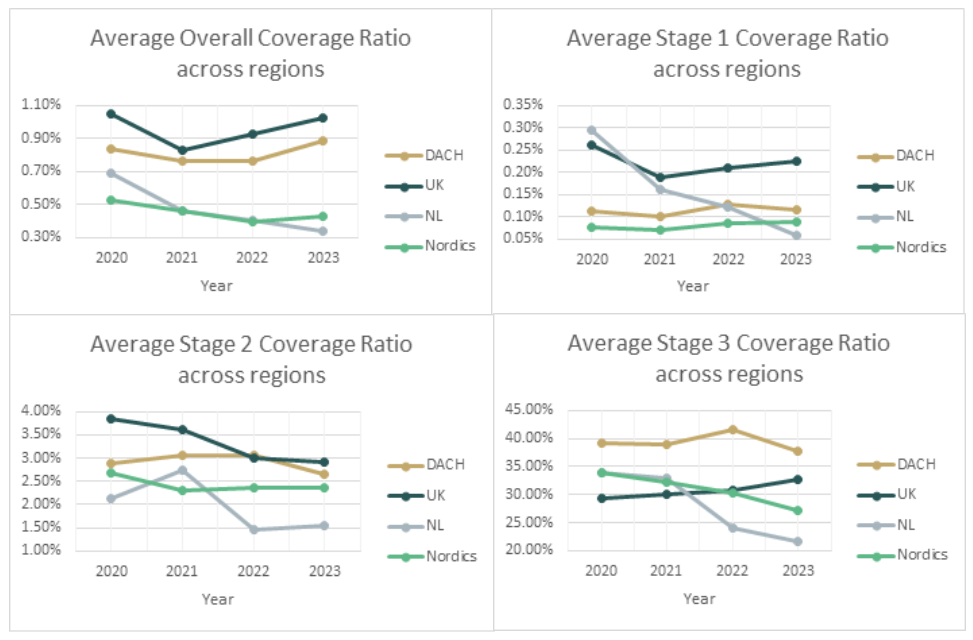
Across regions
In general, all regions showed a decrease in the overall ECL coverage ratio during the initial benchmarking period, from 2020 to 2021. Compared to 2020, the coverage ratio in the most recent year has decreased, except for the DACH region, where the overall coverage ratio has reached a level comparable to that of the UK, due to a significant increase in Stage 2 numbers. The UK has the highest overall, as well as Stage 1 and Stage 2 coverage ratios, while the DACH region has the highest Stage 3 coverage ratios (i.e., the highest LGD).
In short, this shows that both the UK and DACH region demonstrate a higher overall coverage ratio, which seems to be consistent throughout all the years from 2020 onwards. Even the lowest reported average coverage ratio for the DACH region, 0.76% in 2021 is higher than the highest reported value for the Netherlands, 0.69% in 2020. As the values differ greatly between regions while the macroeconomic occurrences were similar (Covid-19, Ukraine war), it could be noted that this must be caused by significant differences in how the ECLs are modelled. And as markets are not aligned how to model ECL, it is worthwhile to further investigate how European regions can learn from each other in modeling ECL.
As Zanders has a presence in each of these regions and is in constant contact with many of the active banks in those regions, we are the best strategic partner to help improving your IFRS 9 modeling. Whether it is an independent validation of an existing model of if help is needed with the (re)development of new IFRS 9 models, we can help clients achieve the optimal accuracy with regards to their ECL estimates.
If you wish to learn more about IFRS 9 please contact Kasper Wijshoff.
-
IFRS 9 Study 2026: Steady Coverage, Diverging Signals

-
Risk Mitigation Accounting (RMA) Exposure Draft amending IFRS9: Key Impacts and Practical Challenges

-
IFRS 9 Amendments: Settlement-Date Accounting and the End of Distorted Liquidity Positions

-
Annual IFRS 9 Study 2025: Key Developments in the Dutch Banking Sector

-
IFRS 18: What Treasury Needs to Know Now

-
Exploring IFRS 9 Best Practices: Insights from Leading European Banks

-
Six years after the introduction of IFRS 9: Where do we stand?

-
IFRS 17: the impact of the building blocks approach

-
Hedge accounting changes under IFRS 9

-
The forward-looking provisions of IFRS 9

Citations
- The Nordic banks that were included in the analysis were the following: Swedbank, SEB, Handelsbanken, Länsförsäkringar Bank, SBAB, Danske Bank, Jyske Bank, Nykredit, Nordea, OP, DNB. ↩︎
- The Dutch banks that were included in the analysis were the following: ABN AMRO, ING bank, bunq, Volksbank, Knab, Achmea, NIBC, Rabobank, NN Bank, BNG bank, Triodos. ↩︎
- The banks in the DACH region that were included in the analysis were the following: Deutsche Bank, Commerzbank, Deka, KfW, DZ Bank, HeLaBa, LBBW, NordLB, HCOB, UBS, Julius Bär, Erste Group, RBI. ↩︎
- The banks in the UK that were included in the analysis were the following: HSBC, Barclays, Santander UK, Natwest, Lloyds Banking Group, Standard Chartered, Monzo, Nationwide, TSB, Metro Bank, Close Brothers, Atom Bank, Revolut. ↩︎


