Over the past year, the interest rates on intercompany financial transactions have come under closer examination by tax authorities. This intensified scrutiny stems from a mix of factors, including evolving regulations, more sophisticated audit procedures, the need from governments to boost revenue, and of course, high-interest-rate environment.
As a result, these transactions are now being assessed with greater depth and rigor than ever before. Historically, tax authorities focused on interest rate benchmarks as the primary point of analysis. However, their attention has now widened significantly to cover a range of interrelated considerations.
Below is a brief overview of the key trends and areas attracting the most scrutiny in today’s landscape, highlighting what multinationals should pay attention to in 2025:
Arm’s length T&Cs
In the past years, tax authorities are closely examining the terms and conditions of intra-group debt, scrutinizing the pricing of loans and the effects of increased leverage.
Accordingly, it is critical to ensure that the loan’s terms and conditions reflect the arm’s length standards and align with the actual economic substance of the transaction. This includes evaluating whether a hypothetical independent borrower, under similar conditions, could and would obtain a comparable loan.
In addition to establishing an arm’s length interest rate and the appropriate amount of debt (further explained below), it is also necessary to assess whether the other terms and conditions are at arm’s length. This involves considering the main features of the loan—such as currency, maturity, repayment schedule, and callability—and evaluating their impact on the risk profile of both the borrower and the lender, as well as on the arm’s length interest rate.
In this regard, tax authorities may challenge intra-group loans that do not include a maturity date, have an excessively long maturity (e.g., over 25 years), or lack a repayment schedule, since third-party loans would generally include these provisions.. They might also challenge situations where the actual conduct of the parties does not reflect the terms and conditions outlined in the loan agreement. For example, if the parties apply a different maturity or repayment schedule than the one initially agreed upon—without amending the legal documentation, which often happens in a dynamic intra-group financing environment—this could prompt further scrutiny from tax authorities.
As a result, it is important for multinational enterprises to carefully consider these terms and conditions before issuing a loan, as they will have a direct impact on the interest rate applied in the transaction. Drafting a comprehensive loan agreement that clearly outlines these terms, aligns with the conditions applied in practice, and is supported by a robust Transfer Pricing analysis is recommended to mitigate the risk of challenges by tax authorities.
Debt Capacity Analysis
One of the most important terms and conditions that must meet arm’s length standards is the so-called quantum of debt (i.e. nominal amount of the loan extended). Tax authorities are increasingly scrutinizing whether the amount of intra-group debt is economically justified and supported by a clear business purpose. They also evaluate whether the debt aligns with arm’s length principles and serves a legitimate economic function consistent with the borrower’s overall business strategy.
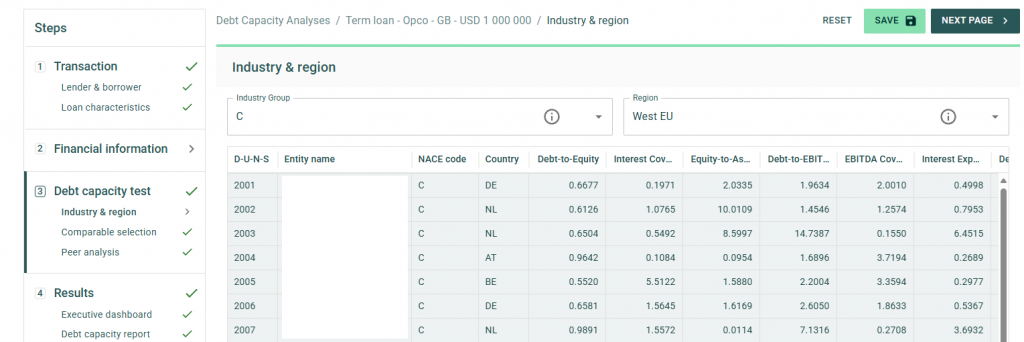
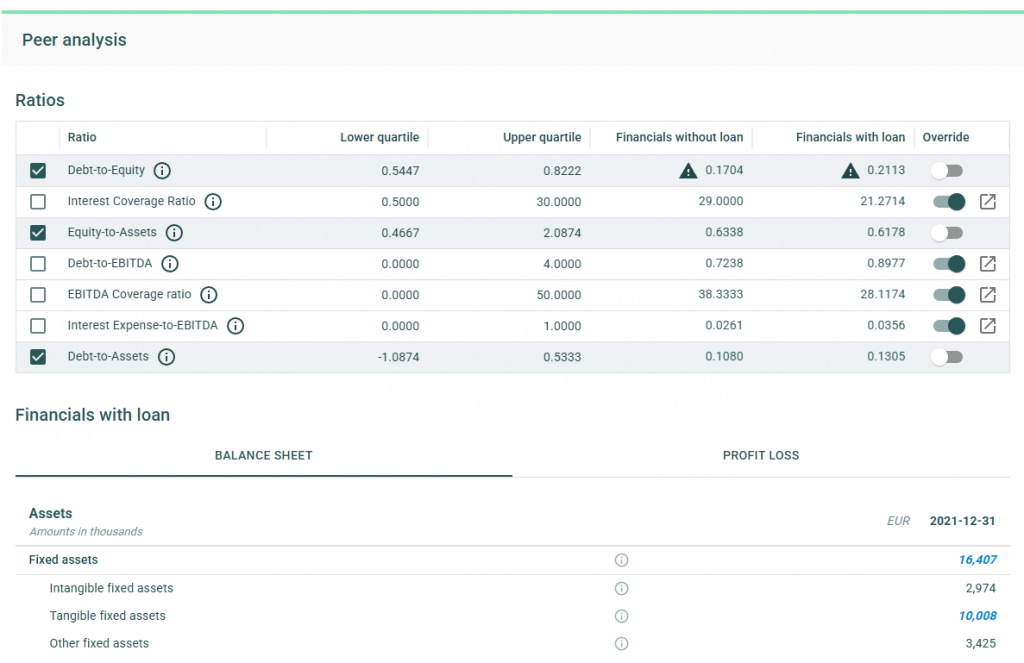
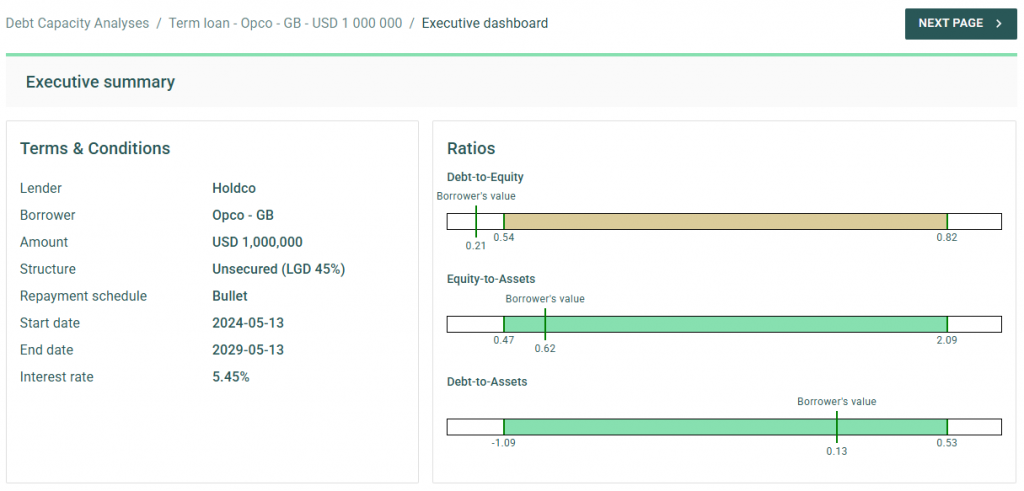
A debt capacity analysis is often conducted to determine whether the borrower has the financial capacity to repay the loan and whether an unrelated party would provide a similar amount of financing under comparable conditions.
While many jurisdictions have long required this type of analysis in practice, Germany has taken a step further by formalizing this requirement under its 2024 Growth Opportunities Act. This was further clarified on December 12, 2024, when the German Federal Ministry of Finance issued administrative principles providing specific guidance on financing relationships under the new Transfer Pricing provisions. According to these principles, the debt capacity test hinges on two key criteria:
(i) a credible expectation that the debtor can meet its obligations (e.g., interest payments and principal repayments),
and (ii) a commitment to provide financing for a defined period.
As a result, multinational enterprises are expected to robustly justify the level of debt assumed by their subsidiaries, particularly for entities operating in Germany.
Credit Rating Analyses
Tax authorities are increasing their focus on credit rating analyses. While simplified approaches, such as applying a uniform credit rating across all subsidiaries, were once more widely accepted, current practices favour a more detailed entity by entity evaluation. This involves first assigning a stand-alone credit rating to the individual borrower and then adjusting it to account for any implicit or explicit group support.
In this context, Swiss tax authorities published last year a Q&A addressing various Transfer Pricing topics. In the section on financial transactions, they emphasized a clear preference for the bottom-up approach described above. This aligns closely with the OECD Transfer Pricing Guidelines and is consistent with the prevailing practices in most jurisdictions.
In contrast, the administrative principles issued in Germany appear to take a different direction. According to the new rules, the arm’s-length nature of the interest rate for cross-border intercompany financing arrangements must generally be determined based on the group’s credit rating and external financing conditions. However, taxpayers are allowed to demonstrate that an alternative rating better aligns with the arm’s-length principle.
This new approach diverges not only from the OECD guidelines but also from previous case law established by the German Federal Tax Court. As a result, several questions arise regarding how these rules will be applied in practice by German tax authorities. For instance, it remains unclear whether this approach will constitute a strict obligation or whether flexibility will be granted. Additionally, concerns exist about the burden of proof placed on taxpayers when opting for the bottom-up approach recommended by the OECD Transfer Pricing Guidelines.
Cash Pool Synergy Distribution
Tax authorities are increasingly aligning with Chapter X of the OECD Guidelines when evaluating cash pooling arrangements, with particular attention to the distribution of synergies among pool participants.
According to the OECD Transfer Pricing Guidelines (Section C.2.3.2, paragraph 10.143), synergy benefits should generally be allocated to pool members by determining arm’s length interest rates that reflect each participant’s contributions and positions within the pool (e.g., debit or credit).
Historically, the focus of tax authorities was primarily on the pricing methodologies— ensuring that both deposit and withdrawal margins were set at arm’s length. However, there is now a growing emphasis on how synergy benefits are distributed among participants. This is especially significant in jurisdictions where participants make substantial contributions to the pool balance. According to the OECD guidelines, these participants should benefit from the synergies generated by the pool through more favourable financing terms.
To address these requirements and reduce the risk of disputes over cash pool structures, a three-step approach is recommended:
1- Price the credit and debit positions of the participants.
2- Calculate the synergy benefits generated within the structure.
3- Allocate these benefits between the Cash Pool Leader and participants by adjusting the price applied to the participants.
By following this approach, multinationals can ensure compliance with OECD guidelines and mitigate the likelihood of challenges from tax authorities.
Zanders Transfer Pricing Solution
As tax authorities intensify their scrutiny, it is essential for companies to carefully adhere to the recommendations outlined above.
Does this mean additional time and resources are required? Not necessarily.
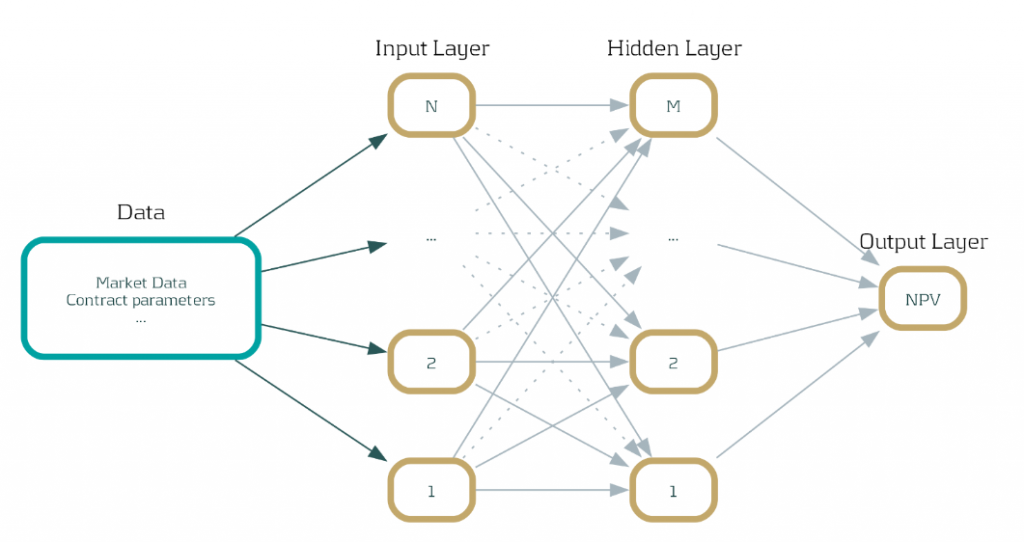
Technology provides an opportunity to minimize compliance risks while freeing up valuable time and resources. The Zanders Transfer Pricing Suite is an innovative, cloud-based solution designed to automate the transfer pricing compliance of financial transactions.
With over seven years of experience and trusted by more than 80 multinational corporations, our platform is the market-leading solution for intra-group loans, guarantees, and cash pool transactions.
Our clients trust us because we provide:
- Transparent and high-quality embedded intercompany rating models.
- A pricing model based on an automated search for comparable transactions.
- Automatically generated, 40-page OECD-compliant Transfer Pricing reports.
- Debt capacity analyses to support the quantum of debt.
- Legal documentation aligned with the Transfer Pricing analysis.
- Benchmark rates, sovereign spreads, and bond data included in the subscription.
- Expert support from our Transfer Pricing specialists.
- Quick and easy onboarding—completed within a day!