Innovations in PD Modeling for IFRS 9: Extending the Vasicek Framework

In the rapidly shifting landscape of financial risk management, accurate estimation of default probabilities is crucial for informed decision-making.
According to the IFRS 9 standards, financial institutions are required to model probability of default (PD) using a Point-in-Time (PiT) measurement approach — a reflection of present macroeconomic conditions. In practice, PiT PD estimates are most often obtained through the conversion of their Through-the-Cycle (TtC) counterpart. As the Vasicek model has long stood as the industry-standard for this conversion, Zanders is continuously driving model enhancements through novel research. This research delves into modern adaptations of the industry-standard Vasicek methodology.
This article highlights collaborative research involving 17 students from Erasmus University Rotterdam, aiming to infuse greater granularity into credit risk modeling. Research was conducted by four student teams in the form of a group seminar project. Additionally, one student investigated this topic as part of her master thesis. By integrating both advanced statistical and machine learning techniques, this research showcases how modern adaptations could be introduced to redefine the traditional Vasicek framework, offering deeper insights into PD conversion methodologies. These enhancements provide flexibility and interpretability and contribute to a more extensive modeling toolkit.
Background
Compliance with International Financial Reporting Standard (IFRS 9) requires companies to obtain PiT PD estimates, which are influenced by macroeconomic variables. Banks reporting under IFRS 9 often use the TtC counterpart as a starting point, making use of various different conversion techniques to obtain the PiT PD (also our previous blog post A comparison between Survival Analysis and Migration Matrix Models). The industry-standard methodology to obtain these is by means of conversion through the Vasicek framework. The TtC PD reflects the PD irrespective of systemic factors, thereby reflecting the long-term average of the PD. Contrarily, the PiT PD reflects the probability that a party defaults at a specific point in the macroeconomic cycle, implying that PiT PD estimates fluctuate throughout the macroeconomic cycle. The mathematical technique introduced by Vasicek in 1977 and formalized in 2002 (Vasicek, An equilibrium characterization of the term structure, 1977; Vasicek, The distribution of loan portfolio value, 2002), serves as the industry-standard method for performing this conversion, integrating both systematic and idiosyncratic risks.
Understanding the Vasicek Model
Under the Vasicek model, the PiT PD can be derived from the TtC PD with the use of the Z-factor, which is defined as the state of the economy. The Z-factor corresponds to the systematic factor within the Vasicek framework and should be modeled as a function of macroeconomic variables. The linear regression constitutes a benchmark for modeling the Z-factor within the IFRS 9 framework due to its simplicity and the interpretability of its predictions. Formally, the Vasicek model is denoted as:
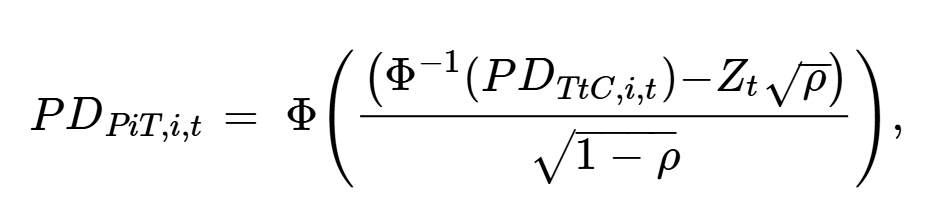
where PDPiT,i,t represents the PiT PD of firm i at time t. The economic state at time t is denoted as Zt, with ρ representing the correlation between firm i’s asset returns and the economic state. The Vasicek model assumes normality in asset returns and integrates both systematic and idiosyncratic risk, making it suitable for a broad range of applications.
Despite its simplicity and theoretical consistency, the model also faces critiques for its limitations under certain conditions (Basson & Van Vuuren, 2023), such as:
- Simplistic Linearity Assumptions
- Distributional Assumptions
- Static Correlation Structure
These limitations can cause inaccurate PD estimations resulting in poor risk management, which could be detrimental for financial institutions. The industry-standard model often struggles with the extreme economic scenarios or sector-specific variations that are the most informative to predict. As the IFRS 9 principles allow for more freedom with regards to the modeling usage (while still being explainable), these limitations lead to ongoing exploration for enhancements.
Extending the Vasicek Model
To improve the Vasicek model, three different approaches were considered. The first approach covers extending the Vasicek model to a non-linear model which does not rely on linear assumptions. Secondly, granularity is added to the Vasicek model by considering a multitude of Copula functions. Finally, the correlation between a firms asset returns and the economic state is made time- and industry dependent in order to relax the assumption of a static correlation structure.
Non-linear Techniques: Enhancing Z-Factor Modeling
The Z-factor is heavily influenced by many interconnected variables, with regulations and policies leading to increasingly complex dynamics that are difficult to accurately model. As of now, the industry-standard method to model the Z-factor is through the use of linear regression. However, one could argue that the real-world state of the economy rather exhibits non-linear patterns.
To introduce this non-linearity, many methodologies were considered, including statistical models such as regularized regressions and regime-switching models. Additionally, Machine Learning (ML) techniques, ranging from Gradient Boosting to Neural Network approaches, have been proposed to better capture the intricate relationships that cannot be captured by linear models. These techniques (partly) relax assumptions on the underlying data structures and help in understanding complex patterns in the data, offering improved estimation accuracy while minimizing overfitting risks. Such models are particularly beneficial when dealing with high-dimensional data where traditional approaches tend to underfit.
Our findings indicate that Z-factor estimation accuracy can significantly be improved upon, using models such as the regime-switching model or the long short-term memory neural network. These models showed significantly more accurate Z-factor estimation, both in-sample and out-of-sample. Other ML models included in this research do not show a significant increase in prediction accuracy as compared to the single factor Vasicek model. However, the use of these models also adds an extra layer of complexity to the modeling approach.
As IFRS 9 regulations require model predictions to be interpretable, frameworks such as SHapley Additive exPlanations (SHAP) can be introduced as a measurement tool. Although SHAP values do not equal full explainability, they can be used to assess feature importance and general insights into the identity and magnitude of important macroeconomic variables used for Z-factor prediction. This increased complexity and decreased interpretability of the modeling process, makes that additional academic and/or regulatory advancements need to be made before ML methods can be used within IFRS 9 frameworks. One could argue whether the additional complexity introduced by using ML models justifies the marginal increase in estimation accuracy.
Copula Approach: Distributional Flexibility
Risks are often aggregated over broad sectors or asset classes without considering nuances at more granular levels. Such a model may overlook specific risk drivers relevant to particular firms or industries, leading to less accurate PD estimates.
The second research direction involves using Copula-based methodologies to inject granularity into PiT PD estimations. Within the Copula approach, dependencies between random macroeconomic variables can be captured independently of their respective distributions. This approach thus allows for a more accurate description of the system’s behavior, where the system consists of m macroeconomic variables and the Z-factor. Moreover, each (macroeconomic) variable can be modeled by its empirical CDF, avoiding the need for parametric assumptions. The option to avoid making any distributional assumptions makes the copula approach very flexible.
By allowing for more flexible dependency structures, Copula models can provide a better representation of tail risks. This is particularly relevant for IFRS Stage 2 loans, which includes financial instruments that have shown a significant increase in credit risk since initial recognition. In this research a variety of conditional Copula models are considered and tested. The conditional Copula computes the distribution of the Z-factor conditional on the m macroeconomic variables in the system. Despite challenges like the Gaussian Copula’s inability to model joint extreme events effectively, alternatives such as the t-Copula show a statistically significant improvement over the benchmark Vasicek model. In particular, the copula models significantly reduce the amount of underestimation, a crucial advantage in the context of credit risk modeling.
In conclusion, results indicate that this approach significantly improves PD estimation, as compared to the benchmark Vasicek model, while interpretability and marginal flexibility stays intact. However, it does introduce a higher degree of complexity within the model compared to the linear benchmark model. Hence, we consider this method to be a promising area of future research for PD estimation.
Time and Industry Varying Correlation Structure
The industry-standard Vasicek model assumes a constant correlation across industries and time periods. In reality, correlations among default events can change over time and/or vary across industries due to economic cycles or industry specific shocks. This presents a research opportunity to enhance the practical applicability by incorporating sectoral dynamics and temporal variations within the correlation parameter of the model. Resulting in the following equation:
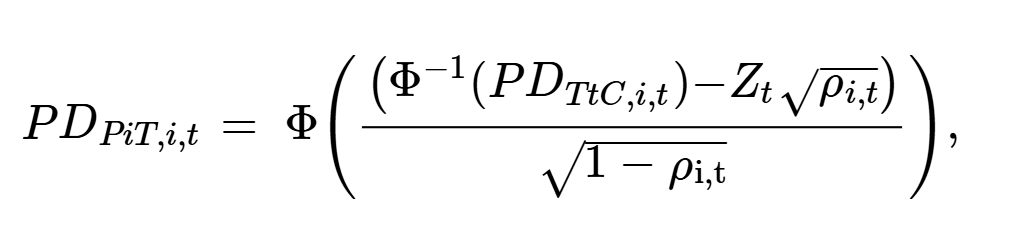
where the correlation parameter ρi,t is unique for firm i at time t. This segmentation is not limited to industries and time periods, but could also be extended across different regions or size classes, depending on the specific portfolio that is being considered. The correlation parameter ρi,t is modeled with a beta-distribution with time-varying mean and is defined on the interval between 0 and 1. The mean of the beta distribution is modelled as a logit link function driven by company-specific data (Ferrari & Francisco, 2004). This method thus allows for the temporal dependency to change over time, taking into account that the underlying relationship of the data does not remain identical across different time periods. Implementing varying correlations allows PD models to adapt and reflect real-world scenarios more precisely, ultimately leading to more robust credit risk predictions.
Results indicate that this approach significantly improves PD estimation accuracy, as compared to the benchmark Vasicek model. Moreover, this improvement is realized while the interpretability and logic of the benchmark model stays intact. Therefore, we consider this improvement to be a general improvement to existing Vasicek frameworks!
Conclusion
In this research, we have examined several different improvements with regards to PD modeling under IFRS 9 by using a Vasicek model, which is the industry standard. The first approach focused on extending the Vasicek framework by including non-linearity through advanced statistical and machine learning models. It was found that the regime-switching model and the long short-term memory neural network significantly improved Z-factor prediction accuracy. However, the increased complexity and the decreased interpretability of these models raises the question whether the gains of these approaches outweigh the additional efforts in practical applications.
Secondly, a conditional copula approach was introduced to capture the dependencies between macroeconomic variables and the Z-factor. The Copula models demonstrated exceptionally good relative performance in certain industries. Overall, the t-Copula proved to be the best Copula model in terms of overall predictive accuracy, significantly outperforming the standard Vasicek model. However, introducing a Copula model does lead to a higher degree of complexity within the model framework.
Lastly, we have incorporated a time and industry varying correlation parameter into the standard Vasicek model, thereby relaxing the static assumption implied by the original model. The use of this approach shows promising results, with PD estimation accuracy increasing significantly. This methodology is a simple yet important extension of the Vasicek framework that improves estimation accuracy while maintaining a level of simplicity and interpretability.
To conclude, we find that various methodologies can be introduced to challenge the existing Vasicek framework. Findings indicate that a number of models improve estimation accuracy, However, in some cases the marginal increase in accuracy does not weigh up against the additional efforts that are necessary to use these models in practice. The methodology that we would focus on in actual use-cases is the inclusion of time- and industry-varying correlations, which has shown positive results that are both theoretically consistent and remain interpretable and compliant with IFRS 9 regulations.
By extending the Vasicek model, Zanders continues to contribute valuable insights, supporting the financial industry's shift to a more comprehensive modeling toolkit. These advancements highlight our commitment to developing solutions that meet modern accounting and regulatory standards while providing financial risk managers with enhanced tools for risk estimation.
Are you interested in how you could leverage these methodologies to enhance your PD modeling approach? Contact Kasper Wijshoff, Kyle Gartner or Mila van den Bergh for more information.
Bibliography
Basson, L. J., & Van Vuuren, G. (2023). Through-the-cycle to Point-in-time Probabilities of Default Conversion: Inconsistencies in the Vasicek Approach. International Journal of Economics, 13(6), 42-52.
Ferrari, S., & Francisco, C.-N. (2004). Beta regression for modeling rates and proportions. Journal of applied statistics, 31(7), 799-815.
Vasicek, O. (1977). An equilibrium characterization of the term structure. Journal of financial economics, 177-188.
Vasicek, O. (2002). The distribution of loan portfolio value. Risk, 160-162.
-
CEO Statement: Delivering Financial Performance When It Counts

-
The Digital Agenda Has Increased the Cybercrime and Fraud Threat Landscape – It’s Now Critical for Corporate Treasury to Build Resilience

-
The New Rails: How Stablecoins Are Redefining Cross-Border Payments for Corporate Treasury

-
Risk Mitigation Accounting (RMA) Exposure Draft amending IFRS9: Key Impacts and Practical Challenges

-
Optimizing the Valuation Processes in Modern Banking: A Strategic Approach to Efficiency, Consistency, and Cost Reduction

-
Intra-Group Loans Transfer Pricing: What’s Important in 2026?

-
A Roadmap for Banks to Geopolitical Risk Taxonomy

-
Geopolitical Risk and the ECB 2026 Reverse Stress Test: Mapping Failure Pathways Before It’s Too Late

-
Swiss Climate Scenarios 2025

-
ECB’s 2026 Geopolitical Reverse Stress Test: Why Channels Matter More Than Numbers