Structural Foreign Exchange Risk in practice

September 2020
4 min read

Managing Capital Adequacy ratios through an open Foreign Exchange position


Since the introduction of the Pillar 1 capital charge for market risk, banks must hold capital for Foreign Exchange (FX) risk, irrespective of whether the open FX position was held on the trading or the banking book. An exception was made for Structural Foreign Exchange Positions, where supervisory authorities were free to allow banks to maintain an open FX position to protect their capital adequacy ratio in this way.

This exemption has been applied in a diverse way by supervisors and therefore, the treatment of Structural FX risk has been updated in recent regulatory publications. In this article we discuss these publications and market practice around Structural FX risk based on an analysis of the policies applied by the top 25 banks in Europe.

Based on the 1996 amendment to the Capital Accord, banks that apply for the exemption of Structural FX positions can exclude these positions from the Pillar 1 capital requirement for market risk. This exemption was introduced to allow international banks with subsidiaries in currencies different from the reporting currency to employ a strategy to hedge the capital ratio from adverse movements in the FX rate. In principle a bank can apply one of two strategies in managing its FX risk.

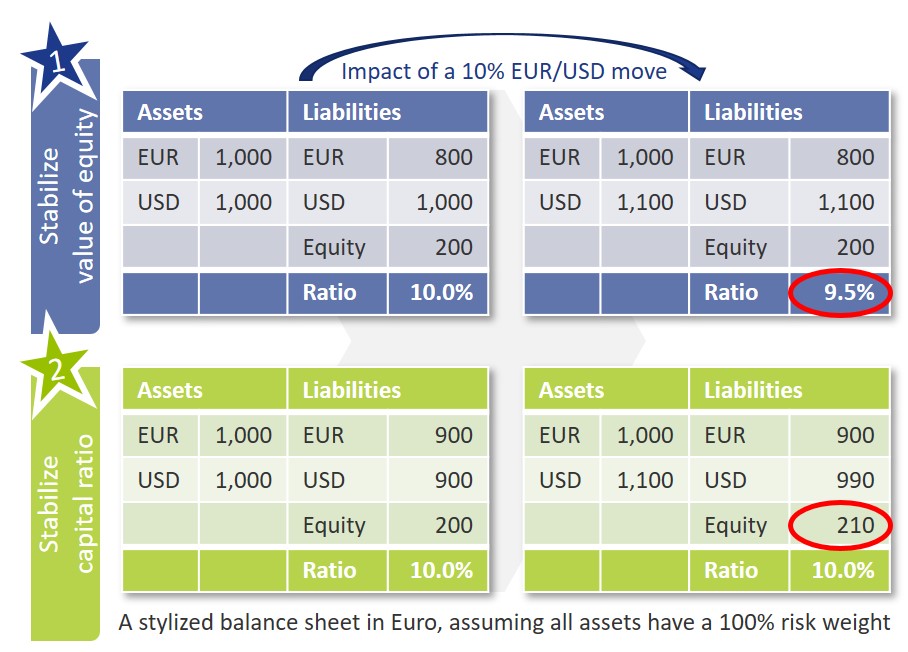
  1. In the first strategy, the bank aims to stabilize the value of its equity from movements in the FX rate. This strategy requires banks to maintain a matched currency position, which will effectively protect the bank from losses related to FX rate changes. Changes in the FX rate will not impact the equity of a bank with e.g. a consolidated balance sheet in Euro and a matched USD position. The value of the Risk-Weighted Assets (RWAs) is however impacted. As a result, although the overall balance sheet of the bank is protected from FX losses, changes in the EUR/USD exchange rate can have an adverse impact on the capital ratio.
  2. In the alternative strategy, the objective of the bank is to protect the capital adequacy ratio from changes in the FX rate. To do so, the bank deliberately maintains a long, open currency position, such that it matches the capital ratio. In this way, both the equity and the RWAs of the bank are impacted in a similar way by changes in the EUR/USD rate, thereby mitigating the impact on the capital ratio. Because an open position is maintained, FX rate changes can result in losses for the bank. Without the exemption of Structural FX positions, the bank would be required to hold a significant amount of capital for these potential losses, effectively turning this strategy irrelevant.

As can also be seen in the exhibit below, the FX scenario that has an adverse impact on the bank differs between both strategies. In strategy 1, an appreciation of the currency will result in a decrease of the capital ratio, while in the second strategy the value of the equity will increase if the currency appreciates. The scenario with an adverse impact on the bank in strategy 2 is when the foreign currency depreciates.

Until now, only limited guidance has been available on e.g. the risk management framework, (number of) currencies that can be in scope of the exemption and the maximum open exposure that can be exempted. As a result, the practical implementation of the Structural FX exemption varies significantly across banks. Recent regulatory publications aim to enhance regulatory guidance to ensure a more standardized application of the exemption.

Regulatory Changes

With the publication of the Fundamental Review of the Trading Book (FRTB) in January 2019, the exemption of Structural FX risk was further clarified. The conditions from the 1996 amendment were complemented to a total of seven conditions related to the policy framework required for FX risk and the maximum and type of exposure that can be in scope of the exemption. Within Europe, this exemption is covered in the Capital Requirements Regulation under article 352(2).

To process the changes introduced in the FRTB and to further strengthen the regulatory guidelines related to Structural FX, the EBA has issued a consultation paper in October 2019. A final version of these guidelines was published in July 2020. The date of application was pushed back one year compared to the consultation paper and is now set for January 2022.

The guidelines introduced by EBA can be split in three main topics:

  1. Definition of Structural FX.
    The guidelines provide a definition of positions of a structural nature and positions that are eligible to be exempted from capital. Positions of a structural nature are investments in a subsidiary with a reporting currency different from that of the parent (also referred to as Type A), or positions that are related to the cross-border nature of the institution that are stable over time (Type B). A more elaborate justification is required for Type B positions and the final guidelines include some high-level conditions for this.
  2. Management of Structural FX.
    Banks are required to document the appetite, risk management procedures and processes in relation to Structural FX in a policy. Furthermore, the risk appetite should include specific statements on the maximum acceptable loss resulting from the open FX position, on the target sensitivity of the capital ratios and the management action that will be applied when thresholds are crossed. It is moreover clarified that the exemption can in principle only be applied to the five largest structural currency exposures of the bank.
  3. Measurement of Structural FX.
    The guidelines include requirements on the type and the size of the positions that can be in scope of the exemption. This includes specific formulas on the calculation of the maximum open position that can be in scope of the exemption and the sensitivity of the capital ratio. In addition, banks will need to report the structural open position, maximum open position, and the sensitivity of the capital ratio, to the regulator on a quarterly basis.

One of the reasons presented by the EBA to publish these additional guidelines is a growing interest in the application of the Structural FX exemption in the market.

Market Practice

To understand the current policy applied by banks, a review of the 2019 annual reports of the top 25 European banks was conducted. Our review shows that almost all banks identify Structural FX as part of their risk identification process and over three quarters of the banks apply a strategy to hedge the CET1 ratio, for which an exemption has been approved by the ECB. While most of the banks apply the exemption for Structural FX, there is a vast difference in practices applied in measurement and disclosure. Only 44% of the banks publish quantitative information on Structural FX risk, ranging from the open currency exposure, 10-day VaR losses, stress losses or Economic Capital allocated.

The guideline that will have a significant impact on Structural FX management within the bigger banks of Europe is the limit to include only the top five open currency positions in the exemption: of the banks that disclose the currencies in scope of the Structural FX position, 60% has more than 5 and up to 20 currencies in scope. Reducing that to a maximum of five will either increase the capital requirements of those banks significantly or require banks to move back to maintaining a matched position for those currencies, which would increase the capital ratio volatility.

Conclusion

The EBA guidelines on Structural FX that will to go live by January 2022 are expected to have quite an impact on the way banks manage their Structural FX exposures. Although the Structural FX policy is well developed in most banks, the measurement and steering of these positions will require significant updates. It will also limit the number of currencies that banks can identify as Structural FX position. This will make it less favourable for international banks to maintain subsidiaries in different currencies, which will increase the cost of capital and/or the capital ratio volatility.

Finally, a topic that is still ambiguous in the guidelines is the treatment of Structural FX in a Pillar 2 or ICAAP context. Currently, 20% of the banks state to include an internal capital charge for open structural FX positions and a similar amount states to not include an internal capital charge. Including such a capital charge, however, is not obvious. Although an open FX position will present FX losses for a bank which would favour an internal capital charge, the appetite related to internal capital and to the sensitivity of the capital ratio can counteract, resulting in the need for undesirable FX hedges.

The new guidelines therefore present clarifications in many areas but will also require banks to rework a large part of their Structural FX policies in the middle of a (COVID-19) crisis period that already presents many challenges.

Calculation of compounded SARON

July 2020
4 min read

Managing Capital Adequacy ratios through an open Foreign Exchange position


In our previous article, the reasons for a new reference rate (SARON) as an alternative to CHF LIBOR were explained and the differences between the two were assessed. One of the challenges in the transition to SARON, relates to the compounding technique that can be used in banking products and other financial instruments. In this article the challenges of compounding techniques will be assessed.

Alternatives for a calculating compounded SARON

After explaining in the previous article the use of compounded SARON as a term alternative to CHF LIBOR, the Swiss National Working Group (NWG) published several options as to how a compounded SARON could be used as a benchmark in banking products, such as loans or mortgages, and financial instruments (e.g. capital market instruments). Underlying these options is the question of how to best mitigate uncertainty about future cash flows, a factor that is inherent in the compounding approach. In general, it is possible to separate the type of certainty regarding future interest payments in three categories . The market participant has:

  • an aversion to variable future interest payments (i.e. payments ex-ante unknown). Buying fixed-rate products is best, where future cash flows are known for all periods from inception. No benchmark is required due to cash flow certainty over the lifetime of the product.
  • a preference for floating-rate products, where the next cash flow must be known at the beginning of each period. The option ‘in advance’ is applicable, where cash flow certainty exists for a single period.
  • a preference for floating-rate products with interest rate payments only close to the end of the period are tolerated. The option ‘in arrears’ is suitable, where cash flow certainty only close to the end of each period exists.

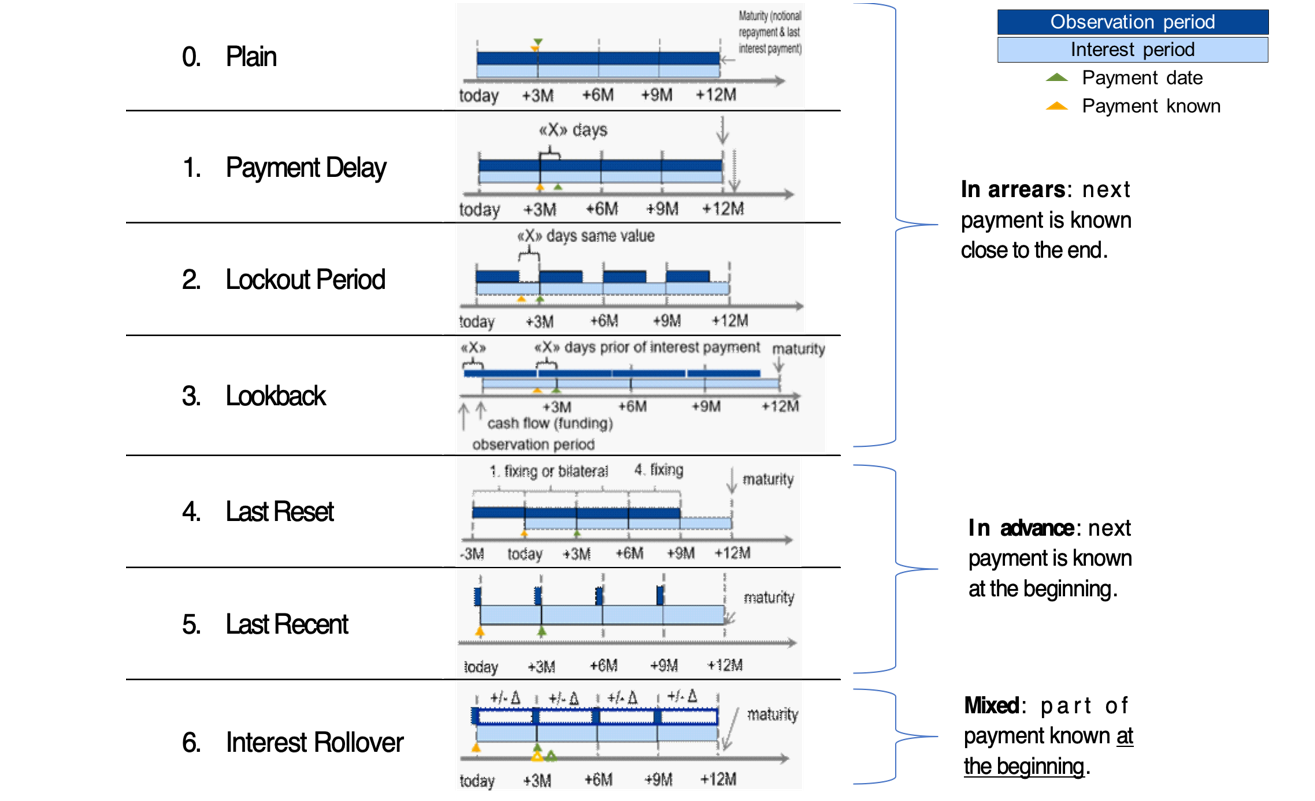
Based on the Financial Stability Board (FSB) user’s guide, the Swiss NWG recommends considering six different options to calculate a compounded risk-free rate (RFR). Each financial institution should assess these options and is recommended to define an action plan with respect to its product strategy. The compounding options can be segregated into options where the future interest rate payments can be categorized as in arrears, in advance or hybrid. The difference in interest rate payments between ‘in arrears’ and ‘in advance’ conventions will mainly depend on the steepness of the yield curve. The naming of the compounding options can be slightly different among countries, but the technique behind those is generally the same. For more information regarding the available options, see Figure 1.

Moreover, for each compounding technique, an example calculation of the 1-month compounded SARON is provided. In this example, the start date is set to 1 February 2019 (shown as today in Figure 1) and the payment date is 1 March 2019. Appendix I provides details on the example calculations.

Figure 1: Overview of alternative techniques for calculating compounded SARON. Source: Financial Stability Board (2019).

0) Plain (in arrears): The observation period is identical to the interest period. The notional is paid at the start of the period and repaid on the last day of the contract period together with the last interest payment. Moreover, a Plain (in arrears) structure reflects the movement in interest rates over the full interest period and the payment is made on the day that it would naturally be due. On the other hand, given publication timing for most RFRs (T+1), the requiring payment is on the same day (T+1) that the final payment amount is known (T+1). An exception is SARON, as SARON is published one business day (T+0) before the overnight loan is repaid (T+1).

Example: the 1-month compounded SARON based on the Plain technique is like the example explained in the previous article, but has a different start date (1 February 2019). The resulting 1-month compounded SARON is equal to -0.7340% and it is known one day before the payment date (i.e. known on 28 February 2019).

1) Payment Delay (in arrears): Interest rate payments are delayed by X days after the end of an interest period. The idea is to provide more time for operational cash flow management. If X is set to 2 days, the cash flow of the loan matches the cash flow of most OIS swaps. This allows perfect hedging of the loan. On the other hand, the payment in the last period is due after the payback of the notional, which leads to a mismatch of cash flows and a potential increase in credit risk.

Example: the 1-month compounded SARON is equal to -0.7340% and like the one calculated using the Plain (in arrears) technique. The only difference is that the payment date shifts by X days, from 1 March 2019 to e.g. 4 March 2019. In this case X is equal to 3 days.

2) Lockout Period (in arrears): The RFR is no longer updated, i.e. frozen, for X days prior to the end of an interest rate period (lockout period). During this period, the RFR on the day prior to the start of the lockout is applied for the remaining days of the interest period. This technique is used for SOFR-based Floating Rate Notes (FRNs), where a lockout period of 2-5 days is mostly used in SOFR FRNs. Nevertheless, the calculation of the interest rate might be considered less transparent for clients and more complex for product providers to be implemented. It also results in interest rate risk that is difficult to hedge due to potential changes in the RFR during the lockout period. The longer the lockout period, the more difficult interest rate risk can be hedged during the lockout period.

Example: the 1-month compounded SARON with a lockout period equal to 3 days (i.e. X equals 3 days) is equal to -0.7337% and known 3 days in advance of the payment date.

3) Lookback (in arrears): The observation period for the interest rate calculation starts and ends X days prior to the interest period. Therefore, the interest payments can be calculated prior to the end of the interest period. This technique is predominately used for SONIA-based FRNs with a delay period of X equal to 5 days. An increase in interest rate risk due to changes in yield curve is observed over the lifetime of the product. This is expected to make it more difficult to hedge interest rate risk.

Example: assuming X is equal to 3 days, the 1-month compounded SARON would start in advance, on January 29, 2019 (i.e. today minus 3 days). This technique results in a compounded 1-month SARON equal to -0.7335%, known on 25 February 2019 and payable on 1 March 2019.

4) Last Reset (in advance): Interest payments are based on compounded RFR of the previous period. It is possible to ensure that the present value is equivalent to the Plain (in arrears) case, thanks to a constant mark-up added to the compounded RFR. The mark-up compensates the effects of the period shift over the full life of the product and can be priced by the OIS curve. In case of a decreasing yield curve, the mark-up would be negative. With this technique, the product is more complex, but the interest payments are known at the start of the interest period, as a LIBOR-based product. For this reason, the mark-up can be perceived as the price that a borrower is willing to pay due to the preference to know the next payment in advance.

Example: the interest rate payment on 1 March 2019 is already known at the start date and equal to -0.7328% (without mark-up).

5) Last Recent (in advance): A single RFR or a compounded RFR for a short number of days (e.g. 5 days) is applied for the entire interest period. Given the short observation period, the interest payment is already known in advance at the start of each interest period and due on the last day of that period. As a consequence, the volatility of a single RFR is higher than a compounded RFR. Therefore, interest rate risk cannot be properly hedged with currently existing derivatives instruments.

Example: a 5-day average is used to calculate the compounded SARON in advance. On the start date, the compounded SARON is equal to -0.7339% (known in advance) that will be paid on 1 March 2020.

6) Interest Rollover (hybrid): This technique combines a first payment (installment payment) known at the beginning of the interest rate period with an adjustment payment known at the end of the period. Like Last Recent (in advance), a single RFR or a compounded RFR for a short number of days is fixed for the whole interest period (installment payment known at the beginning). At the end of the period, an adjustment payment is calculated from the differential between the installment payment and the compounded RFR realized during the interest period. This adjustment payment is paid (by either party) at the end of the interest period (or a few days later) or rolled over into the payment for the next interest period. In short, part of the interest payment is known already at the start of the period. Early termination of contracts becomes more complex and a compensation mechanism is needed.

Example: similar to Last Recent (in advance), a 5-day compounded SARON can be considered as installment payment before the starting date. On the starting date, the 5-day compounded SARON rate is equal to -0.7339% and is known to be paid on 1 March 2019 (payment date). On the payment date, an adjustment payment is calculated as the delta between the realized 1-month compounded SARON, equal to -0.7340% based on Plain (in arrears), and -0.7339%.

There is a trade-off between knowing the cash flows in advance and the desire for a payment structure that is fully hedgeable against realized interest rate risk. Instruments in the derivatives market currently use ‘in arrears’ payment structures. As a result, the more the option used for a cash product deviates from ‘in arrears’, the less efficient the hedge for such a cash product will be. In order to use one or more of these options for cash products, operational cash management (infrastructure) systems need to be updated. For more details about the calculation of the compounded SARON using the alternative techniques, please refer to Table 1 and Table 2 in the Appendix I. The compounding formula used in the calculation is explained in the previous article.

Overall, market participants are recommended to consider and assess all the options above. Moreover, the financial institutions should individually define action plans with respect to their own product strategies.

Conclusions

The transition from IBOR to alternative reference rates affects all financial institutions from a wide operational perspective, including how products are created. Existing LIBOR-based cash products need to be replaced with SARON-based products as the mortgages contract. In the next installment, IBOR Reform in Switzerland – Part III, the latest information from the Swiss National Working Group (NWG) and market developments on the compounded SARON will be explained in more detail.

Appendix I – II

Contact

For more information about the challenges and latest developments on SARON, please contact Martijn Wycisk or Davide Mastromarco of Zanders’ Swiss office: +41 44 577 70 10.

The other articles on this subject: 

Transition from CHF LIBOR to SARON, IBOR Reform in Switzerland, Part I
Compounded SARON and Swiss Market Development, IBOR Reform in Switzerland, Part III
Fallback provisions as safety net, IBOR Reform in Switzerland, Part IV

References

  1. Mastromarco, D. Transition from CHF LIBOR to SARON, IBOR Reform in Switzerland – Part I. February 2020.
  2. National Working Group on Swiss Franc Reference Rates. Discussion paper on SARON Floating Rate Notes. July 2019.
  3. National Working Group on Swiss Franc Reference Rates. Executive summary of the 12 November 2019 meeting of the National Working Group on Swiss Franc Reference Rates. Press release November 2019.
  4. National Working Group on Swiss Franc Reference Rates. Starter pack: LIBOR transition in Switzerland. December 2019.
  5. Financial Stability Board (FSB). Overnight Risk-Free Rates: A User’s Guide. June 2019.
  6. ISDA. Supplement number 60 to the 2006 ISDA Definitions. October 2019.
  7. ISDA. Interbank Offered Rate (IBOR) Fallbacks for 2006 ISDA Definitions. December 2019.
  8. National Working Group on Swiss Franc Reference Rates. Executive summary of the 7 May 2020 meeting of the National Working Group on Swiss Franc Reference Rates. Press release May 2020

Strengthening Model Risk Management at ABN AMRO – Insights from Martijn Habing

Martijn Habing, head of Model Risk Management (MoRM) at ABN AMRO bank, spoke at the Zanders Risk Management Seminar about the extent to which a model can predict the impact of an event.


The MoRM division of ABN AMRO comprises around 45 people. What are the crucial conditions to run the department efficiently?

Habing: “Since the beginning of 2019, we have been divided into teams with clear responsibilities, enabling us to work more efficiently as a model risk management component. Previously, all questions from the ECB or other regulators were taken care of by the experts of credit risk, but now we have a separate team ready to focus on all non-quantitative matters. This reduces the workload on the experts who really need to deal with the mathematical models. The second thing we have done is to make a stronger distinction between the existing models and the new projects that we need to run. Major projects include the Definition of default and the introduction of IFRS 9. In the past, these kinds of projects were carried out by people who actually had to do the credit models. By having separate teams for this, we can scale more easily to the new projects – that works well.”What exactly is the definition of a model within your department? Are they only risk models, or are hedge accounting or pricing models in scope too?

“We aim to identify the widest range of models as possible, both in size and type. From an administrative point of view, we can easily do 600 to 700 models. But with such a number, we can't validate them all in the same degree of depth. We therefore try to get everything in picture, but this varies per model what we look at.”

To what extent does the business determine whether a validation model is presented?

“We want to have all models in view. Then the question is: how do you get a complete overview? How do you know what models there are if you don't see them all? We try to set this up in two ways. On the one hand, we do this by connecting to the change risk assessment process. We have an operational risk department that looks at the entire bank in cycles of approximately three years. We work with operational risk and explain to them what they need to look out for, what ‘a model’ is according to us and what risks it can contain. On the other hand, we take a top-down approach, setting the model owner at the highest possible level. For example, the director of mortgages must confirm for all processes in his business that the models have been well developed, and the documentation is in order and validated. So, we're trying to get a view on that from the top of the organization. We do have the vast majority of all models in the picture.”

Does this ever lead to discussion?

“Yes, that definitely happens. In the bank's policy, we’ve explained that we make the final judgment on whether something is a model. If we believe that a risk is being taken with a model, we indicate that something needs to be changed.”

Some of the models will likely be implemented through vendor systems. How do you deal with that in terms of validation?

“The regulations are clear about this: as a bank, you need to fully understand all your models. We have developed a vast majority of the models internally. In addition, we have market systems for which large platforms have been created by external parties. So, we are certainly also looking at these vendor systems, but they require a different approach. With these models you look at how you parametrize – which test should be done with it exactly? The control capabilities of these systems are very different. We're therefore looking at them, but they have other points of interest. For example, we perform shadow calculations to validate the results.”

How do you include the more qualitative elements in the validation of a risk model?

“There are models that include a large component from an expert who makes a certain assessment of his expertise based on one or more assumptions. That input comes from the business itself; we don't have it in the models and we can't control it mathematically. At MoRM, we try to capture which assumptions have been made by which experts. Since there is more risk in this, we are making more demands on the process by which the assumptions are made. In addition, the model outcome is generally input for the bank's decision. So, when the model concludes something, the risk associated with the assumptions will always be considered and assessed in a meeting to decide what we actually do as a bank. But there is still a risk in that.”

How do you ensure that the output from models is applied correctly?

“We try to overcome this by the obligation to include the use of the model in the documentation. For example, we have a model for IFRS 9 where we have to indicate that we also use it for stress testing. We know the internal route of the model in the decision-making of the bank. And that's a dynamic process; there are models that are developed and used for other purposes three years later. Validation is therefore much more than a mathematical exercise to see how the numbers fall apart.”

Typically, the approach is to develop first, then validate. Not every model will get a ‘validation stamp’. This can mean that a model is rejected after a large amount of work has been done. How can you prevent this?

“That is indeed a concrete problem. There are cases where a lot of work has been put into the development of a new model that was rejected at the last minute. That's a shame as a company. On the one hand, as a validation department, you have to remain independent. On the other hand, you have to be able to work efficiently in a chain. These points can be contradictory, so we try to live up to both by looking at the assumptions of modeling at an early stage. In our Model Life Cycle we have described that when developing models, the modeler or owner has to report to the committee that determines whether something can or can’t. They study both the technical and the business side. Validation can therefore play a purer role in determining whether or not something is technically good.”

To be able to better determine the impact of risks, models are becoming increasingly complex. Machine learning seems to be a solution to manage this, to what extent can it?

“As a human being, we can’t judge datasets of a certain size – you then need statistical models and summaries. We talk a lot about machine learning and its regulatory requirements, particularly with our operational risk department. We then also look at situations in which the algorithm decides. The requirements are clearly formulated, but implementation is more difficult – after all, a decision must always be explainable. So, in the end it is people who make the decisions and therefore control the buttons.”

To what extent does the use of machine learning models lead to validation issues?

“Seventy to eighty percent of what we model and validate within the bank is bound by regulation – you can't apply machine learning to that. The kind of machine learning that is emerging now is much more on the business side – how do you find better customers, how do you get cross-selling? You need a framework for that; if you have a new machine learning model, what risks do you see in it and what can you do about it? How do you make sure your model follows the rules? For example, there is a rule that you can't refuse mortgages based on someone's zip code, and in the traditional models that’s well in sight. However, with machine learning, you don't really see what's going on ‘under the hood’. That's a new risk type that we need to include in our frameworks. Another application is that we use our own machine learning models as challenger models for those we get delivered from modeling. This way we can see whether it results in the same or other drivers, or we get more information from the data than the modelers can extract.”

How important is documentation in this?

“Very important. From a validation point of view, it’s always action point number one for all models. It’s part of the checklist, even before a model can be validated by us at all. We have to check on it and be strict about it. But particularly with the bigger models and lending, the usefulness and need for documentation is permeated.”

Finally, what makes it so much fun to work in the field of model risk management?

“The role of data and models in the financial industry is increasing. It's not always rewarding; we need to point out where things go wrong – in that sense we are the dentist of the company. There is a risk that we’re driven too much by statistics and data. That's why we challenge our people to talk to the business and to think strategically. At the same time, many risks are still managed insufficiently – it requires more structure than we have now. For model risk management, I have a clear idea of what we need to do to make it stronger in the future. And that's a great challenge.”

Customer successes

View all Insights

Standardizing Financial Risk Management – ING’s Accelerating Think Forward Strategy and IRRBB Framework Transformation

In 2014, with its Think Forward strategy, ING set the goal to further standardize and streamline its organization. At the time, changes in international regulations were also in full swing. But what did all this mean for risk management at the bank? We asked ING’s Constant Thoolen and Gilbert van Iersel.


According to Constant Thoolen, global head of financial risk at ING, the Accelerating Think Forward strategy, an updated version of the Think Forward strategy that they just call ATF, comprises several different elements.

"Standardization is a very important one. And from standardization comes scalability and comparability. To facilitate this standardization within the financial risk management team, and thus achieve the required level of efficiency, as a bank we first had to make substantial investments so we could reap greater cost savings further down the road."

And how exactly did ING translate this into financial risk management?

Thoolen: "Obviously, there are different facets to that risk, which permeates through all business lines. The interest rate risk in the banking book, or IRRBB, is a very important part of this. Alongside the interest rate risk in trading activities, the IRRBB represents an important risk for all business lines. Given the importance of this type of risk, and the changing regulatory complexion, we decided to start up an internal IRRBB program."

So the challenge facing the bank was how to develop a consistent framework in benchmarking and reporting the interest rate risk?

"The ATF strategy has set requirements for the consistency and standardization of tooling," explains Gilbert van Iersel, head of financial risk analysis. "On the one hand, our in-house QRM program ties in with this. We are currently rolling out a central system for our ALM activities, such as analyses and risk measurements—not only from a risk perspective but from a finance one too. Within the context of the IRRBB program, we also started to apply this level of standardization and consistency throughout the risk-management framework and the policy around it. We’re doing so by tackling standardization in terms of definitions, such as: what do we understand by interest rate risk, and what do benchmarks like earnings-at-risk or NII-at-risk actually mean? It’s all about how we measure and what assumptions we should make."

What role did international regulations play in all this?

Van Iersel: "An important one. The whole thing was strengthened by new IRRBB guidelines published by the EBA in 2015. It reconciled the ATF strategy with external guidelines, which prompted us to start up the IRRBB program."

So regulations served as a catalyst?

Thoolen: "Yes indeed. But in addition to serving as a foothold, the regulations, along with many changes and additional requirements in this area, also posed a challenge. Above all, it remains in a state of flux, thanks to Basel, the EBA, and supervision by the ECB. On the one hand, it’s true that we had expected the changes, because IRRBB discussions had been going on for some time. On the other hand, developments in the regulatory landscape surrounding IRRBB followed one another quite quickly. This is also different from the implementation of Basel II or III, which typically require a preparation and phasing-in period of a few years. That doesn’t apply here because we have to quickly comply with the new guidelines."

Did the European regulations help deliver the standardization that ING sought as an international bank?

Thoolen: "The shift from local to European supervision probably increased our need for standardization and consistency. We had national supervisors in the relevant countries, each supervising in their own way, with their own requirements and methodologies. The ECB checked out all these methodologies and created best practices on what they found. Now we have to deal with regulations that take in all Eurozone countries, which are also countries in which ING is active. Consequently, we are perfectly capable of making comparisons between the implementation of the ALM policy in the different countries. Above all, the associated risks are high on the agenda of policymakers and supervisors."

Van Iersel: "We have also used these standards in setting up a central treasury organization, for example, which is also complementary to the consistency and standardization process."

Thoolen: "But we’d already set the further integration of the various business units in motion, before the new regulations came into force. What’s more, we still have to deal with local legislation in the countries in which we operate outside Europe, such as Australia, Singapore, and the US. Our ideal world would be one in which we have one standard for our calculations everywhere."

What changed in the bank’s risk appetite as a result of this changing environment and the new strategy?

Van Iersel: "Based on newly defined benchmarks, we’ve redefined and shaped our risk appetite as a component part of the strategic program. In the risk appetite process we’ve clarified the difference between how ING wants to manage the IRRBB internally and how the regulator views the type of risk. As a bank, you have to comply with the so-called standard outlier test when it comes to the IRRBB. The benchmark commonly employed for this is the economic value of equity, which is value-based. Within the IRRBB, you can look at the interest rate risk from a value or an income perspective. Both are important, but they occasionally work against one another too. As a bank, we’ve made a choice between them. For us, a constant stream of income was the most important benchmark in defining our interest rate risk strategy, because that’s what is translated to the bottom line of the results that we post. Alongside our internal decision to focus more closely on income and stabilize it, the regulator opted to take a mainly value-based approach. We have explicitly incorporated this distinction in our risk appetite statements. It’s all based on our new strategy; in other words, what we are striving for as a bank and what will be the repercussions for our interest rate risk management. It’s from there that we define the different risk benchmarks."

Which other types of risk does the bank look at and how do they relate to the interest rate risk?

Van Iersel: “From the financial risk perspective, you also have to take into account aspects like credit spreads, changes in the creditworthiness of counterparties, as well as market-related risks in share prices and foreign exchange rates. Given that all these collectively influence our profitability and solvency position, they are also reflected in the Core Tier I ratio. There is a clear link to be seen there between the risk appetite for IRRBB and the overall risk appetite that we as a bank have defined. IRRBB is a component part of the whole, so there’s a certain amount of interaction between them to be considered; in other words, how does the interest rate risk measure up to the credit risk? On top of that, you have to decide where to deploy your valuable capacity. All this has been made clearer in this program.”

Does this mean that every change in the market can be accommodated by adjusting the risk appetite?

Thoolen: “Changing behavior can indeed influence risks and change the risk appetite, although not necessarily. But it can certainly lead to a different use of risk. Moreover, IFRS 9 has changed the accounting standards. Because the Core Tier 1 ratio is based on the accounting standard, these IFRS 9 changes determine the available capital too. If IFRS 9 changes the playing field, it also exerts an influence on certain risk benchmarks.”

In addition to setting up a consistent framework, the standardization of the models used by the different parts of ING was also important. How does ING approach the selection and development of these models?

Thoolen: “With this in mind, we’ve set up a structure with the various business units that we collaborate with from a financial risk perspective. We pay close attention to whether a model is applicable in the environment in which it’s used. In other words, is it a good fit with what’s happening in the market, does it cover all the risks as you see them, and does it have the necessary harmony with the ALM system? In this way, we want to establish optimum modeling for savings or the repayment risk of mortgages, for example.”

But does that also work for an international bank with substantial portfolios in very different countries?

Thoolen: “While there is model standardization, there is no market standardization. Different countries have their own product combinations and, outside the context of IRRBB, have to comply with regulations that differ from other countries. A savings product in the Netherlands will differ from a savings product in Belgium, for example. It’s difficult to define a one-size-fits-all model because the working of one market can be much more specific than another—particularly when it comes to regulations governing retail and wholesale. This sometimes makes standardization more difficult to apply. The challenge lies in the fact that every country and every market is specific, and the differences have to be reconciled in the model.”

Van Iersel: “The model was designed to measure risks as well as possible and to support the business to make good decisions. Having a consistent risk appetite framework can also make certain differences between countries or activities more visible. In Australia, for example, many more floating-rate mortgages are sold than here in the Netherlands, and this alters the sensitivity of the bank’s net interest income when the interest rate changes. Risk appetite statements must facilitate such differences.”

To what extent does the use of machine learning models lead to validation issues?

“Seventy to eighty percent of what we model and validate within the bank is bound by regulation – you can't apply machine learning to that. The kind of machine learning that is emerging now is much more on the business side – how do you find better customers, how do you get cross-selling? You need a framework for that; if you have a new machine learning model, what risks do you see in it and what can you do about it? How do you make sure your model follows the rules? For example, there is a rule that you can't refuse mortgages based on someone's zip code, and in the traditional models that’s well in sight. However, with machine learning, you don't really see what's going on ‘under the hood’. That's a new risk type that we need to include in our frameworks. Another application is that we use our own machine learning models as challenger models for those we get delivered from modeling. This way we can see whether it results in the same or other drivers, or we get more information from the data than the modelers can extract.”

Thoolen: “But opting for a single ALM system imposes this model standardization on you and ensures that, once it’s integrated, it will immediately comply with many conditions. The process is still ongoing, but it’s a good fit with the standardization and consistency that we’re aiming for.”


In conjunction with the changing regulatory environment, the Accelerating Think Forward Strategy formed the backdrop for a major collaboration with Zanders: the IRRBB project. In the context of this project, Zanders researched the extent to which the bank’s interest rate risk framework complied with the changing regulations. The framework also assessed ING’s new interest rate risk benchmarks and best practices. Based on the choices made by the bank, Zanders helped improve and implement the new framework and standardized models in a central risk management system.

Customer successes

View all Insights

A new interest-rate risk framework for BNG bank

March 2016

BNG Bank, established to offer low-rate loans to the Dutch government and public interest institutions, helps lower the cost of public amenities, but its balance sheet’s sensitivity to financial market fluctuations highlights the need for a robust interest rate risk framework.


BNG Bank was founded more than 100 years ago – firstly under the name Gemeentelijke Credietbank – as a purchasing association with the main task of bundling the financing requirements of Dutch local authorities so that purchasing benefits could be obtained on capital markets. In 1922, the name was changed to Bank voor Nederlandsche Gemeenten and even today the main aim is, in essence, the same. What has changed is the role of local authorities, says John Reichardt, a member of the Board of BNG Bank. He explains: “Over the past few years they have diversified. Many of their responsibilities are now independent or even privatized. Hospitals, electricity boards and housing companies, for example, were in the hands of local authorities but now operate independently. They are, however, still our clients because they provide public services.”

Different to Other Banks

To satisfy the financing requirements of its clients, BNG Bank collects money on the international capital markets to realize ‘bundled’ purchasing benefits. “And we pass these benefits on to our customers,” says Reichardt. “While our customers have become more diverse over time, our product portfolio has widened. Some thirty years ago we became a bank, with a comprehensive banking license, and this meant we could take up short-term loans, make investments, and handle our customers’ payments. We try to be a full-service bank, but then only for services our customers need.”

The state holds half of the shares and the remainder belongs to local authorities and provinces/counties. “Because of this we always have the dilemma: should we go for more profit and more dividend, or should our strong purchasing position be reflected immediately in our prices by means of a moderate pricing strategy? Our goal is to be big in our market – we think we should keep 35 to 50 percent of the total outstanding debt on our balance sheet. We are not striving for maximum profit, and that differentiates us from many other banks. Although we are a private company, we do also feel we are a part of the government,” says Reichardt.

Changed Worlds

BNG Bank has only one branch in The Hague, with 300 employees. The bank has grown considerably, mainly over the past few years. As of the start of the financial crisis, a number of services from other parties have disappeared, so BNG Bank was often called upon to step in. Now, partly as a result of this, it has become one of the systematically important Dutch banks. “From a character point of view, we are more of a middle-sized company, but as far as the balance sheet is concerned, we are a large bank. We earn our money by buying cheaply, but also by trying to pass this on as cheaply as possible to our customers – with a small commission. This brings with it a strong focus on risk management, including managing our own assets and the associated risks. These are partly credit risks, but we have fewer risks than other banks – because, thanks to the government, our customers are usually very creditworthy.”

BNG Bank also runs certain interest rate risks that have to be controlled on a day-to-day basis. “We have done this in a certain way for a long time, but in the meantime the world has changed,” says Hans Noordam, head of risk management at BNG Bank. “So we thought it was time to give the method a face-lift to test whether we are doing it right, with the right instruments and whether we are looking at the right things? We also wanted someone else to take a good look at it.”

So BNG Bank concluded that the interest rate risk framework had to be revised. “Our approach once was state of the art but, as always with the dialectics of progress, we didn’t do enough ourselves to keep up with changes in that respect,” Reichardt explains. “When we looked at the whole management of interest rate risk, on the one hand it was about the departments involved, and on the other hand the measurement system – the instruments we used and everything associated with them used to produce information which enabled decision-making on our position strategy. That is a big project.

Project Harry

Over the past few years various developments have taken place in the area of market risk. When BNG Bank changed its products and methods, various changes also took place in the areas of risk management and valuation, including extra requirements from the regulator. “So we started a preliminary investigation and formed one unit within risk management,” says Reichardt. At the end of 2012, BNG Bank appointed Petra Danisevska as head of risk management/ALM (RM/ALM). “We agreed not to reinvent the wheel ourselves, but mainly to look closely at best market practices,” she says.

Zanders helped us with this. In May 2013 we started an investigation to find out which interest rate risks were present in the bank and where improvement levels could be made.

Petra Danisevska, Head of risk management/ALM (RM/ALM) at BNG Bank

quote

Noordam explains that they agreed on suggested steps with the Asset Liability Committee (ALCO), which also provided input and expressed preferences. A plan was then made and the outlines sketched. To convert that into concrete actions, Noordam says that a project was initiated at the beginning of 2014: Project Harry. “This gets its name from BNG Bank’s location, also the home of a Dutch cartoon character, called Haagse Harry. He was the symbol of the whirlwind which was to whip through the bank,” says Noordam.

Within ALCO Limits

“During the (economic) crisis, all sorts of things happened which influenced the valuation of our balance sheet,” Reichardt explains. “They also had many effects on the measurement of our interest rate risk. We had to apply totally different curves – sometimes with very strange results. Our company is set up in a way that with our economic hedging and our hedge accounting, we can buy for X and pass it on to our customers for X plus a couple of basis points, which during the period of the loan reverts to us. We retain a small amount and on the basis of this pay out a dividend – our model is that simple. However, since the valuations were influenced by market changes, we were more or less obliged to take measures in order to stay within our ALCO limits. These measures, with respect to managing our interest position, would not have been realizable under our current philosophy; simply because they weren’t necessary. We knew we had to find a solution for that phenomenon in the project. After much discussion we were able to find a solution: to be more reliable within the technical framework of anticipating market movements which strongly influence valuation of financial instruments. In other words: the spread risk and the rate risk had to be separately measured and managed from one another. The world had changed and our interest rate risk management, as well as reporting and calculations based upon it, had to as well.”

After revision of the interest rate risk framework, as of the second half of 2015, all interest-rate risk measurements, their drivers and reporting were changed. The market risks as a result of the changes in interest rate curves, were then measured and reported on a daily basis by the RM/ALM department. “There is definitely better management of the interest rate risk; we generate more background data and create more possibilities to carry out analyses,” Danisevska explains. “We now have detailed figures that we couldn’t get before, with which we can show ALCO the risk and the accompanying, assumed return.”

More proactive

Noordam knew that Project Harry would involve a considerable effort. “The risk framework would inevitably suffer quite a lot. It had to be innovated on the basis of calculated conditions, while the implementation required a lot of internal resources and specific knowledge. Technical points had to be solved, while relationships had to be safeguarded; many elements with all sorts of expertise had to be integrated. The European Central Bank was stringent – that took up a lot of time and work. We had an asset quality review (AQR) and a stress test – that was completely new to us. Sometimes we were tempted to stay on known ground, but even during those periods we were able to carry on with the project. We rolled up our shirtsleeves and together we gained from the experience.”

Reichardt says: “It was a tough project for us, with complex subject matter and lots of different opinions. In total it took us seven quarters to complete. However, I think we have accomplished more than we expected at the beginning. With a combination of our own people and external expertise, we have managed to make up for lost ground. We have exchanged the rags for riches and we have been successful. Where do we stand now? As well as the required numbers, we have a clear view of what our thoughts are on ‘what is interest rate risk and what isn’t’. The only thing we still have to do is to fine-tune the roles: what can you expect from risk managers and risk takers, and how will they react to this? We will continue to monitor it. RM/ALM as a department is in any case a lot more proactive – that was an important goal for us. We can be more successful, but the department is really earning its spurs within the bank and that means profit for everyone.”

Customer successes

View all Insights

Replicating investment portfolios

February 2016
3 min read

Many banks use a framework of replicating investment portfolios to measure and manage the interest rate risk of variable savings deposits. There are two commonly used methodologies, known as the marginal investment strategy and the portfolio investment strategy. While these have the same objective, the effects for margin and interest maturity may vary. We review these strategies on the basis of a quantitative and a qualitative analysis.


A replicating investment portfolio is a collection of fixed-income investments based on an investment strategy that aims to reflect the typical interest rate maturity of the savings deposits (also referred to as ‘non-maturing deposits’). The investment strategy is formulated so that the margin between the portfolio return and the savings interest rate is as stable as possible, given various scenarios.

A replicating framework enables a bank to base its interest rate risk measurement and management on investments with a fixed maturity and price – while the deposits have no contractual maturity or price. In addition, a bank can use the framework to transfer the interest rate risk from the business lines to the central treasury, by turning the investments into contractual obligations. There are two commonly used methodologies for constructing the replicating portfolios: the marginal investment strategy and the portfolio investment strategy. These strategies have the same objective, but have different effects on margin and interest-rate term, given certain scenarios.

Strategies defined

An investment strategy determines the monthly allocation of the investable volume across various maturities. The investable volume in month t ( It ) consists of two parts:

The first part is equal to the decrease or increase in the volume of savings deposits compared to the previous month. The second part is equal to the total principal of all investments in the investment portfolio maturing in the current month (end date m = t ), Σi,m=t vi,m.

By investing or re-investing the volume of these two parts, the total principal of the investment portfolio will equal the savings volume outstanding at that moment. When an investment is generated, it receives the market interest rate relating to the maturity at that time. The portfolio investment return is determined as the principal weighted average interest rate.

The difference between a marginal investment strategy and a portfolio investment strategy is that in a marginal investment strategy, the volume is invested with a fixed allocation across fixed maturities. In a portfolio strategy, these parameters are flexible, however investments are generated in such a way that the resulting portfolio each month has the same (target) proportional maturity profile. The maturity profile provides the total monthly principal of the currently outstanding investments that will mature in the future.

In the savings modelling framework, the interest rate risk profile of the savings portfolio is estimated and defined as a (proportional) maturity profile. For the portfolio investment strategy, the target maturity profile is set equal to this estimated profile. For the marginal investment strategy, the ‘investment rule’ is derived from the estimated profile using a formula. Under long lasting constant or stable volume of savings deposits, the investment portfolio given the investment rule converges to the estimated profile.

Strategies illustrated

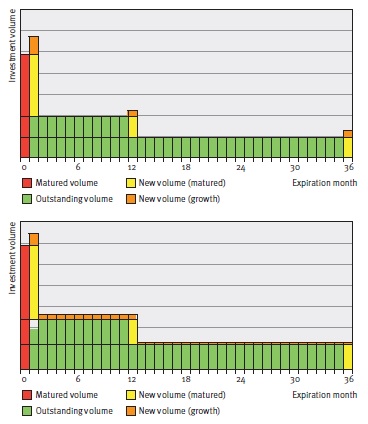
In Figure 1, the difference between the two strategies is graphically illustrated in an example. The example provides the development of replicating portfolios of the two strategies in two consecutive months upon increasing savings volume. The replicating portfolios initially consist of the same investments with original maturities of one month, 12 months and 36 months. To this end, the same investments and corresponding principals mature. The total maturing principal will be reinvested and the increase in savings volume will be invested.

Figure 1: Maturity profiles for the marginal (figure on top) and portfolie (figure below) investment strategies given increasing volume.

Note that if the savings volume would have remained constant, both strategies would have generated the same investments. However, with changing savings volume, the strategies will generate different investments and a different number of investments (3 under the marginal strategy, and 36 under the portfolio strategy).

The interest rate typical maturities and investment returns will therefore differ, even if market interest rates do not change. For the quantitative properties of the strategies, the decision will therefore focus mainly on margin stability and the interest rate typical maturity given changes in volume (and potential simultaneous movements in market interest rates).

Scenario analysis

The quantitative properties of the investment strategies are explained by means of a scenario analysis. The analysis compares the development of the duration, margin and margin stability of both strategies under various savings volume and market interest rate scenarios.

Client interest rate
As part of the simulation of a margin, a client interest rate is modeled. The model consists of a set of sensitivities to market interest rates (M1,t) and moving averages of market interest rates (MA12,t). The sensitivities to the variables show the degree to which the bank has to reflect market movements in its client interest rate, given the profile of its savings clients.

The model chosen for the interest rate for the point in time t (CRt) is as follows:


Up to a certain degree, the model is representative of the savings interest rates offered by (retail) banks.

Investment strategies
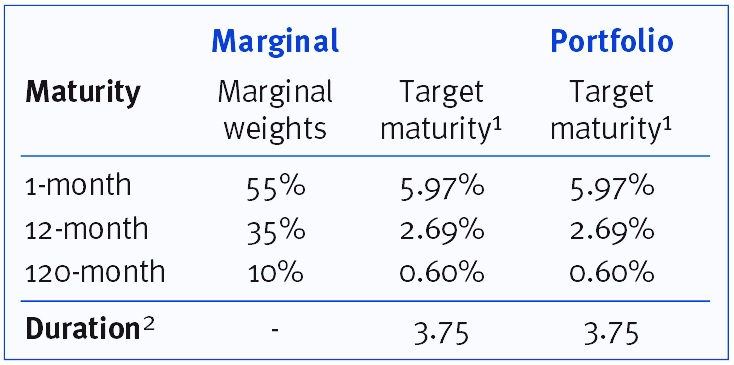
The investment rules are formulated so that the target maturity profiles of the two strategies are identical. This maturity profile is then determined so that the same sensitivities to the variables apply as for the client rate model. An overview of the investment strategies is given in Table 1.

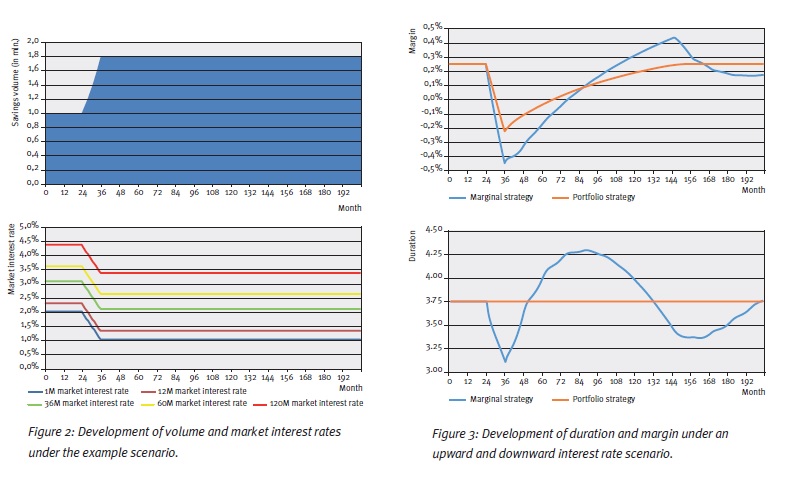
The replication process is simulated for 200 successive months in each scenario. The starting point for the investment portfolio under both strategies is the target maturity profile, whereby all investments are priced using a constant historical (normal) yield curve. In each scenario, upward and downward shocks lasting 12 months are applied to the savings volume and the yield curve after 24 months.

Example scenario

The results of an example scenario are presented in order to show the dynamics of both investment strategies. This example scenario is shown in Figure 2. The results in terms of duration and margin are shown in Figure 3.

As one would expect, the duration for the portfolio investment strategy remains the same over the entire simulation. For the marginal investment strategy, we see a sharp decline in the duration during the ‘shock period’ for volume, after which a double wave motion develops on the duration. In short, this is caused by the initial (marginal) allocation during the ‘stress’ and subsequent cycles of reinvesting it.

With an upward volume shock, the margin for the portfolio strategy declines because the increase in savings volume is invested at downward shocked market interest rates. After the shock period, the declining investment return and client rate converge. For the marginal strategy this effect also applies and in addition the duration effects feed into the margin development.

Scenario spectrum
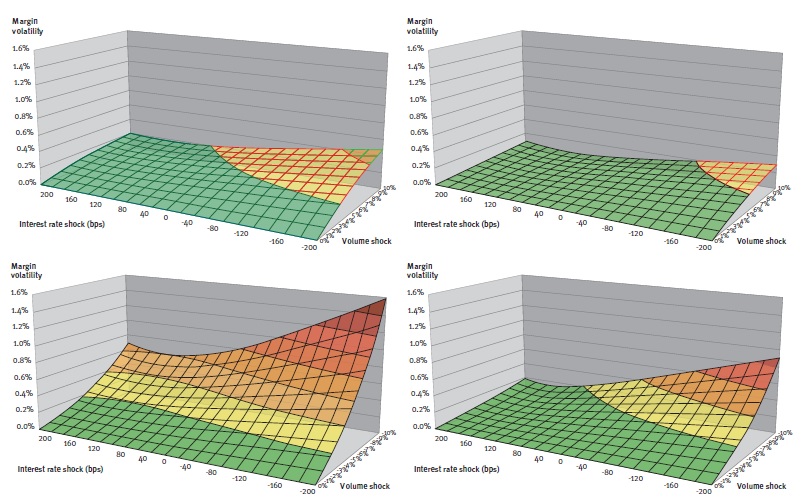
In the scenario analysis the standard deviation of the margin series, also known as the margin volatility, serves as a proxy for margin stability. The results in terms of margin stability for the full range of market interest rate and volume scenarios are summarized in Figure 4.

Figure 4: Margin volatility of marginal (left-hand figure) and portfolio strategy (right-hand figure) for upward (above) and downward (below) volume shocks.

From the figures, it can be seen that the margin of the marginal investment strategy has greater sensitivity to volume and interest rate shocks. Under these scenarios the margin volatility is on average 2.3 times higher, with the factor ranging between 1.5 and 4.5. In general, for both strategies, the margin volatility is greatest under negative interest-rate shocks combined with upward or downward volume shocks.

Replication in practice

The scenario analysis shows that the portfolio strategy has a number of advantages over the marginal strategy. First of all, the maturity profile remains constant at all times and equal to the modeled maturity of the savings deposits. Under the marginal strategy, the interest rate typical maturity can vary from it over long periods, even when there are no changes in market interest environment or behavior in the savings portfolio.

Secondly, the development of the margin is more stable under volume and interest rate shocks. The margin volatility under the marginal investment strategy is actually at least one and a half times higher under the chosen scenarios.

An intuitive process
These benefits might, however, come at the expense of a number of qualitative aspects that may form an important consideration when it comes to implementation. Firstly, the advantage of a constant interest-rate profile for the portfolio strategy, comes at the expense of intuitive combinations of investments. This may be important if these investments form contractual obligations for the transfer of the interest rate risk.

The strategy, namely, requires generating a large number of investments that can even have negative principals in case of a (small) decline of savings volume. Secondly, the shocks in the duration in a marginal strategy might actually be desirable and in line with savings portfolio developments. For example, if due to market or idiosyncratic circumstances there is high inflow of deposit volume, this additional volume may be relatively more interest rate sensitive justifying a shorter duration.

Nevertheless, the example scenario shows that after such a temporary decline a temporary increase will follow for which this justification no longer applies.

The choice

A combination of the two strategies may also be chosen as a compromise solution. This involves the use of a marginal strategy whereby interventions trigger a portfolio strategy at certain times. An intervention policy could be established by means of limits or triggers in the risk governance. Limits can be set for (unjustifiable) deviations from the target duration, whereas interventions can be triggered by material developments in the market or the savings portfolio.

In its choice for the strategy, the bank is well-advised to identify the quantitative and qualitative effects of the strategies. Ultimately, the choice has to be in line with the character of the bank, its savings portfolio and the resulting objective of the process.

  1. The profile shown is a summary of the whole maturity profile. In the whole profile, 5.97% of the replicating volume matures in the first month, 2.69% per month in the second to the 12th month, etc.
  2. Note that this is a proxy for the duration based on the weighted average maturity of the target maturity profile.

An extended version of this article is published in our Savings Special. Would you like to read it? Please send an e-mail to marketing@zanders.eu.

More articles about ‘The modeling of savings’:

Swiss Re: Transforming Liquidity Risk Management with Zanders’ Expertise

As one of the world’s largest reinsurers, Swiss Re leads in treasury and risk management. While liquidity risk is just emerging on most insurers’ regulatory radar, Swiss Re has managed it actively for years. They share how Zanders helped accelerate their liquidity risk reporting solution.


In the 150 years of its existence, Swiss Re has grown to be one of the world’s largest providers of reinsurance and insurance-based forms of risk transfer. Reinsurers are mostly associated with insurance for extreme loss events, such as natural catastrophes. However, Swiss Re’s services cover the entire insurance spectrum: Swiss Re is the counterparty to risks which primary insurance companies and large corporates decide to mitigate.

Liquidity risk

Usually, liquidity is not the first topic that comes to mind as a key risk for reinsurance companies. “The general view was, and kind of still is, that reinsurance companies do not run a lot of liquidity risk, like a bank,” Martin Ramseyer says. For banks, the main driver of liquidity risk is a sudden customer run on deposits. The risk for reinsurers is rather that claims can reach the order of billions, sometimes to be paid out at short notice relative to the magnitude. If sufficient assets cannot be liquidated at a reasonable price within the required time frame, the company not only puts its reputation at stake but also risks bankruptcy – regardless of its solvency or profitability.

From a capital perspective, expanding services across businesses yields a risk diversification benefit. But that benefit does not extend to liquidity, Ramseyer clarifies: “There are many legal limitations imposed by different jurisdictions that limit our abilities to move assets between subsidiaries within the group.” A joint effort of risk and treasury was initiated several years ago to create a framework to measure and manage funding liquidity risk. Initially, the primary objective was to identify potential liquidity constraints for the major legal entities. Calculations gradually grew more extensive, and the framework evolved into an important scenario analysis mechanism used to support executive management decisions. Its execution had become time-consuming, and the operational risk inherent in manual calculations increasingly relevant. The time was ripe to streamline and automate liquidity risk analysis and the reporting process. Andreas Tonn became the business project manager for the system selection and implementation.

Implementation

The choice was made for a vendor solution. “The core advantage is that they provide a framework, which reduces implementation time and facilitates the translation of needs into requirements,” Tonn says. “But as you will never find the perfect tool, it is important to have a clear focus.” Liquidity risk measurement models for the insurance business in vendor systems are still in evolution phase. Flexibility was therefore a key priority for Swiss Re, as the majority of the logic needed to be implemented from scratch. Swiss Re embarked on an intensive proof-of-concept phase, and asked vendors to provide a working demonstration that addressed all aspects of its liquidity risk framework. They chose Wolters Kluwer’s RiskPro, as it proved both mature and sufficiently flexible at the same time.

A phased implementation approach was chosen to gradually introduce the solution into the reporting cycle. However, after the first release, it became apparent the project team would need additional business support if it was to cover all the aspects thoroughly within the stated time frame. “Our internal resources were too committed to other tasks and could not provide support to the extent an intensive project requires,” Tonn says, “but external resources are actually only beneficial to a project if they bring the right expertise to the table.” There were very positive experiences with Zanders on other treasury projects so a request was made for support.

Jeroen van der Heide from Zanders was asked to join the project team: “His ample experience with functional design of various systems across risk domains convinced us that he would indeed accelerate our project.”

Andreas Tonn, business project manager for the system selection and implementation

quote

Challenges

As with many system implementations, getting the data delivered in a systematic fashion was a challenge: different departments have different priorities and downstream reporting is often not on top of their list. Afterwards, the interpretation for modeling was not always clear either as it was complicated by the global reach of the company in which data ownership spans across time zones. For example, intra-group funding was previously measured using a net aggregate approach. With the implementation of RiskPro, the choice made sense to model each debt contract based on its characteristics as booked in the system. Understanding how to calculate the impact of all implicit options automatically for different scenarios required detailed discussions across teams and continents.

The project team has worked relentlessly during the past year in close cooperation with business and IT colleagues. A total of six minor and major releases were accomplished, during which the necessary data and calculations with respect to investments, collateral, reinsurance portfolios, debt, internal cash flows, and contingent funding requirements were added to the system. The RiskPro results were embedded in existing reporting templates, and the change analysis process between reporting dates was partly automated. They were very satisfied with the Zanders support: “Of great benefit was Jeroen’s talent to quickly gain insight out of a huge amount of information, and present the newly created results in such a way to make them understandable to the business user and fit right into existing business processes. That has been a very valuable business contribution.”

Looking towards the future

With the system up and running, the team is able to provide reporting and analytics for the major legal entities within the group and across business segments and branches, rather than only for those with the largest impact from a risk perspective. “It allows us to understand and represent the liquidity dynamics in a more systematic way across the group,” Ramseyer says. The next step is to increase the quantity and quality of the information flow between local business units and treasury. “It will really enhance the risk awareness of local boards and empower them in their active steering efforts. With their feedback they will help improve the framework in return.”

Developments within Treasury Business Services don’t stop there. The system contains the vast majority of Swiss Re’s economic balance sheet down to the transaction and cash flow level. “The vendor software is designed to be an integrated risk system. With the market data and contract data available in full detail, we have a suitable basis to extend the scope of the solution to other domains,” Tonn says. The plan for the next two years, therefore, is to gradually support other analyses, for example with respect to currency risk, funding cost, liquidity planning, and ALM. The consistency between and efficiency of the analyses will improve, enabling the treasury teams to dedicate more time to proactive analysis and steering. Zanders will continue to support these efforts: “Given his successful contribution to the project and his interest to continue to support Swiss Re, we asked Jeroen to manage next year’s project,” Tonn says, “But first things first: we are very much looking forward to the daily use of the implemented solution.”

Customer successes

View all Insights

Banca UBAE improves internal ratings control with EAGLE and FACT

December 2012

Banca UBAE enhanced its credit risk assessment by implementing the customizable EAGLE internal ratings methodology, developed by Zanders, to improve transparency, flexibility, and compliance in its specialized banking operations.


As a bank providing financial services to business enterprises and financial institutions located in North and Sub-Saharan Africa, the Middle East, and the Indian Subcontinent, Banca UBAE relies on accurate and customized credit ratings for its counterparties. While its previous credit rating process didn’t allow for a tailor-made approach, Banca UBAE has recently begun using the EAGLE internal ratings methodology, which gives its credit analysts the transparency and flexibility they need.

The ongoing changes in its markets make counterparty risk assessment more important than ever for Banca UBAE. This Italian bank, headquartered in Rome, has been operating in countries around the Mediterranean and the Middle East since 1972. Trade finance is Banca UBAE’s single most important line of business, and its main products and services include letters of credit, letters of guarantee, discounting, and forfaiting.

In April 2012, the bank implemented the EAGLE corporate rating model, developed by Zanders and available through the FACT web-based platform, developed by Bureau van Dijk.

Customized Ratings

While an external ratings agency such as Fitch Ratings or Standard & Poor’s has a standard and fixed methodology for calculating a rating, Banca UBAE needed a customizable approach, with a tailor-made and transparent credit rating model for each of its counterparties. This is essential considering the specialized and risk-sensitive nature of the bank’s business.

Fabrizia Calvello, a senior credit analyst at Banca UBAE, explains how the bank’s credit analysts customize the counterparty ratings: “In an internal rating, we evaluate qualitative and quantitative information. The analyst is very well acquainted with the client’s core business and balance sheet, as well as the market within which the client operates, so they can insert qualitative data into the internal ratings model.” An important factor is that data is automatically uploaded from the database into the credit rating model. Calvello adds: “For us as a small bank, it is very important to customize the service to our needs.”

Evert de Vries, one of the two Zanders consultants dedicated to the implementation of EAGLE at Banca UBAE, acknowledges that the need for the customized ratings methodology lies in the nature of the bank’s core business. He says: “The bank is working in a challenging environment, so of course it’s very important for them to be able to calculate specific risks.”

Partnership

Considering the specialized nature of Banca UBAE’s business, there was a need for a customizable ratings methodology. The bank had a long-standing working relationship with Bureau van Dijk, a leading publisher of company information and provider of credit risk management solutions. This relationship developed into a regular and established collaboration when, in 2011, Zanders and Bureau van Dijk joined forces to offer a specialized and flexible credit rating product. The EAGLE ratings methodology is based on Bureau van Dijk’s credit risk management platform, FACT, which integrates information from financial databases such as Amadeus.

Thomas Van der Ghinst, business development manager EMEA at Bureau van Dijk, explains how the project was structured and how the elements led to its success: “Zanders was able to customize the standard EAGLE ratings model and calibrate the model according to specific industry sectors – this is one of their strengths. The combination of the Amadeus database, the FACT platform, and the EAGLE credit ratings model makes this a very competitive solution.” He adds: “For me, EAGLE was a perfect fit for Banca UBAE – it met all the requirements of the project goals.”

Bureau van Dijk’s Van der Ghinst also explains that banks often require customizable credit ratings to be more independent from rating agencies. He says: “Working with EAGLE has helped Banca UBAE to better reflect their risk appetite. Internal ratings also help the bank to provide an instant assessment of new clients – this is the key benefit for Banca UBAE. The added value is that you can rate and evaluate companies that don’t have a rating from a rating agency. You can rate any company in the Amadeus database.”

The combination of the Amadeus database, the FACT platform and the EAGLE credit ratings model makes this a very competitive solution.

Jacopo Ribichini, head of the credit department at Banca UBAE.

quote

Smooth Implementation

Banca UBAE implemented EAGLE in April 2012, and the implementation process took about three weeks. So what benefits has Banca UBAE seen since moving to the EAGLE customizable ratings methodology? Jacopo Ribichini, head of the credit department at Banca UBAE, explains: “The product facilitated and sped up the analysis process. At the same time, it became more transparent and precise. The functionality that allows us to adapt the product score from EAGLE with the specific knowledge Banca UBAE has for each customer allows the correct assessment for the commercial relationship our bank has with each counterparty.”

“Furthermore, the product complies with requirements imposed by EU legislation related to risk analysis. The result is a final assessment that is extremely clear, concise, and exhaustive, offering the best conditions for our deliberating bodies to make business decisions,” he adds.

Overall, Ribichini reports that EAGLE had increased the professionalism and efficiency of his department. The implementation was smooth, and Ribichini sums up his thoughts: “Lastly, thanks to the efficient support offered by the Zanders team, I managed the migration to EAGLE without affecting the regular activities carried out by my department.”

Flexibility and Transparency

Reinoud Lyppens, a consultant at Zanders, works with Evert de Vries on the project and adds that other than providing some independence from ratings agencies, EAGLE has two other main advantages: “It is one single platform that enables you to calculate a credit rating for many different industry sectors and counterparties – and, moreover, it is customizable. These two factors were our prime advantages over our competition. We are very open – the model is well documented and validated every year, so I think that transparency is what really makes EAGLE stand out. The client should always understand the process.”

De Vries adds: “Zanders and Bureau van Dijk worked with Banca UBAE throughout the project, not just during implementation but also at later stages, providing advice and support. This post-implementation service is very important in a project like this – when our customer has a question, we are there to support them. We also did some fine-tuning for the oil & gas and commodities sectors for the model. I think the project went well.”

Van der Ghinst adds: “To date, the project has been a real success. The flexibility and professionalism of the Zanders team have resulted in a very positive outcome, which has been appreciated by the client.”

As Banca UBAE is currently expanding and establishing its presence further afield, in Vietnam and Mozambique (as a result of oil & gas exploration), the flexible and transparent internal ratings methodology will be increasingly important to its business.


About Banca UBAE

Banca UBAE, established in 1972 as ‘Unione delle Banche Arabe ed Europee’, is a banking corporation funded by Italian and Arab capital. Shareholders include major banks such as Libyan Foreign Bank, Banque Centrale Populaire, Banque Marocaine du Commerce Extérieur, UniCredit, Intesa Sanpaolo, and large Italian corporate groups like Eni Group, Sansedoni, and Telecom Italia.

Since 1972, Banca UBAE has acted as a trusted consultant and privileged partner for companies and financial institutions wishing to establish or develop commercial, industrial, financial, and economic relations between Europe and countries in North and Sub-Saharan Africa, the Middle East, and the Indian Subcontinent.

Banca UBAE offers a wide range of services and boasts unique expertise in every form of banking relevant to clients engaged in business on Arab markets, from export financing, letters of credit, and documents for collection to finance, syndications of loans and risks, and on-site professional assistance.

Customer successes

View all Insights

Fintegral

is now part of Zanders

In a continued effort to ensure we offer our customers the very best in knowledge and skills, Zanders has acquired Fintegral.

Okay

RiskQuest

is now part of Zanders

In a continued effort to ensure we offer our customers the very best in knowledge and skills, Zanders has acquired RiskQuest.

Okay

Optimum Prime

is now part of Zanders

In a continued effort to ensure we offer our customers the very best in knowledge and skills, Zanders has acquired Optimum Prime.

Okay
This site is registered on wpml.org as a development site.