A new interest-rate risk framework for BNG bank

March 2016

BNG Bank, established to offer low-rate loans to the Dutch government and public interest institutions, helps lower the cost of public amenities, but its balance sheet’s sensitivity to financial market fluctuations highlights the need for a robust interest rate risk framework.


BNG Bank was founded more than 100 years ago – firstly under the name Gemeentelijke Credietbank – as a purchasing association with the main task of bundling the financing requirements of Dutch local authorities so that purchasing benefits could be obtained on capital markets. In 1922, the name was changed to Bank voor Nederlandsche Gemeenten and even today the main aim is, in essence, the same. What has changed is the role of local authorities, says John Reichardt, a member of the Board of BNG Bank. He explains: “Over the past few years they have diversified. Many of their responsibilities are now independent or even privatized. Hospitals, electricity boards and housing companies, for example, were in the hands of local authorities but now operate independently. They are, however, still our clients because they provide public services.”

Different to Other Banks

To satisfy the financing requirements of its clients, BNG Bank collects money on the international capital markets to realize ‘bundled’ purchasing benefits. “And we pass these benefits on to our customers,” says Reichardt. “While our customers have become more diverse over time, our product portfolio has widened. Some thirty years ago we became a bank, with a comprehensive banking license, and this meant we could take up short-term loans, make investments, and handle our customers’ payments. We try to be a full-service bank, but then only for services our customers need.”

The state holds half of the shares and the remainder belongs to local authorities and provinces/counties. “Because of this we always have the dilemma: should we go for more profit and more dividend, or should our strong purchasing position be reflected immediately in our prices by means of a moderate pricing strategy? Our goal is to be big in our market – we think we should keep 35 to 50 percent of the total outstanding debt on our balance sheet. We are not striving for maximum profit, and that differentiates us from many other banks. Although we are a private company, we do also feel we are a part of the government,” says Reichardt.

Changed Worlds

BNG Bank has only one branch in The Hague, with 300 employees. The bank has grown considerably, mainly over the past few years. As of the start of the financial crisis, a number of services from other parties have disappeared, so BNG Bank was often called upon to step in. Now, partly as a result of this, it has become one of the systematically important Dutch banks. “From a character point of view, we are more of a middle-sized company, but as far as the balance sheet is concerned, we are a large bank. We earn our money by buying cheaply, but also by trying to pass this on as cheaply as possible to our customers – with a small commission. This brings with it a strong focus on risk management, including managing our own assets and the associated risks. These are partly credit risks, but we have fewer risks than other banks – because, thanks to the government, our customers are usually very creditworthy.”

BNG Bank also runs certain interest rate risks that have to be controlled on a day-to-day basis. “We have done this in a certain way for a long time, but in the meantime the world has changed,” says Hans Noordam, head of risk management at BNG Bank. “So we thought it was time to give the method a face-lift to test whether we are doing it right, with the right instruments and whether we are looking at the right things? We also wanted someone else to take a good look at it.”

So BNG Bank concluded that the interest rate risk framework had to be revised. “Our approach once was state of the art but, as always with the dialectics of progress, we didn’t do enough ourselves to keep up with changes in that respect,” Reichardt explains. “When we looked at the whole management of interest rate risk, on the one hand it was about the departments involved, and on the other hand the measurement system – the instruments we used and everything associated with them used to produce information which enabled decision-making on our position strategy. That is a big project.

Project Harry

Over the past few years various developments have taken place in the area of market risk. When BNG Bank changed its products and methods, various changes also took place in the areas of risk management and valuation, including extra requirements from the regulator. “So we started a preliminary investigation and formed one unit within risk management,” says Reichardt. At the end of 2012, BNG Bank appointed Petra Danisevska as head of risk management/ALM (RM/ALM). “We agreed not to reinvent the wheel ourselves, but mainly to look closely at best market practices,” she says.

Zanders helped us with this. In May 2013 we started an investigation to find out which interest rate risks were present in the bank and where improvement levels could be made.

Petra Danisevska, Head of risk management/ALM (RM/ALM) at BNG Bank

quote

Noordam explains that they agreed on suggested steps with the Asset Liability Committee (ALCO), which also provided input and expressed preferences. A plan was then made and the outlines sketched. To convert that into concrete actions, Noordam says that a project was initiated at the beginning of 2014: Project Harry. “This gets its name from BNG Bank’s location, also the home of a Dutch cartoon character, called Haagse Harry. He was the symbol of the whirlwind which was to whip through the bank,” says Noordam.

Within ALCO Limits

“During the (economic) crisis, all sorts of things happened which influenced the valuation of our balance sheet,” Reichardt explains. “They also had many effects on the measurement of our interest rate risk. We had to apply totally different curves – sometimes with very strange results. Our company is set up in a way that with our economic hedging and our hedge accounting, we can buy for X and pass it on to our customers for X plus a couple of basis points, which during the period of the loan reverts to us. We retain a small amount and on the basis of this pay out a dividend – our model is that simple. However, since the valuations were influenced by market changes, we were more or less obliged to take measures in order to stay within our ALCO limits. These measures, with respect to managing our interest position, would not have been realizable under our current philosophy; simply because they weren’t necessary. We knew we had to find a solution for that phenomenon in the project. After much discussion we were able to find a solution: to be more reliable within the technical framework of anticipating market movements which strongly influence valuation of financial instruments. In other words: the spread risk and the rate risk had to be separately measured and managed from one another. The world had changed and our interest rate risk management, as well as reporting and calculations based upon it, had to as well.”

After revision of the interest rate risk framework, as of the second half of 2015, all interest-rate risk measurements, their drivers and reporting were changed. The market risks as a result of the changes in interest rate curves, were then measured and reported on a daily basis by the RM/ALM department. “There is definitely better management of the interest rate risk; we generate more background data and create more possibilities to carry out analyses,” Danisevska explains. “We now have detailed figures that we couldn’t get before, with which we can show ALCO the risk and the accompanying, assumed return.”

More proactive

Noordam knew that Project Harry would involve a considerable effort. “The risk framework would inevitably suffer quite a lot. It had to be innovated on the basis of calculated conditions, while the implementation required a lot of internal resources and specific knowledge. Technical points had to be solved, while relationships had to be safeguarded; many elements with all sorts of expertise had to be integrated. The European Central Bank was stringent – that took up a lot of time and work. We had an asset quality review (AQR) and a stress test – that was completely new to us. Sometimes we were tempted to stay on known ground, but even during those periods we were able to carry on with the project. We rolled up our shirtsleeves and together we gained from the experience.”

Reichardt says: “It was a tough project for us, with complex subject matter and lots of different opinions. In total it took us seven quarters to complete. However, I think we have accomplished more than we expected at the beginning. With a combination of our own people and external expertise, we have managed to make up for lost ground. We have exchanged the rags for riches and we have been successful. Where do we stand now? As well as the required numbers, we have a clear view of what our thoughts are on ‘what is interest rate risk and what isn’t’. The only thing we still have to do is to fine-tune the roles: what can you expect from risk managers and risk takers, and how will they react to this? We will continue to monitor it. RM/ALM as a department is in any case a lot more proactive – that was an important goal for us. We can be more successful, but the department is really earning its spurs within the bank and that means profit for everyone.”

Customer successes

View all Insights

Replicating investment portfolios

February 2016
3 min read

Many banks use a framework of replicating investment portfolios to measure and manage the interest rate risk of variable savings deposits. There are two commonly used methodologies, known as the marginal investment strategy and the portfolio investment strategy. While these have the same objective, the effects for margin and interest maturity may vary. We review these strategies on the basis of a quantitative and a qualitative analysis.


A replicating investment portfolio is a collection of fixed-income investments based on an investment strategy that aims to reflect the typical interest rate maturity of the savings deposits (also referred to as ‘non-maturing deposits’). The investment strategy is formulated so that the margin between the portfolio return and the savings interest rate is as stable as possible, given various scenarios.

A replicating framework enables a bank to base its interest rate risk measurement and management on investments with a fixed maturity and price – while the deposits have no contractual maturity or price. In addition, a bank can use the framework to transfer the interest rate risk from the business lines to the central treasury, by turning the investments into contractual obligations. There are two commonly used methodologies for constructing the replicating portfolios: the marginal investment strategy and the portfolio investment strategy. These strategies have the same objective, but have different effects on margin and interest-rate term, given certain scenarios.

Strategies defined

An investment strategy determines the monthly allocation of the investable volume across various maturities. The investable volume in month t ( It ) consists of two parts:

The first part is equal to the decrease or increase in the volume of savings deposits compared to the previous month. The second part is equal to the total principal of all investments in the investment portfolio maturing in the current month (end date m = t ), Σi,m=t vi,m.

By investing or re-investing the volume of these two parts, the total principal of the investment portfolio will equal the savings volume outstanding at that moment. When an investment is generated, it receives the market interest rate relating to the maturity at that time. The portfolio investment return is determined as the principal weighted average interest rate.

The difference between a marginal investment strategy and a portfolio investment strategy is that in a marginal investment strategy, the volume is invested with a fixed allocation across fixed maturities. In a portfolio strategy, these parameters are flexible, however investments are generated in such a way that the resulting portfolio each month has the same (target) proportional maturity profile. The maturity profile provides the total monthly principal of the currently outstanding investments that will mature in the future.

In the savings modelling framework, the interest rate risk profile of the savings portfolio is estimated and defined as a (proportional) maturity profile. For the portfolio investment strategy, the target maturity profile is set equal to this estimated profile. For the marginal investment strategy, the ‘investment rule’ is derived from the estimated profile using a formula. Under long lasting constant or stable volume of savings deposits, the investment portfolio given the investment rule converges to the estimated profile.

Strategies illustrated

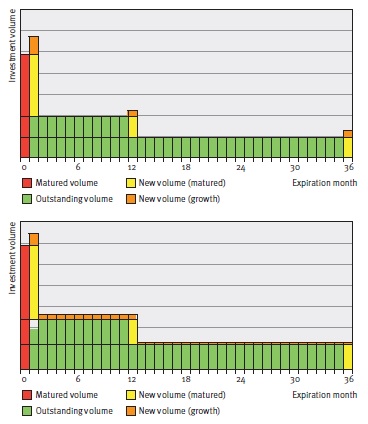
In Figure 1, the difference between the two strategies is graphically illustrated in an example. The example provides the development of replicating portfolios of the two strategies in two consecutive months upon increasing savings volume. The replicating portfolios initially consist of the same investments with original maturities of one month, 12 months and 36 months. To this end, the same investments and corresponding principals mature. The total maturing principal will be reinvested and the increase in savings volume will be invested.

Figure 1: Maturity profiles for the marginal (figure on top) and portfolie (figure below) investment strategies given increasing volume.

Note that if the savings volume would have remained constant, both strategies would have generated the same investments. However, with changing savings volume, the strategies will generate different investments and a different number of investments (3 under the marginal strategy, and 36 under the portfolio strategy).

The interest rate typical maturities and investment returns will therefore differ, even if market interest rates do not change. For the quantitative properties of the strategies, the decision will therefore focus mainly on margin stability and the interest rate typical maturity given changes in volume (and potential simultaneous movements in market interest rates).

Scenario analysis

The quantitative properties of the investment strategies are explained by means of a scenario analysis. The analysis compares the development of the duration, margin and margin stability of both strategies under various savings volume and market interest rate scenarios.

Client interest rate
As part of the simulation of a margin, a client interest rate is modeled. The model consists of a set of sensitivities to market interest rates (M1,t) and moving averages of market interest rates (MA12,t). The sensitivities to the variables show the degree to which the bank has to reflect market movements in its client interest rate, given the profile of its savings clients.

The model chosen for the interest rate for the point in time t (CRt) is as follows:


Up to a certain degree, the model is representative of the savings interest rates offered by (retail) banks.

Investment strategies
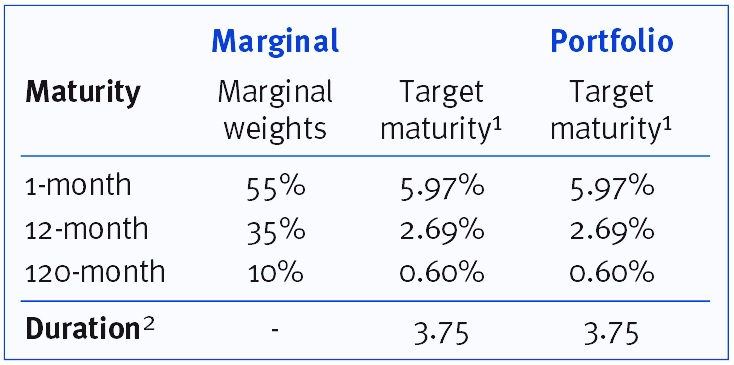
The investment rules are formulated so that the target maturity profiles of the two strategies are identical. This maturity profile is then determined so that the same sensitivities to the variables apply as for the client rate model. An overview of the investment strategies is given in Table 1.

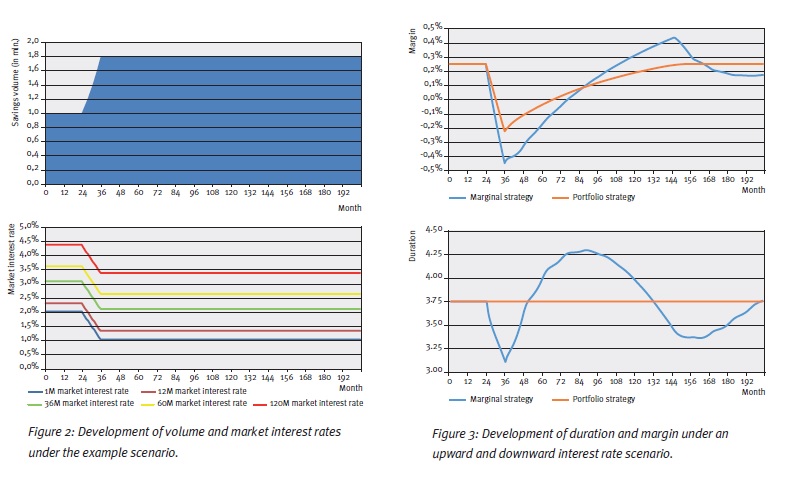
The replication process is simulated for 200 successive months in each scenario. The starting point for the investment portfolio under both strategies is the target maturity profile, whereby all investments are priced using a constant historical (normal) yield curve. In each scenario, upward and downward shocks lasting 12 months are applied to the savings volume and the yield curve after 24 months.

Example scenario

The results of an example scenario are presented in order to show the dynamics of both investment strategies. This example scenario is shown in Figure 2. The results in terms of duration and margin are shown in Figure 3.

As one would expect, the duration for the portfolio investment strategy remains the same over the entire simulation. For the marginal investment strategy, we see a sharp decline in the duration during the ‘shock period’ for volume, after which a double wave motion develops on the duration. In short, this is caused by the initial (marginal) allocation during the ‘stress’ and subsequent cycles of reinvesting it.

With an upward volume shock, the margin for the portfolio strategy declines because the increase in savings volume is invested at downward shocked market interest rates. After the shock period, the declining investment return and client rate converge. For the marginal strategy this effect also applies and in addition the duration effects feed into the margin development.

Scenario spectrum
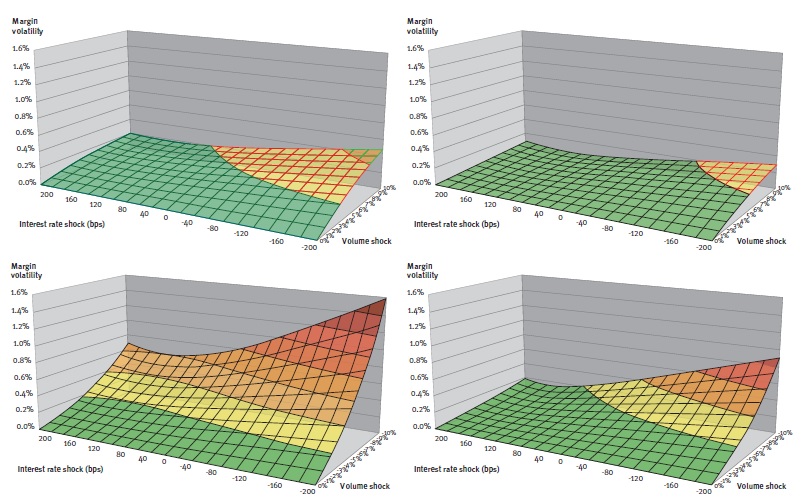
In the scenario analysis the standard deviation of the margin series, also known as the margin volatility, serves as a proxy for margin stability. The results in terms of margin stability for the full range of market interest rate and volume scenarios are summarized in Figure 4.

Figure 4: Margin volatility of marginal (left-hand figure) and portfolio strategy (right-hand figure) for upward (above) and downward (below) volume shocks.

From the figures, it can be seen that the margin of the marginal investment strategy has greater sensitivity to volume and interest rate shocks. Under these scenarios the margin volatility is on average 2.3 times higher, with the factor ranging between 1.5 and 4.5. In general, for both strategies, the margin volatility is greatest under negative interest-rate shocks combined with upward or downward volume shocks.

Replication in practice

The scenario analysis shows that the portfolio strategy has a number of advantages over the marginal strategy. First of all, the maturity profile remains constant at all times and equal to the modeled maturity of the savings deposits. Under the marginal strategy, the interest rate typical maturity can vary from it over long periods, even when there are no changes in market interest environment or behavior in the savings portfolio.

Secondly, the development of the margin is more stable under volume and interest rate shocks. The margin volatility under the marginal investment strategy is actually at least one and a half times higher under the chosen scenarios.

An intuitive process
These benefits might, however, come at the expense of a number of qualitative aspects that may form an important consideration when it comes to implementation. Firstly, the advantage of a constant interest-rate profile for the portfolio strategy, comes at the expense of intuitive combinations of investments. This may be important if these investments form contractual obligations for the transfer of the interest rate risk.

The strategy, namely, requires generating a large number of investments that can even have negative principals in case of a (small) decline of savings volume. Secondly, the shocks in the duration in a marginal strategy might actually be desirable and in line with savings portfolio developments. For example, if due to market or idiosyncratic circumstances there is high inflow of deposit volume, this additional volume may be relatively more interest rate sensitive justifying a shorter duration.

Nevertheless, the example scenario shows that after such a temporary decline a temporary increase will follow for which this justification no longer applies.

The choice

A combination of the two strategies may also be chosen as a compromise solution. This involves the use of a marginal strategy whereby interventions trigger a portfolio strategy at certain times. An intervention policy could be established by means of limits or triggers in the risk governance. Limits can be set for (unjustifiable) deviations from the target duration, whereas interventions can be triggered by material developments in the market or the savings portfolio.

In its choice for the strategy, the bank is well-advised to identify the quantitative and qualitative effects of the strategies. Ultimately, the choice has to be in line with the character of the bank, its savings portfolio and the resulting objective of the process.

  1. The profile shown is a summary of the whole maturity profile. In the whole profile, 5.97% of the replicating volume matures in the first month, 2.69% per month in the second to the 12th month, etc.
  2. Note that this is a proxy for the duration based on the weighted average maturity of the target maturity profile.

An extended version of this article is published in our Savings Special. Would you like to read it? Please send an e-mail to marketing@zanders.eu.

More articles about ‘The modeling of savings’:

Fintegral

is now part of Zanders

In a continued effort to ensure we offer our customers the very best in knowledge and skills, Zanders has acquired Fintegral.

Okay

RiskQuest

is now part of Zanders

In a continued effort to ensure we offer our customers the very best in knowledge and skills, Zanders has acquired RiskQuest.

Okay

Optimum Prime

is now part of Zanders

In a continued effort to ensure we offer our customers the very best in knowledge and skills, Zanders has acquired Optimum Prime.

Okay
This site is registered on wpml.org as a development site.