Unlocking Value in Private Equity: Treasury Optimization as the Strategic Lever in the New Era of Operational Value Creation
August 2024
6 min read
Authors:
Lou Gueroeva, Pieter Kraak
Share:
In the high-stakes world of private equity, where the pressure to deliver exceptional returns is relentless, the playbook is evolving.
In the high-stakes world of private equity, where the pressure to deliver exceptional returns is relentless, the playbook is evolving. Gone are the days when financial engineering—relying heavily on leveraged buyouts and cost-cutting—was the silver bullet for value creation. Today, the narrative is shifting toward a more sustainable, operationally driven approach, with treasury and finance optimization emerging as pivotal levers in this transformation.
In this article, we blend fictional examples, use cases and other real-world examples to vividly illustrate key concepts and drive our points home.
The Disconnect Between Promised and Delivered Operational Value
Limited Partners (LPs) are becoming more discerning in their investment decisions, increasingly demanding more than just financial returns. They expect General Partners (GPs) to deliver on promises of operational improvements that go beyond mere financial engineering. However, there is often a significant disconnect between the operational value creation promised by GPs and the reality, which frequently relies too heavily on short-term financial tactics.
A report by McKinsey highlights that while 60% of GPs claim to focus on operational improvements, only 40% of LPs feel that these efforts significantly impact portfolio performance. This gap between intention and execution underscores the need for GPs to align their value creation strategies with LP expectations. LPs are particularly focused on consistent investment strategies, strong management teams, and robust operational processes that drive sustainable growth. They view genuine operational value creation as the cornerstone of a repeatable and sustainable investment strategy, offering reassurance that future fund generations will perform consistently.
Treasury: The Unsung Hero of Value Creation
Treasury functions, once seen as mere back-office operations, are increasingly recognized as crucial drivers of value in private equity. These functions—ranging from cash management to financial risk mitigation—are the lifeblood of any portfolio company.
The evolution of treasury functions, now known as Treasury 4.x, has transformed them into pivotal drivers of value. These modernized treasury roles—encompassing advanced cash management and risk mitigation—now align financial operations with broader strategic goals, leveraging technology and data analytics to optimize performance.
Yet, many firms struggleto appreciate just how much inefficiencies in these areas can erode value. Poor liquidity management, fragmented cash operations, and outdated financial processes can strangle a company's ability to invest in growth and hamstring its potential to capitalize on market opportunities.
Consider the example of a mid-sized European manufacturing firm acquired by a private equity investor. Initially, the focus was solely on scaling revenue by entering new markets. However, it soon became apparent that fragmented treasury operations were hemorrhaging resources, particularly due to decentralized cash management systems across multiple jurisdictions.
By centralizing these operations into a single source of truth, like a treasury management system (TMS), the company was able to cut down on redundant processes, improve visibility and central control on cash, reduce external borrowing cost and cash related operational costs by 20%. This freed up capital that was then reinvested into R&D and expansion efforts, positioning the firm to seize new growth opportunities with agility.
Cash Flow Forecasting: The Financial Crystal Ball
In the realm of private equity, where every dollar counts, cash flow forecasting is not just a routine exercise—it’s a strategic imperative. Accurate cash flow forecasting provides a clear window into a company's financial future, offering transparency that is invaluable for both internal decision-makers and external stakeholders, especially Limited Partners (LPs) who demand rigorous insights into their investments.
Take, for example, a mid-market technology firm backed by private equity, poised to launch a groundbreaking product. Initially, the firm’s cash flow forecasts were rudimentary, lacking the sophistication needed to anticipate the working capital needs for the product launch phase. As a result, the company nearly ran into a liquidity crisis that could have delayed the launch.
By overhauling its cash flow forecasting processes and incorporating scenario analysis, the company was able to better anticipate cash needs, secure bridge financing, and ensure a successful product rollout, which ultimately boosted investor confidence.
Navigating Financial Risks in a Volatile World
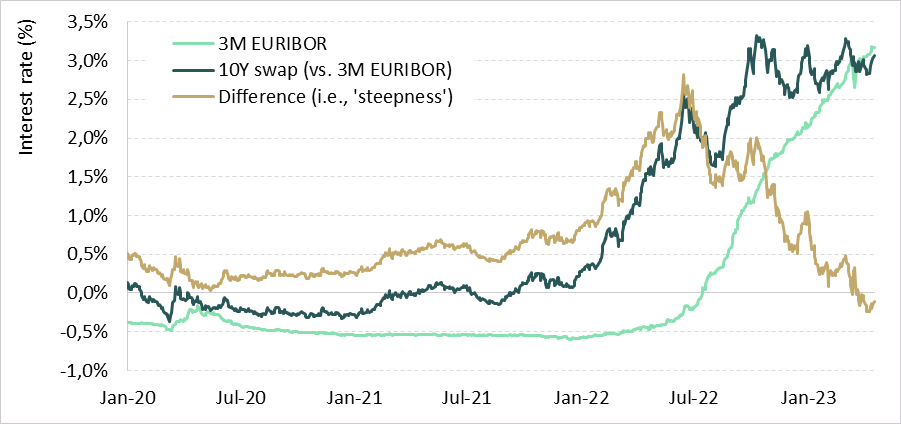
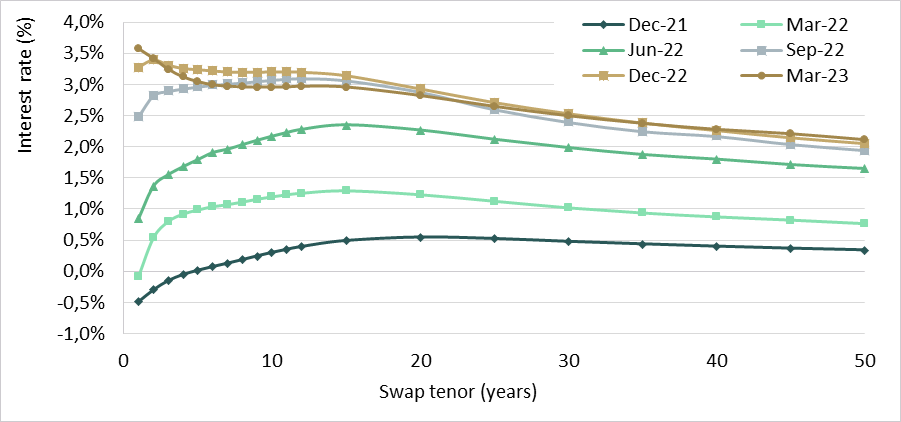
In today’s unpredictable economic landscape, managing financial risks such as currency fluctuations and interest rate spikes is more critical than ever. As private equity firms increasingly engage in cross-border acquisitions, the exposure to foreign exchange risk has become a significant concern. Similarly, the current high-interest-rate environment complicates debt management, adding layers of complexity to financial operations.
Consider a global consumer goods company within a private equity portfolio, operating in regions with volatile currencies like Brazil or South Africa. Without a robust FX hedging strategy, the company was previously exposed to unpredictable swings in cash flows due to exchange rate fluctuations, which affected its ability to meet debt obligations denominated in foreign currencies.
By implementing a comprehensive FX hedging strategy, including the use of natural hedges, the firm was able to lock in favorable exchange rates, stabilize its cash flows, and protect its margins. This not only ensured financial stability but also allowed the company to reinvest profits into expanding its footprint in emerging markets.
Treasury in M&A: A Crucial Integration Component
Treasury management is often the linchpin in the success or failure of mergers and acquisitions (M&A). The ability to seamlessly integrate treasury operations is essential for realizing the synergies promised by a merger. Failure to do so can lead to significant financial inefficiencies, eroding the anticipated value.
A cautionary tale can be seen in General Electric’s acquisition of Alstom Power, where unforeseen integration challenges led to substantial restructuring costs. The treasury teams faced difficulties in aligning the cash management systems and integrating different financial cultures, which delayed synergies realization and led to missed financial targets.
Conversely, in another M&A scenario involving the merger of two mid-sized logistics firms, a pre-emptive focus on treasury integration—such as harmonizing cash pooling arrangements and consolidating banking relationships—enabled the new entity to achieve cost synergies ahead of schedule, saving millions in operational expenses and improving free cash flow.
Streamlined Treasury and Finance: Driving Strategic Value and Returns in Private Equity
Streamlined treasury and finance operations are crucial for maximizing value in private equity. These enhancements go beyond cost savings, improving a company's agility and resilience by ensuring financial resources are available precisely when needed. This empowers portfolio companies to seize growth opportunities while driving cost savings and better resource utilization through operational efficiency. Optimizing cash management and liquidity also enables companies to better navigate market volatility, reducing risks such as poor cash flow forecasting.
Enhanced transparency and real-time data visibility lead to more informed decision-making, aligning with long-term value creation strategies. This not only strengthens investor confidence but also prepares companies for successful exits by making them more attractive to potential buyers. Improved free cash flow directly boosts the money-on-money multiple, enhancing financial outcomes for private equity investors.
Conclusion
In today’s private equity landscape, the strategic importance of treasury and finance optimization is undeniable. The era of relying solely on financial engineering is over. A comprehensive approach that includes robust treasury management and operational efficiency is now essential for driving sustainable growth and maximizing value. By addressing treasury inefficiencies, private equity firms can unlock significant value, ensuring portfolio companies have the financial health to thrive. This approach meets the rising expectations of Limited Partners, setting the stage for long-term success and profitable exits.
If you're interested in delving deeper into the benefits of strategic treasury management for private equity firms, you can contact Job Wolters.
Transfer Pricing Compliance with Zanders Transfer Pricing Suite: Royal Philips Case Study
Managing over 80 intercompany loans annually and with a wide geographical scope, Royal Philips faced the challenge of complying with their Transfer Pricing obligations.
Zanders Transfer Pricing Suite is an innovative, cloud-based solution designed for companies looking to automate the Transfer Pricing compliance of financial transactions. With over five years of experience and trusted by more than 60 multinational corporations, the platform is the market-leading solution for financial transactions Transfer Pricing.On March 31, 2023, Zanders and Royal Philips jointly presented the conference "How Philips Automated Its Transfer Pricing Process for Group Financing" at the DACT (Dutch Association of Corporate Treasurers) Treasury Fair 2023.
Context The publication of Chapter X of Financial Transactions by the OECD, as well as its incorporation into the 2022 OECD Transfer Pricing Guidelines, has led to an increased scrutiny by tax authorities. Consequently, transfer pricing for financial transactions, such as intra-group loans, guarantees, cash pools, and in-house banks, has become a critical focus for treasury and tax departments.
ZANDERS TRANSFER PRICING SOLUTION
As compliance with Transfer Pricing regulations gains greater significance, many companies find that the associated analyses consume excessive time and resources from their in-house tax and treasury departments. Several struggle to automate the end-to-end process, from initiating intercompany loans to determining the arm's length interest, recording the loans in their Treasury Management System (TMS), and storing the Transfer Pricing documentation.
Since 2018, Zanders Transfer Pricing Solution has supported multinational corporations in automating their Transfer Pricing compliance processes for financial transactions.
ROYAL PHILIPS CASE STUDY
Managing over 80 intercompany loans annually and with a wide geographical scope, Royal Philips faced the challenge of complying with their Transfer Pricing obligations. During the conference, Joris Van Mierlo, Corporate Finance Manager at Philips, detailed how Royal Philips implemented a fully integrated solution to determine and record the arm's length interest rates applicable to its intra-group loans.
In the high-stakes world of private equity, where the pressure to deliver exceptional returns is relentless, the playbook is evolving. Gone are the days when financial engineering—relying
Zanders Transfer Pricing Suite is an innovative, cloud-based solution designed for companies looking to automate the Transfer Pricing compliance of financial transactions. With over five years
This paper offers a straightforward analysis of the Basel Committee on Banking Supervision's standards on crypto asset exposures and their adoption by 2025. It critically assesses
In recent years, consumers’ and investors’ interest in sustainability has been growing. Since 2015, assets under management in ESG funds have nearly tripled, the outstanding value of
In this report, biodiversity loss ranks as the fourth most pressing concern after climate change adaptation, mitigation failure, and natural disasters. For financial institutions (FIs), it
Carbon offset processes are currently dominated by private actors providing legitimacy for the market. The two largest of these, Verra and Gold Standard, provide auditing services, carbon
Early October, the Basel Committee on Banking Supervision (BCBS) published a report[1] on the 2023 banking turmoil that involved the failure of several US banks as well as Credit Suisse. The
The SAP Business Technology Platform (BTP) is not just a standalone product or a conventional module within SAP's suite of ERP systems; rather, it serves as a strategic platform from SAP,
Treasurers dealing with multiple jurisdictions, scattered banking landscape, and local requirements face many challenges in this regard. Japan is one of the markets where bank connectivity
Seventy banks have been considered, which is an increase of twenty banks compared to the previous exercise. The portfolios of the participating banks contain around three quarters of all EU
The CSP helps reinforce the controls protecting participants from cyberattack and ensures their effectivity and that they adhere to the current Swift security requirements.
*Swift does not
As a result of the growing importance of this transformative technology and its applications, various regulatory initiatives and frameworks have emerged, such as Markets in Crypto-Assets
Over the past decades, banks significantly increased their efforts to implement adequate frameworks for managing interest rate risk in the banking book (IRRBB). These efforts typically focus
Nationaal Warmtefonds was established in 2013 as an experimental fund backed by the Dutch government to help homeowners make their houses more energy efficient. Today, it's a key player in the
As the European Union increasingly emphasizes robust digital resilience within the financial sector as of January 17th 2025, the Digital Operational Resilience Act (DORA) has become a critical
Managing banking book risk remains a critical challenge in today’s financial markets and regulatory environment. There are many strategic decisions to be made and banks are having trouble
On July 2nd, the European Banking Authority (EBA) published a Consultation Paper proposing amendments to its 2016 Guidelines on the application of the definition of default (DoD). As part of the
Artificial intelligence (AI) is advancing rapidly, particularly with the emergence of large language models (LLMs) such as Generative Pre-trained Transformers (GPTs). Yet, in quantitative risk
The games market just keeps getting bigger. And with limits on this growth seemingly uncharted, interest from governments and private sector investors is at an all-time high. Savvy Games Group
In an industry where growth is often measured in multiples, and value creation is expected to be both scalable and repeatable, operational excellence is no longer a supporting function—it’s
With extreme weather events becoming more frequent and climate policy tightening across jurisdictions, banks are under increasing pressure to understand how climate change will impact their
With the introduction of CRR3, effective from January 1, 2025, the ‘extra’ guarantee on Dutch mortgages – known as the Dutch National Mortgage Guarantee (NHG) – will no longer be
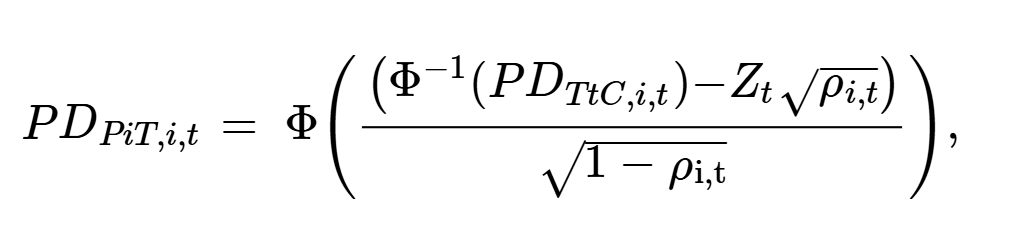
According to the IFRS 9 standards, financial institutions are required to model probability of default (PD) using a Point-in-Time (PiT) measurement approach — a reflection of present
Inflows from open reverse repos
In May 2024 the EBA stated1 that inflows from open reverse repos cannot be recognised in LCR calculations unless the call option has already been
This article is intended for finance, risk, and compliance professionals with business and system integration knowledge of SAP, but also includes contextual guidance for broader audiences.
1.
Our team at Zanders has been at the forefront of implementing BACS AUDDIS (Automated Direct Debit Instruction Service) with SAP S/4HANA, helping clients to streamline their direct debit
Thailand's e-Withholding Tax (e-WHT) system officially launched on October 27, 2020, in collaboration with 11 banks, marking a significant digital transformation with far-reaching benefits for
In today’s rapidly evolving financial landscape, fortifying the Financial Risk Management (FRM) function remains a top priority for CFOs. Zanders has identified a growing trend among
Emergence of Artificial Intelligence and Machine Learning
The rise of ChatGPT has brought generative artificial intelligence (GenAI) into the mainstream, accelerating adoption across
Introduction
In December 2024, FINMA published a new circular on nature-related financial (NRF) risks. Our main take-aways:
NRF risks not only comprise climate-related risks,
As mid-sized corporations expand, enhancing their Treasury function becomes essential. International growth, exposure to multiple currencies, evolving regulatory requirements, and increased
Industry surveys show that FRTB may lead to a 60% increase in regulatory market risk capital requirements, placing significant pressure on banks. As regulatory market risk capital requirements
First, these regions were analyzed independently such that common trends and differences could be noted within. These results were aggregated for each region such that these regions could be
Crypto Asset Exposures: Critical Assessment of Infrastructure Risks
March 2024
8 min read
Authors:
Robert Richter, Justus Schleicher
Share:
This paper explores vital infrastructure decisions, regulatory scrutiny, and proposes a flexible risk approach for financial institutions in crypto asset navigation by 2025.
This paper offers a straightforward analysis of the Basel Committee on Banking Supervision's standards on crypto asset exposures and their adoption by 2025. It critically assesses infrastructure risks, categorizes crypto assets for regulatory purposes, and proposes a flexible approach to managing these risks based on the blockchain network's stability. Through expert interviews, key risk drivers are identified, leading to a framework for quantifying infrastructure risks. This concise overview provides essential insights for financial institutions navigating the complex regulatory and technological landscape of crypto assets.
Greenwashing in Finance: Navigating the Shades of Sustainability
February 2024
8 min read
Authors:
Martin Ruf, Elena Paniagua-Avila
Share:
This article explores the growing interest in sustainability among consumers and investors, the role of financial institutions in supporting green initiatives, and the rising concern about “greenwashing” – deceptive claims regarding environmental efforts by some financial institutions.
In recent years, consumers’ and investors’ interest in sustainability has been growing. Since 2015, assets under management in ESG funds have nearly tripled, the outstanding value of green bonds issued by residents of the euro area has surged eightfold, and emission-related derivatives have seen a more than sevenfold increase1.
The global push for sustainable and environmentally responsible practices has led to an increased focus on the role of financial institutions in supporting green initiatives. One of the ways financial institutions use to incentivise sustainable investments, is by designing new products, such as blue bonds to protect marine areas and other sustainability-linked bonds2, or by transitioning to funding sectors with positive sustainability impact.
However, amidst the growing wave of environmental consciousness, the credibility of "green" claims made by some financial institutions is a point of concern. This phenomenon, known as greenwashing, is gaining attention, not only within financial institutions, but also with regulators. Financial regulators, including the European Supervisory Authorities (ESAs) and UK’s Financial Conduct Authority (FCA) have taken action against potentially misleading green statements made by institutions. Despite these regulatory interventions, the persistent risk of greenwashing persists, primarily due to the absence of consistent standards governing sustainability claims and disclosures. The lack of uniform criteria poses an ongoing challenge to effectively combatting greenwashing practices within the financial landscape.
Defining Greenwashing
The ESAs describe greenwashing as “a practice where sustainability-related statements, declarations, actions, or communications do not clearly and fairly reflect the underlying sustainability profile of an entity, a financial product, or financial services. This practice may be misleading to consumers, investors, or other market participants” 3.
Financial institutions, as key players in the global economy, play a crucial role in fostering sustainability. However, some have been accused of using deceptive practices to push their green image without making substantial changes. This practice may be misleading to consumers, investors, and other market participants.
In practice, greenwashing can take different forms depending on the institution. For insurance companies, the European Insurance and Occupational Pensions Authority (EIOPA) found in their Advise to the European Commission on Greenwashing4 various examples where insurers misleadingly claimed to be transitioning their underwriting activities to net zero by 2050 without any credible plans to do so. Other examples include insurance companies falsely claiming to plant trees for each life insurance policy sold but failing to fulfil this promise, or products being marketed as sustainable merely because of a positive "ESG rating," despite the rating not taking into account any actual sustainability factors and focusing solely on financial risks.
Withing the banking sector, the EBA reported5 that the most common misleading claims relate to the current approach to integrating sustainability into the business strategy, claims on the sustainability results and the real-world impact, and claims on future commitments on medium and long-term plans.
Finally, for investment companies and pension funds, the European Securities and Markets Authority (ESMA) reported6 that most the common greenwashing practices result from exaggerated claims without any proven link between and ESG metric and the real-world impact.
Key Indicators of Greenwashing:
Vague and Ambiguous Language: Financial institutions engaging in greenwashing often use vague terms and ambiguous language in their marketing materials. This lack of clarity makes it challenging for consumers to discern the actual environmental impact of their investments.
Lack of Transparency: Genuine commitment to sustainability involves transparency about investment choices and the environmental impact of financial products. Institutions that are less forthcoming about their practices may be concealing less-than-green investments.
Inconsistent Policies: Greenwashing is also evident when there is a misalignment between a financial institution's sustainability claims and its actual policies and practices. Actions, or lack thereof, can speak louder than words.
The Role of Regulatory Bodies
Greenwashing poses potential reputational and financial risks for the institutions involved. Addressing greenwashing might not only improve consumer’s trust in the products and services offered by financial institutions, but also will allow customers to make informed decisions that are align with their sustainability preferences and increase the capital into products that genuinely represent a more sustainable choice and drive a positive change. Tackling greenwashing should therefore be a priority for regulatory supervisors.
The introduction of the EU’s Taxonomy Regulation and the Sustainable Finance Disclosure Regulation (SFDR) addresses the initial concerns of greenwashing within the financial sector. The Taxonomy determines which economic activities are environmentally sustainable and addresses greenwashing by enabling market participants to identify and invest in sustainable assets with more confidence. SFDR promotes openness and transparency in sustainable finance transactions and requires Financial Market Participants to share the environmental and social impact of their transactions with stakeholders. In May 2023, the ESA published their progress report on greenwashing monitoring and supervision7. The report aims to provide insights into an understanding of greenwashing and identify the specific forms it can take within banking. It also evaluates greenwashing risk within the EU banking sector and determines the extend to which it might be and issue from a regulatory perspective.
In the UK, the FCA published in November 2023 a guidance consultation on the Anti-Greenwashing Rule8. The anti-greenwashing rule is one part of a package of measures introduced through the Sustainability Disclosure Requirements (SDR). The anti-greenwashing rule requires FCA-authorised firms to ensure that any claims they make to the sustainability characteristics of their financial products and services are consistent with the actual sustainability characteristics of the product or service and are fair, clear and not misleading, and have evidence to back them up. The propose rule will come into force on 31 May 2024.
While the existing and planned regulation contributes to addressing aspects of greenwashing, several measures have not yet fully entered into application, making the impact of the frameworks not visible yet. Beyond disclosures, regulators should also focus on tightening requirements on sustainability data and ratings, and creating mandates to prevent misleading statements and unfair commercial practices.
Going forward, as regulators gain more experience to comprehensively address greenwashing, financial institutions should expect increased supervision and enforcement of sustainable finance policies aimed at preventing misleading sustainability claims.
Actions to mitigate greenwashing risk
One of the biggest challenges financial institutions faced in relation to sustainability is that scientific progress, policy development and social values are in constant evolution. What was a well-supported green initiative two years ago can potentially be considered as greenwashing today.
In the meantime that stricter regulations and guidance is in place, financial institutions should take a broad view on how to develop and communicate sustainability strategies to mitigate greenwashing risk.
Here are three ways on how to prevent greenwashing:
Promote disclosure: financial institutions should publish comprehensive sustainability reports and disclose ESG information as part of their financial reports.
Commit to transparency: claims about environmental aspects or performance of their products should be justified with science-based and verifiable methods. Financial institutions should be transparent about their ambitions, status, and be open about any shortcomings they identified.
Align business practices with purpose: financial institutions should determine which climate-related and environmental risks impact business strategy in the short, medium and long term. They should reflect climate-related and environmental risks in business strategies and its implementation. In addition, they should balance sustainability ambitions with the reality of real transformation.
Zanders’ approach to managing reputational risk
Avoiding greenwashing should always be a priority for institutions. If a risk arises in this area, reputational risk management can help to limit negative effects. Due to the interdependencies between ESG, reputational, business and liquidity risk, the supervisory authorities are also increasingly focusing on this area.
In the context of reputational risk management, we recommend a holistic approach that includes both existing and new business in the analysis. In addition to identifying critical transactions from a reputational perspective, the focus is also on active stakeholder management. This requires cross-departmental cooperation between various units within the institution. In many cases, the establishment of a reputation risk management committee is key to manage that topic properly within the institution.
Conclusion
While many financial institutions genuinely strive for sustainability, the rise of greenwashing highlights the need for increased vigilance and scrutiny. Consumers, regulators, and industry stakeholders must work together to ensure that financial institutions align their actions with their environmental claims, fostering a truly sustainable and responsible financial sector.
European Central Bank, Climate-related risks to fiancial stability, 2021. ↩︎
European Central Bank, Climate-related risks to fiancial stability, 2021. ↩︎
European Banking Authority, Progress report on greenwashing monitoring and supervision, 2023. ↩︎
European Banking Authority, Progress report on greenwashing monitoring and supervision, 2023. ↩︎
European Banking Authority, Progress report on greenwashing monitoring and supervision, 2023. ↩︎
European Securities and Markets Authority, Progress report on greenwashing, 2023. ↩︎
European Banking Authority, Progress report on greenwashing monitoring and supervision, 2023. ↩︎
Financial Conduct Authority, Guidance on the Anti-Greenwashing rule, 2023. ↩︎
Biodiversity risks and opportunities for financial institutions explained
November 2023
8 min read
Authors:
Marije Wiersma, Jaap Gerrits, Iryna Fedenko
Share:
This paper explores vital infrastructure decisions, regulatory scrutiny, and proposes a flexible risk approach for financial institutions in crypto asset navigation by 2025.
In this report, biodiversity loss ranks as the fourth most pressing concern after climate change adaptation, mitigation failure, and natural disasters. For financial institutions (FIs), it is therefore a relevant risk that should be taken into account. So, how should FIs implement biodiversity risk in their risk management framework?
Despite an increasing awareness of the importance of biodiversity, human activities continue to significantly alter the ecosystems we depend on. The present rate of species going extinct is 10 to 100 times higher than the average observed over the past 10 million years, according to Partnership for Biodiversity Accounting Financials[i]. The Intergovernmental Science-Policy Platform on Biodiversity and Ecosystem Services (IPBES) reports that 75% of ecosystems have been modified by human actions, with 20% of terrestrial biomass lost, 25% under threat, and a projection of 1 million species facing extinction unless immediate action is taken. Resilience theory and planetary boundaries state that once a certain critical threshold is surpassed, the rate of change enters an exponential trajectory, leading to irreversible changes, and, as noted in a report by the Nederlandsche Bank (DNB), we are already close to that threshold[ii].
We will now explain biodiversity as a concept, why it is a significant risk for financial institutions (FIs), and how to start thinking about implementing biodiversity risk in a financial institutions’ risk management framework.
What is biodiversity?
The Convention on Biological Diversity (CBD) defines biodiversity as “the variability among living organisms from all sources including, i.a., terrestrial, marine and other aquatic ecosystems and the ecological complexes of which they are part.”[iii] Humans rely on ecosystems directly and indirectly as they provide us with resources, protection and services such as cleaning our air and water.
Biodiversity both affects and is affected by climate change. For example, ecosystems such as tropical forests and peatlands consist of a diverse wildlife and act as carbon sinks that reduce the pace of climate change. At the same time, ecosystems are threatened by the accelerating change caused by human-induced global warming. The IPBES and Intergovernmental Panel on Climate Change (IPCC), in their first-ever collaboration, state that “biodiversity loss and climate change are both driven by human economic activities and mutually reinforce each other. Neither will be successfully resolved unless both are tackled together.”[iv]
Why is it relevant for financial institutions?
While financial institutions’ own operations do not materially impact biodiversity, they do have impact on biodiversity through their financing. ASN Bank, for instance, calculated that the net biodiversity impact of its financed exposure is equivalent to around 516 square kilometres of lost biodiversity – which is roughly equal to the size of the isle of Ibiza in Spain[v]. The FIs’ impact on biodiversity also leads to opportunities. The Institute Financing Nature (IFN) report estimates that the financing gap for biodiversity is close to $700 billion annually[vi]. This emphasizes the importance of directing substantial financial resources towards biodiversity-positive initiatives.
At the same time, biodiversity loss also poses risks to financial institutions.
The global economy highly depends on biodiversity as a result of the increasedglobalization and interconnectedness of the financial system. Due to these factors, the effects of biodiversity losses are magnified and exacerbated through the financial system, which can result in significant financial losses. For example, approximately USD 44 trillion of the global GDP is highly or moderately dependent on nature (World Economic Forum, 2020). Specifically for financial institutions, the DNB estimated that Dutch FIs alone have EUR 510 billionof exposure to companies that are highly or very highly dependent on one or more ecosystems services[vii]. Furthermore, in the 2010 World Economic Forum report worldwide economic damage from biodiversity loss is estimated to be around USD 2 to 4.5 trillion annually. This is remarkably high when compared to the negative global financial damage of USD 1.7 trillion per year from greenhouse gas emissions (based on 2008 data), which demonstrates that institutions should not focus their attention solely on the effects of climate change when assessing climate & environmental risks[viii].
Examples of financial impact
Similarly to climate risk, biodiversity risk is expected to materialize through the traditional risk types a financial institution faces. To illustrate how biodiversity loss can affect individual financial institutions, we provide an example of the potential impact of physical biodiversity risk on, respectively, the credit risk and market risk of an institution:
Credit risk:
Failing ecosystem services can lead to disruptions of production, reducing the profits of counterparties. As a result, there is an increase in credit risk of these counterparties. For example, these disruptions can materialize in the following ways:
A total of 75% of the global food crop rely on animals for their pollination. For the agricultural sector, deterioration or loss of pollinating species may result in significant crop yield reduction.
Marine ecosystems are a natural defence against natural hazards. Wetlands prevented USD 650 million worth of damages during the 2012 Superstorm Sandy [OECD, 2019), while the material damage of hurricane Katrina would have been USD 150 billion less if the wetlands had not been lost.
Market risk:
The market value of investments of a financial institution can suffer from the interconnectedness of the global economy and concentration of production when a climate event happens. For example:
A 2011 flood in Thailand impacted an area where most of the world's hard drives are manufactured. This led to a 20%-40% rise in global prices of the product[ix]. The impact of the local ecosystems for these type of products expose the dependency for investors as well as society as a whole.
Core part of the European Green Deal
The examples above are physical biodiversity risk examples. In addition to physical risk, biodiversity loss can also lead to transition risk – changes in the regulatory environment could imply less viable business models and an increase in costs, which will potentially affect the profitability and risk profile of financial institutions. While physical risk can be argued to materialize in a more distant future, transition risk is a more pressing concern as new measures have been released, for example by the European Commission, to transition to more sustainable and biodiversity friendly practices. These measures are included in the EU biodiversity strategy for 2030 and the EU’s Nature restoration law.
The EU’s biodiversity strategy for 2030 is a core part of European Green Deal. It is a comprehensive, ambitious, and long-term plan that focuses on protecting valuable or vulnerable ecosystems, restoring damaged ecosystems, financing transformation projects, and introducing accountability for nature-damaging activities. The strategy aims to put Europe's biodiversity on a path to recovery by 2030, and contains specific actions and commitments. The EU biodiversity strategy covers various aspects such as:
Legal protection of an additional 4% of land area (up to a total of 7%) and 19% of sea area (up to a total of 30%)
Strict protection of 9% of sea and 7% of land area (up to a total of 10% for both)
Reduction of fertilizer use by at least 20%
Setting measures for sustainable harvesting of marine resources
A major step forwards towards enforcement of the strategy is the approval of the Nature restoration law by the EU in July 2023, which will become the first continent-wide comprehensive law on biodiversity and ecosystems. The law is likely to impact the agricultural sector, as the bill allows for 30% of all former peatlands that are currently exploited for agriculture to be restored or partially shifted to other uses by 2030. By 2050, this should be at least 70%. These regulatory actions are expected to have a positive impact on biodiversity in the EU. However, a swift implementation may increase transition risk for companies that are affected by the regulation.
The ECB Guide on climate-related and environmental risks explicitly states that biodiversity loss is one of the risk drivers for financial institutions[x]. Furthermore, the ECB Guide requires financial institutions to asses both physical and transition risks stemming from biodiversity loss. In addition, the EBA Report on the Management and Supervision of ESG Risk for Credit Institutions and Investment Firms repeatedly refers to biodiversity when discussing physical and transition risks[xi].
Moreover, the topic ‘biodiversity and ecosystems’ is also covered by the Corporate Sustainability Reporting Directive (CSRD), which requires companies within its scope to disclose on several sustainability related matters using a double materiality perspective.[1] Biodiversity and ecosystems is one of five environmental sustainability matters covered by CSRD. At a minimum, financial institutions in scope of CSRD must perform a materiality assessment of impacts, risks and opportunities stemming from biodiversity and ecosystems. Furthermore, when biodiversity is assessed to be material, either from financial or impact materiality perspective, the institution is subject to granular biodiversity-related disclosure requirements covering, among others, topics such as business strategy, policies, actions, targets, and metrics.
Where to start?
In line with regulatory requirements, financial institutions should already be integrating biodiversity into their risk management practices. Zanders recognizes the challenges associated with biodiversity-related risk management, such as data availability and multidimensionality. Therefore, Zanders suggests to initiate this process by starting with the following two steps. The complexity of the methodologies can increase over time as the institution’s, the regulator’s and the market’s knowledge on biodiversity-related risks becomes more mature.
Perform materiality assessment using the double materiality concept. This means that financial institutions should measure and analyze biodiversity-related financial materiality through the identification of risks and opportunities. Institutions should also assess their impacts on biodiversity, for example, through calculation of their biodiversity footprint. This can start with classifying exposures’ impact and dependency on biodiversity based on a sector-level analysis.
Integrate biodiversity-related risks considerations into their business strategy and risk management frameworks. From a business perspective, if material, financial institutions are expected to integrate biodiversity in their business strategy, and set policies and targets to manage the risks. Such actions could be engagement with clients to promote their sustainability practices, allocation of financing to ‘biodiversity-friendly’ projects, and/or development of biodiversity specific products. Moreover, institutions are expected to adjust their risk appetites to account for biodiversity-related risks and opportunities, establish KRIs along with limits and thresholds. Embedding material ESG risks in the risk appetite frameworks should include a description on how risk indicators and limits are allocated within the banking group, business lines and branches.
Considering the potential impact of biodiversity loss on financial institutions, it is crucial for them to extend their focus beyond climate change and also start assessing and managing biodiversity risks. Zanders can support financial institutions in measuring biodiversity-related risks and taking first steps in integrating these risks into risk frameworks. Curious to hear more on this? Please reach out to Marije Wiersma, Iryna Fedenko, or Jaap Gerrits.
[1] CSRD applies to large EU companies, including banks and insurance firms. The first companies subject to CSRD must disclose according to the requirements in the European Sustainability Reporting Standards (ESRS) from 2025 (over financial year 2024), and by the reporting year 2029, the majority of European companies will be subject to publishing the CSRD reports. The sustainability report should be a publicly available statement with information on the sustainability-matters that the company considers material. This statement needs to be audited with limited assurance.
[ii] De Nederlandche Bank. (2020). Indepted to nature - Exploring biodiversity risks for the Dutch Financial Sector.
[iii] CBD. (2005). Handbook of the convention on biological diversity
[iv] IPBES. (2021). Tackling Biodiversity & Climate Crises Together & Their Combined Social Impacts
[v] ASN Bank (2022). ASN Bank Biodiversity Footprint
[vi] Paulson Institute. (2021). Financing nature: Closing the Global Biodiversity
[vii] De Nederlandche Bank. (2020). Indepted to nature - Exploring biodiversity risks for the Dutch Financial Sector
[viii] PwC for World Economic Forum. (2010). Biodiversity and business risk
[ix] All the examples related to credit and market risk are presented in the report by De Nederlandsche Bank. (2020). Biodiversity Opportunities and Risks for the Financial Sector
[x] ECB. (2020). Guide on climate-related and environmental risks.
[xi] EBA. (2021). EBA Report on Management and Supervision of ESG Risk for Credit Institutions and Investment Firms
Blockchain-based Tokenization for decentralized Issuance and Exchange of Carbon Offsets
November 2023
8 min read
Authors:
Robert Richter, Justus Schleicher
Share:
This paper explores vital infrastructure decisions, regulatory scrutiny, and proposes a flexible risk approach for financial institutions in crypto asset navigation by 2025.
Carbon offset processes are currently dominated by private actors providing legitimacy for the market. The two largest of these, Verra and Gold Standard, provide auditing services, carbon registries and a marketplace to sell carbon offsets, making them ubiquitous in the whole process. Due to this opacity and centralisation, the business models of the existing companies was criticised regarding its validity and the actual benefit for climate action. By buying an offset in the traditional manner, the buyer must place trust in these players and their business models. Alternative solutions that would enhance the transparency of the process as well as provide decentralised marketplaces are thus called for.
The conventional process
Carbon offsets are certificates or credits that represent a reduction or removal of greenhouse gas emissions from the atmosphere. Offset markets work by having companies and organizations voluntarily pay for carbon offsetting projects. Reasons for partaking in voluntary carbon markets vary from increased awareness of corporate responsibility to a belief that emissions legislation is inevitable, and it is thus better to partake earlier.
Some industries also suffer prohibitively expensive barriers for lowering their emissions, or simply can’t reduce them because of the nature of their business. These industries can instead benefit from carbon offsets, as they manage to lower overall carbon emissions while still staying in business. Environmental organisations run climate-friendly projects and offer certificate-based investments for companies or individuals who therefore can reduce their own carbon footprint. By purchasing such certificates, they invest in these projects and their actual or future reduction of emissions. However, on a global scale, it is not enough to simply lower our carbon footprint to negate the effects of climate change. Emissions would in practice have to be negative, so that even a target of 1,5-degree Celsius warming could be met. This is also remedied by carbon credits, as they offer us a chance of removing carbon from the atmosphere. In the current process, companies looking to take part in the offsetting market will at some point run into the aforementioned behemoths and therefore an opaque form of purchasing carbon offsets.
The blockchain approach
A blockchain is a secure and decentralised database or ledger which is shared among the nodes of a computer network. Therefore, this technology can offer a valid contribution addressing the opacity and centralisation of the traditional procedure. The intention of the first blockchain approaches were the distribution of digital information in a shared ledger that is agreed on jointly and updated in a transparent manner. The information is recorded in blocks and added to the chain irreversibly, thus preventing the alteration, deletion and irregular inclusion of data.
In the recent years, tokenization of (physical) assets and the creation of a digital version that is stored on the blockchain gained more interest. By utilizing blockchain technology, asset ownership can be tokenized, which enables fractional ownership, reduces intermediaries, and provides a secure and transparent ledger. This not only increases liquidity but also expands access to previously illiquid assets (like carbon offsets). The blockchain ledger allows for real-time settlement of transactions, increasing efficiency and reducing the risk of fraud. Additionally, tokens can be programmed to include certain rules and restrictions, such as limiting the number of tokens that can be issued or specifying how they can be traded, which can provide greater transparency and control over the asset.
Blockchain-based carbon offset process
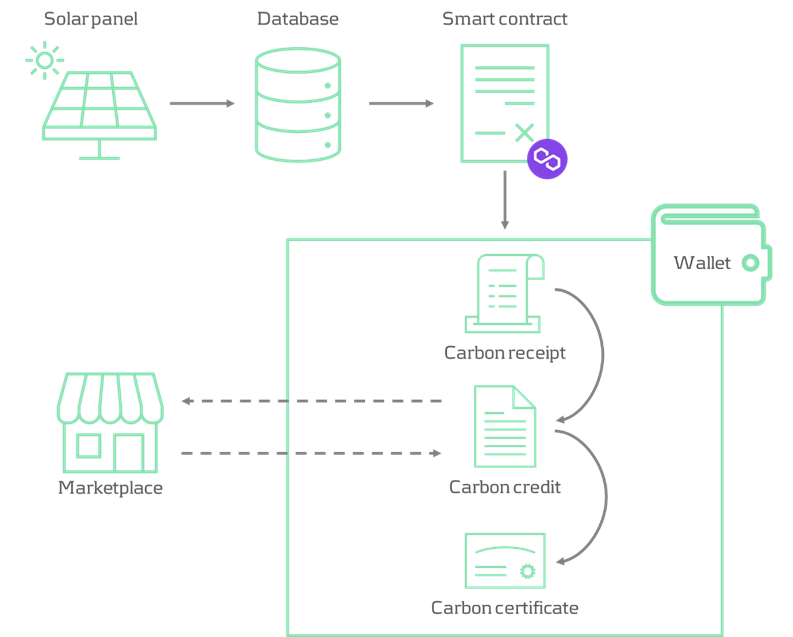
The tokenisation process for carbon credits begins with the identification of a project that either captures or helps to avoid carbon creation. In this example, the focus is on carbon avoidance through solar panels. The generation of solar electricity is considered an offset, as alternative energy use would emit carbon dioxide, whereas solar power does not.
The solar panels provide information regarding their electricity generation, from which a figure is derived that represents the amount of carbon avoided and fed into a smart contract. A smart contract is a self-executing application that exist on the blockchain and performs actions based on its underlying code. In the blockchain-based carbon offset process, smart contracts convert the different tokens and send them to the owner’s wallet. The tokens used within the process are compliant with the ERC-721 Non-Fungible Token (NFT) standard, which represents a unique token that is distinguishable from others and cannot be exchanged for other units of the same asset. A practical example is a work of art that, even if replicated, is always slightly different.
In the first stage of the process, the owner claims a carbon receipt, based on the amount of carbon avoided by the solar panel. Thereby the aggregated amount of carbon avoided (also stored in a database just for replication purposes) is sent to the smart contract, which issues a carbon receipt of the corresponding figure to the owner. Carbon receipts can further be exchanged for a uniform amount of carbon credits (e.g. 5 kg, 10 kg, 15 kg) by interacting with the second smart contract. Carbon credits are designed to be traded on the decentralised marketplace, where the price is determined by the supply and demand of its participants. Ultimately, carbon credits can be exchanged for carbon certificates indicating the certificate owner and the amount of carbon offset. Comparable with a university diploma, carbon certificates are tied to the address of the owner that initiated the exchange and are therefore non-tradable. Figure 1 illustrates the process of the described blockchain-based carbon offset solution:
Figure 1: Process flow of a blockchain-based carbon offset solution
Conclusion
The outlined blockchain-based carbon offset process was developed by Zanders’ blockchain team in a proof of concept. It was designed as an approach to reduce dependence on central players and a transparent method of issuing carbon credits. The smart contracts that the platform interacts with are implemented on the Mumbai test network of the public Polygon blockchain, which allows for fast transaction processing and minimal fees. The PoC is up and running, tokenizing the carbon savings generated by one of our colleagues photovoltaic system, and can be showcased in a demo. However, there are some clear optimisations to the process that should be considered for a larger scale (commercial) setup.
If you're interested in exploring the concept and benefits of a blockchain-based carbon offset process involving decentralised issuance and exchange of digital assets, or if you would like to see a demo, you can contact Robert Richter or Justus Schleicher.
The 2023 Banking Turmoil
November 2023
8 min read
Author:
Pieter Klaassen
Share:
This paper explores vital infrastructure decisions, regulatory scrutiny, and proposes a flexible risk approach for financial institutions in crypto asset navigation by 2025.
Early October, the Basel Committee on Banking Supervision (BCBS) published a report[1] on the 2023 banking turmoil that involved the failure of several US banks as well as Credit Suisse. The report draws lessons for banking regulation and supervision which may ultimately lead to changes in banking regulation as well as supervisory practices. In this article we summarize the main findings of the report[2]. Based on the report’s assessment, the most material consequences for banks, in our view, could be in the following areas:
Reparameterization of the LCR calculation and/or introduction of additional liquidity metrics
Inclusion of assets accounted for at amortized cost at their fair value in the determination of regulatory capital
Implementation of extended disclosure requirements for a bank's interest rate exposure and liquidity position
More intensive supervision of smaller banks, especially those experiencing fast growth and concentration in specific client segments
Application of the full Basel III Accord and the Basel IRRBB framework to a larger group of banks
Bank failures and underlying causes
The BCBS report first describes in some detail the events that led to the failure of each of the following banks in the spring of 2023:
Silicon Valley Bank (SVB)
Signature Bank of New York (SBNY)
First Republic Bank (FRB)
Credit Suisse (CS)
While each failure involved various bank-specific factors, the BCBS report highlights common features (with the relevant banks indicated in brackets).
Long-term unsustainable business models (all), in part due to remuneration incentives for short-term profits
Governance and risk management did not keep up with fast growth in recent years (SVB, SBNY, FRC)
Ineffective oversight of risks by the board and management (all)
Overreliance on uninsured customer deposits, which are more likely to be withdrawn in a stress situation (SVB, SBNY, FRC)
Unprecedented speed of deposit withdrawals through online banking (all)
Investment of short-term deposits in long-term assets without adequate interest-rate hedges (SVB, FRC)
Failure to assess whether designated assets qualified as eligible collateral for borrowing at the central bank (SVB, SBNY)
Client concentration risk in specific sectors and on both asset and liability side of the balance sheet (SVB, SBNY, FRC)
Too much leniency by supervisors to address supervisory findings (SVB, SBNY, CS)
Incomplete implementation of the Basel Framework: SVB, SBNY and FRB were not subject to the liquidity coverage ratio (LCR) of the Basel III Accord and the BCBS standard on interest rate risk in the banking book (IRRBB)
Of the four failed banks, only Credit Suisse was subject to the LCR requirements of the Basel III Accord, in relation to which the BCBS report includes the following observations:
A substantial part of the available high quality liquid assets (HQLA) at CS was needed for purposes other than covering deposit outflows under stress, in contrast to the assumptions made in the LCR calculation
The bank hesitated to make use of the LCR buffer and to access emergency liquidity so as to avoid negative signalling to the market
Although not part of the BCBS report, these observations could lead to modifications to the LCR regulation in the future.
Lessons for supervision
With respect to supervisory practices, the BCBS report identifies various lessons learned and raises a few questions, divided into four main areas:
1. Bank’s business models
Importance of forward-looking assessment of a bank’s capital and liquidity adequacy because accounting measures (on which regulatory capital and liquidity measures are based) mostly are not forward-looking in nature
A focus on a bank’s risk-adjusted profitability
Proactive engagement with ‘outlier banks’, e.g., banks that experienced fast growth and have concentrated funding sources or exposures
Consideration of the impact of changes in the external environment, such as market conditions (including interest rates) and regulatory changes (including implementation of Basel III)
2. Bank’s governance and risk management
Board composition, relevant experience and independent challenge of management
Independence and empowerment of risk management and internal audit functions
Establishment of an enterprise-wide risk culture and its embedding in corporate and business processes.
Senior management remuneration incentives
3.Liquidity supervision
Do the existing metrics (LCR, NSFR) and supervisory review suffice to identify start of material liquidity outflows?
Should the monitoring frequency of metrics be increased (e.g., weekly for business as usual and daily or even intra-day in times of stress)?
Monitoring of concentration risks (clients as well as funding sources)
Are sources of liquidity transferable within the legal entity structure and freely available in times of stress?
Testing of contingency funding plans
4. Supervisory judgment
Supplement rules-based regulation with supervisory judgment in order to intervene pro-actively when identifying risks that could threaten the bank’s safety and soundness. However, the report acknowledges that a supervisor may not be able to enforce (pre-emptive) action as long as an institution satisfies all minimum requirements. This will also depend on local legislative and regulatory frameworks
Lessons for regulation
In addition, the BCBS report identifies various potential enhancement to the design and implementation of bank regulation in four main areas:
1. Liquidity standards
Consideration of daily operational and intra-day liquidity requirements in the LCR, based on the observation that a material part of the HQLA of CS was used for this purpose but this is not taken into account in the determination of the LCR
Recalibration of deposit outflows in the calculation of LCR and NSFR, based on the observation that actual outflow rates at the failed banks significantly exceeded assumed outflows in the LCR and NSFR calculations
Introduction of additional liquidity metrics such as a 5-day forward liquidity position, survival period and/or non-risk based liquidity metrics that do not rely on run-off assumptions (similar to the role of the leverage ratio in the capital framework)
2. IRRBB
Implementation of the Basel standard on IRRBB, which did not apply to the US banks, could have made the interest rate risk exposures transparent and initiated timely action by management or regulatory intervention.
More granular disclosure, covering for example positions with and without hedging, contractual maturities of banking book positions and modelling assumptions
3. Definition of regulatory capital
Reflect unrealised gains and losses on assets that are accounted for at amortised cost (AC) in regulatory capital, analogous to the treatment of assets that are classified as available-for-sale (AFS). This is supported by the observation that unrealised losses on fixed-income assets held at amortised cost, resulting from to the sharp rise in interest rates, was an important driver of the failure of several US banks when these assets were sold to create liquidity and unrealised losses turned into realised losses. The BCBS report includes the following considerations in this respect:
If AC assets can be repo-ed to create liquidity instead of being sold, then there is no negative impact on the financial statement
Treating unrealised gains and losses on AC assets in the same way as AFS assets will create additional volatility in earnings and capital
The determination of HQLA in the LCR regulation requires that assets are measured at no more than market value. However, this does not prevent the negative capital impact described above
Reconsideration of the role, definition and transparency of additional Tier-1 (AT1) instruments, considering the discussion following the write-off of AT1 instruments as part of the take-over of CS by UBS
4. Application of the Basel framework
Broadening the application of the full Basel III framework beyond internationally active banks and/or developing complementary approaches to identify risks at domestic banks that could pose a threat to cross-border financial stability. The events in the spring of this year have demonstrated that distress at relatively small banks that are not subject to the (full) Basel III regulation can trigger broader and cross-border systemic concerns and contagion effects.
Prudent application of the ‘proportionality’ principle to domestic banks, based on the observation that financial distress at such banks can have cross-border financial stability effects
Harmonization of approaches that aim to ensure that sufficient capital and liquidity is available at individual legal entity level within banking groups
Conclusion
The BCBS report identifies common shortcomings in bank risk management practices and governance at the four banks that failed during the 2023 banking turmoil and summarizes key take-aways for bank supervision and regulation.
The identified shortcomings in bank risk management include gaps in the management of traditional banking risks (interest rate, liquidity and concentration risks), failure to appreciate the interrelation between individual risks, unsustainable business models driven by short-term incentives at the expense of appropriate risk management, poor risk culture, ineffective senior management and board oversight as well as a failure to adequately respond to supervisory feedback and recommendations.
Key take-aways for effective supervision include enforcing prompt action by banks in response to supervisory findings, actively monitoring and assessing potential implications of structural changes to the banking system, and maintaining effective cross-border supervisory cooperation.
Key lessons for regulatory standards include the importance of full and consistent implementation of Basel standards as well as potential enhancements of the Basel III liquidity standards, the regulatory treatment of interest rate risk in the banking book, the treatment of assets that are accounted for at amortised cost within regulatory capital and the role of additional Tier-1 capital instruments.
The BCBS report is intended as a starting point for discussion among banking regulators and supervisors about possible changes to banking regulation and supervisory practices. For those interested in engaging in discussions related to the insights and recommendations in the BCBS report, please feel free to contact Pieter Klaassen.
[2] Although recognized as relevant in relation to the banking turmoil, the BCBS report explicitly excludes from its consideration the role and design of deposit guarantee schemes, the effectiveness of resolution arrangements, the use and design of central bank lending facilities and FX swap lines, and public support measures in banking crises.
Driving Treasury Innovation: A Closer Look at SAP BTP
October 2023
8 min read
Author:
Ian Haegemans
Share:
This paper explores vital infrastructure decisions, regulatory scrutiny, and proposes a flexible risk approach for financial institutions in crypto asset navigation by 2025.
The SAP Business Technology Platform (BTP) is not just a standalone product or a conventional module within SAP's suite of ERP systems; rather, it serves as a strategic platform from SAP, serving as the foundational underpinning for all company-wide innovations. In this article, we will delve deeper into some of the key offerings of SAP BTP for treasury and explore how it can contribute to driving innovation within treasury.
The platform is designed to offer a versatile array of tools and services, aiming to enhance, extend, and seamlessly integrate with your existing SAP systems and other applications. Ultimately enabling a more efficient realization of your business objectives, delivering enhanced operational efficacy and flexibility.
Analytics and AI
One of the standout features of SAP BTP for treasury is its analytics and planning solution, SAP Analytics Cloud (SAC). This feature seamlessly connects with different data sources and other SAP applications. It supports Extended Planning & Analysis and Predictive Planning using machine learning models.
At the core of SAC, various planning areas – like finance, supply chain, and workforce – are combined into a cloud-based interconnected plan. This plan is based on a single version of the truth, bringing planning content together. Enhanced by predictive AI and ML models, the plan achieves more accurate forecasting and supports near-real-time planning. Users can also compare different scenarios and perform what-if analysis to evaluate the impact of changes on the plan equipping organizations to prepare for uncertainties effectively.
Application Development and Integration
An organization's treasury architecture landscape often involves numerous systems, custom applications, and enhancements. However, this complexity can result in challenges related to maintenance, technical debt, and operational efficiency.
Addressing these challenges, SAP BTP offers a solution known as the SAP Build apps tool. The tool enables users to adapt standard functionalities and create custom business applications through intuitive no-code/low-code tools. This allows that all custom development takes place outside your SAP ERP system, thereby preserving a ‘clean core’ of your SAP system. This will allow for a simpler, more streamlined maintenance process and a reduced risk of compatibility issues when upgrading to newer versions of SAP.
In addition, SAP BTP facilitates seamless connectivity through a range of connectors and APIs integrated within the SAP Integration Suite. Enabling a harmonious integration of data and processes across diverse systems and applications, whether they are on-premise or cloud-based.
Process Automation and Workflow Management
Efficient process automation and workflow management play a pivotal role in enhancing treasury operations. SAP BTP offers an efficient solution named SAP Build Process Automation which enables users to design and oversee business processes using either low-code or no-code methods. It combines workflow management, robotic process automation, decision management, process visibility, and AI capabilities, all consolidated within a user-friendly interface.
A significant advantage of SAP BTP's workflow approach over conventional SAP workflows is the unification of workflows across diverse systems, including non-SAP systems and increased flexibility, enabling smoother interaction between processes and systems.
The integration of SAP BTP for workflow with different SAP modules such as TRM, IHC, BAM is facilitated through the SAP Workflow Management APIs within your SAP S/4 HANA system.
In the context of treasury functions, SAP Build Process Automation proves invaluable for automating and refining diverse processes such as cash management, risk management, liquidity planning, payment processing, and reporting. For instance, users can leverage the integrated AI functionalities for tasks like collecting bank statements/account balance information from different systems, consolidating information, saving and/or distributing the cash position information to the appropriate people and systems. Furthermore, the automation recorder can be employed to mechanize the extraction and input of data from diverse systems. Finally, the SAP Build Process Automation can also be utilized to create workflows for complex payment approval scenarios, including exceptions and escalations.
Extensions to the Treasury Ecosystem
SAP BTP extends the treasury ecosystem with multiple treasury-specific developed solutions, seamlessly enhancing your treasury SAP S/4 HANA system functionality. These extensions include: Multi-Bank Connectivity for simplified and secure banking interactions, SAP Digital Payment Add-On for efficiently connecting to payment service providers. Trading Platform Integration for streamlined financial instrument trading, SAP Cloud for Credit Integration to assess business partner credit risk, SAP Taulia for Working Capital Management, Cash Application for automatic bank statement processing and cash application, and lastly, SAP Market Rates Management for the reliable retrieving of market data.
Empowering organizations with extensive treasury needs by enabling them to selectively adopt these value-added capabilities and solutions offered by SAP.
Alternatives to SAP BTP
The primary driving factor to consider integrating SAP BTP as an addon to your SAP ERP is when there is an integrated company-wide approach towards adopting BTP. Furthermore, if the standard SAP functionalities fall short of meeting the specific demands of the treasury department, or if the need for seamless integration with other systems arises.
It's important to prioritize the optimization of complex processes whenever feasible first, avoiding the pitfall of optimizing inherently flawed processes using advanced technologies such as SAP BTP. It is worth noting that the standard SAP functionality, which is already substantial, could very well suffice. Consequently, we recommend conducting an analysis of your processes first, utilizing the Zanders best practices process taxonomy, before deciding on possible technology solutions.
Ultimately, while considering technology options, it's wise to explore offerings from best-of-breed treasury solution providers as well – keeping in mind the potential need for integration with SAP.
Getting Started
The above highlights just a glimpse of SAP BTP's capabilities. SAP offers a free trial that allows users to explore its services. Instead of starting from scratch, you can leverage predefined business content such as intelligent RPA bots, workflow packages, predefined decision and business rules and over 170 open connectors with third-party products to get inspired. Some examples relevant for treasury include integration with Trading Brokers, S4HANA SAP Analytics Cloud, workflows designed for managing free-form payments and credit memos, as well as connectors linking to various accounting systems such as Netsuite Finance, Microsoft Dynamics, and Sage.
Conclusion
SAP BTP for Treasury is a powerful platform that can significantly enhance treasury. Its advanced analytics, app development and integration, and process automation capabilities enable organizations to gain valuable insights, automate tasks, and improve overall efficiency. If you are looking to revolutionize your treasury operations, SAP BTP is a compelling option to consider.
How to connect with local banks in Japan?
September 2023
5 min read
Author:
Michal Zelazko
Share:
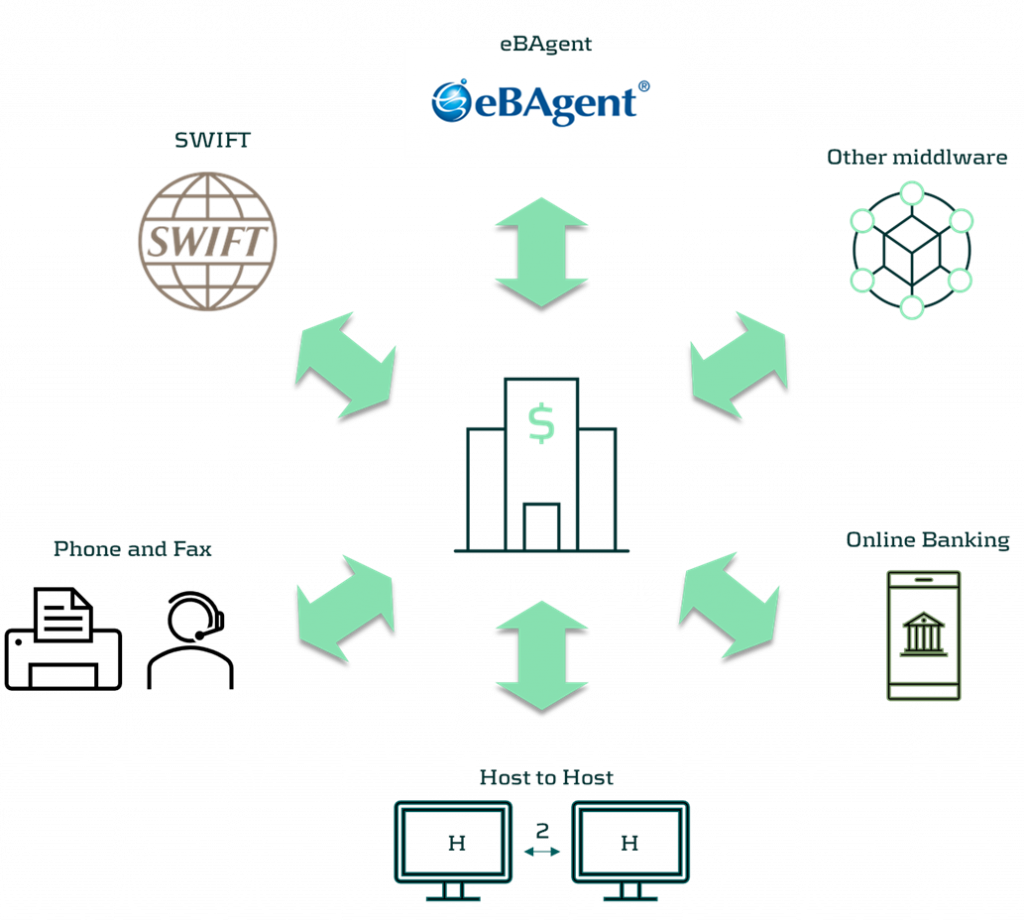
Seamless and automated connectivity between a Treasury Management System (TMS) and banks has always been an arduous task to accomplish.
Treasurers dealing with multiple jurisdictions, scattered banking landscape, and local requirements face many challenges in this regard. Japan is one of the markets where bank connectivity is indeed a challenge, especially when it comes to connecting with local banks.
Traditional options
The initial reaction from treasurers not familiar with local market conventions might be to seek connection through the SWIFT network. However, in Japan only a handful of banks offer SWIFT connectivity. Second natural choice is the Host-to-Host connection (H2H). This is the classic File Transfer Protocol (FTP), or preferably the secured version (sFTP) setup. Some will say old fashioned, rather than classic, since it is as old as the internet. Nonetheless, it is still popular, and frankly quite often the best fit for the purpose. However, if there are dozens of local banks to connect to, it can be difficult to be expected to connect to each of them with a direct H2H. While this could be technically feasible, it would be nothing short of a nightmare to maintain, with the initial setup being time-consuming in the first place.
Other solutions
There is an answer, or should we rather say ANSER, to this question. ANSER, an abbreviation of ‘Automatic answer Network System for Electrical Request’, is a data transfer system provided by NTT Data Corporation since 1981, which links banks with firms.[1] ANSER then is a way to connect a corporate client to the bank. The system has been around for a while, and together with Cash Management Service (CMS) centers it is a part of the so-called Firm Banking solution in Japan. Since its inception, ANSER offered a wider range of services, through which corporates could access their banking information. Among the offered channels are telephone, fax, firm banking terminal, and personal computer. With the ever-increasing need for speedy and accurate information exchange, the more traditional ways, such as telephone and fax, gave way to the more sophisticated and automated solution, namely eBAgent.
eBAgent making use of API
The said eBAgent is a proprietary middleware platform offered by NTT Data. The solution establishes an automated connection with banks through the above-mentioned ANSER network. In short, eBAgent offers a gateway to multiple local banking partners in Japan utilizing the ANSER network. The remaining part for the corporate is then to establish a connection between the TMS and eBAgent, and secure appropriate contracts with the eBAgent provider, NTT Data, as well as the banks.
As for the connection protocol, the choice is between the classic sFTP, or Application Programming Interface (API). The latter has the real-time advantage, with less lag between the pick-and-drop sFTP connection. API seems to be a choice for an increasing number of corporates these days in this area. What is also interesting, apart from the API connection, are the supported formats for transfers and bank statements. In addition to the local Japanese ZENGIN, the protocol also offers data transmission in a proprietary XML format. This XML format is actually quite simple, with a very limited amount of tags. In addition to this, unlike the ISO 20022 standard, it contains only one level of tags, without the nesting function. Depending on the exact ERP/TMS infrastructure, eBAgent can also provide conversion services from and to the IS 20022 standard. As for the connection to eBAgent, the whole setup seems easier said than done. However, some TMS providers, in response to the demand from the market, started offering off-the-shelf solutions for a plug-and-play connection to eBAgent. Kyriba and Reval already offer it, with SAP set to roll out its solution on the S/4HANA and Multi Bank Connectivity (MBC) platform in early 2024.
Various ways to connect TMS / ERP with banks in Japan
How to connect with local banks in Japan?
It all depends on the exact landscape of banks and systems. It may just as well turn out that a hybrid solution would be best suited. There is no one-size fits all, as each corporate is unique, thus careful consideration and design will be paramount for a stable and reliable connection with banks. One thing is certain, solutions that involve obtaining bank statement information and enact payments by telephone or fax are simply no longer sufficient. In this day and age, when much sensitive information is exchanged between corporates and banks, having a reliable, automated solution is indispensable.
If you would like to know more, do not hesitate to get in touch with Michal Zelazko via [email protected] or via + 81 (0) 8 3255 9966
This paper explores vital infrastructure decisions, regulatory scrutiny, and proposes a flexible risk approach for financial institutions in crypto asset navigation by 2025.
Seventy banks have been considered, which is an increase of twenty banks compared to the previous exercise. The portfolios of the participating banks contain around three quarters of all EU banking assets (Euro and non-Euro).
Interested in how the four Dutch banks participating in this EBA stress test exercise performed? In this short note we compare them with the EU average as represented in the results published [1].
General comments
The general conclusion from the EU wide stress test results is that EU banks seem sufficiently capitalized. We quote the main 5 points as highlighted in the EBA press release [1]:
The results of the 2023 EU-wide stress test show that European banks remain resilient under an adverse scenario which combines a severe EU and global recession, increasing interest rates and higher credit spreads.
This resilience of EU banks partly reflects a solid capital position at the start of the exercise, with an average fully-loaded CET1 ratio of 15% which allows banks to withstand the capital depletion under the adverse scenario.
The capital depletion under the adverse stress test scenario is 459 bps, resulting in a fully loaded CET1 ratio at the end of the scenario of 10.4%. Higher earnings and better asset quality at the beginning of the 2023 both help moderate capital depletion under the adverse scenario.
Despite combined losses of EUR 496bn, EU banks remain sufficiently apitalized to continue to support the economy also in times of severe stress.
The high current level of macroeconomic uncertainty shows however the importance of remaining vigilant and that both supervisors and banks should be prepared for a possible worsening of economic conditions.
For further details we refer to the full EBA report [1].
Dutch banks
Making the case for transparency across the banking sector, the EBA has released a detailed breakdown of relevant figures for each individual bank. We use some of this data to gain further insight into the performance of the main Dutch banks versus the EU average.
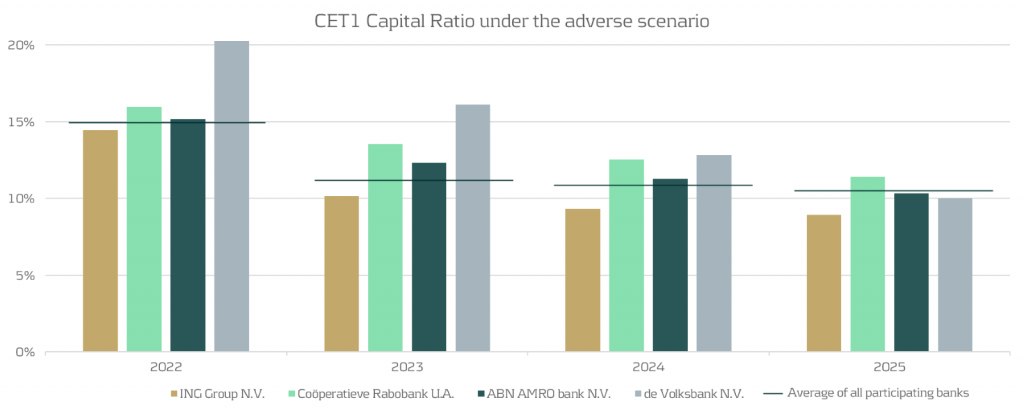
CET1 ratios
Using the data presented by EBA [2], we display the evolution of the fully loaded CET1 ratio for the four banks versus the average over all EU banks in the figure below. The four Dutch banks are: ING, Rabobank, ABN AMRO and de Volksbank, ordered by size.
From the figure, we observe the following:
Compared to the average EU-wide CET1 ratio (indicated by the horizontal lines in the graph above), it can be observed that three out of four of the banks are very close to the EU average.
For the average EU wide CET1 ratio we observe a significant drop from year 1 to year 2, while for the Dutch banks the impact of the stress is more spread out over the full scenario horizon.
The impact after year 4 of the stress horizon is more severe than the EU average for three out of four of the Dutch banks.
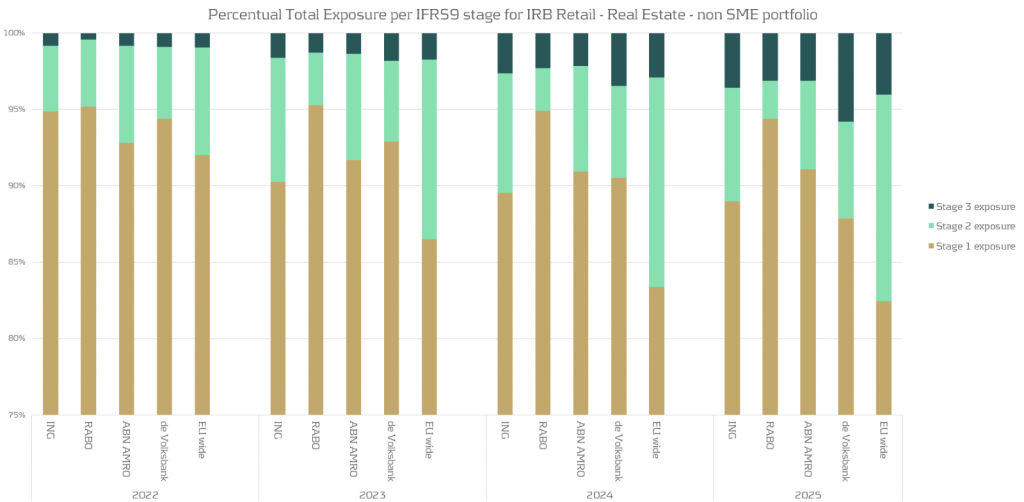
Evolution of retail mortgages during adverse scenario
The most important product the four Dutch banks have in common are the retail mortgages. We look at the evolution of the retail mortgage portfolios of the Dutch banks compared to the EU average. Using EBA data provided [2], we summarize this in the following chart:
Based on the analysis above , we observe:
There is a noticeable variation between the banks regarding the migrations between the IFRS stages.
Compared to the EU average there are much less mortgages with a significant increase in credit risk (migrations to IFRS stage 2) for the Dutch banks. For some banks the percentage of loans in stage 2 is stable or even decreases.
Conclusion
This short note gives some indication of specifics of the 2023 EBA stress applied to the four main Dutch banks.
Should you wish to go deeper into this subject, Zanders has both the expertise and track record to assist financial organisations with all aspects of stress testing. Please get in touch.
Zanders listed on Swift Customer Security Programme (CSP) Assessment Providers directory
July 2023
3 min read
Author:
Oliver Trist
Share:
We are excited to announce that Zanders has been listed on the Swift Customer Security Programme (CSP) Assessment Providers directory*.
The CSP helps reinforce the controls protecting participants from cyberattack and ensures their effectivity and that they adhere to the current Swift security requirements.
*Swift does not certify, warrant, endorse or recommend any service provider listed in its directory and Swift customers are not required to use providers listed in the directory.
Swift Customer Security Programme
A new attestation must be submitted at least once a year between July and December, and also any time a change in architecture or compliance status occurs. Customer attestation and independent assessment of the CSCF v2023 version is now open and valid until 31 December 2023. July 2023 also marks the release of Swifts CSCF v2024 for early consultation, which is valid until 31 December 2024.
Swift introduced the Customer Security Programme to promote cybersecurity amongst its customers with the core component of the CSP being the Customer Security Controls Framework (CSCF). Independent assessment has been introduced as a prerequisite for attestation to enhance the integrity, consistency, and accuracy of attestations. Each year, Swift releases an updated version of the CSCF that needs to be attested to with support of an independent assessment.
The Attestation is a declaration of compliance with the Swift Customer Security Controls Policy and is submitted via the Swift KYC-SA tool. Dependent on the Swift Architecture used, the number of controls to be implemented vary; of which certain are mandatory, and others advisory.
Further details on the Swift CSCF can be found on their website:
Do you have arrangements in place to complete the independent assessment required to support the attestation?
Zanders has experience with and can support the completion of an independent external assessment of your compliance to the Swift Customer Security Control Framework that can then be used to fully complete and sign-off the Swift attestation for this year.
With an extensive track record of designing and deploying bank integrations, our intricate knowledge of treasury systems across both IT architecture as well as business processes positions us well to be a trusted independent assessor. We draw on past projects and assessments to ask the right questions during the assessment phase, aligning our customers with the framework provided by Swift.
The Swift attestation can also form part of a wider initiative to further optimise your banking landscape, whether that be increasing the use of Swift within your organisation, bank rationalization or improving your existing processes. The availability of your published attestation and its possible consultation with counterparties (upon request) helps equally in performing day-to-day risk management.
Approach
Planning
We start with rigorous planning of the assessment project, developing a scope of work and planning resources accordingly. Our team of experts will work with clients to formulate an Impact Assessment based on the most recent version of the Swift Customer Security Controls Framework.
Architecture Classification
A key part of our support will be working with the client to formulate a comprehensive overview of the system architecture and identify the applicable controls dictated by the CSCF.
Perform Assessment
Using our wide-ranging experience, we will test the individual controls against specific scenarios designed to root out any weaknesses and document evidence of their compliance or where they can be improved.
Independent Assessment Report
Based on the evidence collected, we will prepare an Independent Assessment report which includes status of the compliance against individual controls, baselining them against the CSCF and recommendations for improvement areas within the system architecture.
Post Assessment Activities
Once completed, the Independent Assessment report will support you with the submission of the Attestation in line with the requirements of the CSCF version in force, which is required annually by Swift. In tandem, Zanders can deliver a plan for implementation of the recommendations within the report to ensure compliance with current and future years’ attestations. Swift expects controls compliance annually, together with the submission of the attestation by 31 December at the latest, in order to avoid being reported to your supervisor. Non-compliant status is visible to your counterparties.
Do you need support with your Swift CSP Independent Assessment?
We are thrilled to offer a Swift CSP Independent Assessment service and look forward to supporting our clients with their attestations, continuing their commitment to protecting the integrity of the Swift network, and in doing so supporting their businesses too. If you are interested in learning more about our services, please contact us directly below.
Get performance now
Contact me
You are currently viewing a placeholder content from HubSpot. To access the actual content, click the button below. Please note that doing so will share data with third-party providers.
Cryptocurrencies and Blockchain: Navigating Risk, Compliance, and Future Opportunities in Corporate Treasury
June 2023
8 min read
Authors:
Robert Richter, Justus Schleicher
Share:
This paper explores vital infrastructure decisions, regulatory scrutiny, and proposes a flexible risk approach for financial institutions in crypto asset navigation by 2025.
As a result of the growing importance of this transformative technology and its applications, various regulatory initiatives and frameworks have emerged, such as Markets in Crypto-Assets Regulation (MiCAR), the Distributed Ledger Technology (DLT) Pilot Regime, and the Basel Committee on Banking Supervision (BCBS) crypto standard were launched, demonstrating the growing importance and adoption at both a global and national level. Given these trends, treasuries will be impacted by Blockchain one way or the other – if they aren’t already.
With the advent of cryptocurrencies and digital assets, it is important for treasurers to understand the issues at hand and have a strategy in place to deal with them. Based on our experience, typical questions that a treasurer faces are how to deal with the volatility of cryptocurrencies, how cryptocurrencies impact FX management, the accounting treatment for cryptocurrencies as well as KYC considerations. These developments are summarized in this article.
FX Risk Management and Volatility
History has shown that cryptocurrencies such as Bitcoin and Ether are highly volatile assets, which implies that the Euro value of 1 BTC can fluctuate significantly. Based on our experience, treasurers opt to sell their cryptocurrencies as quickly as possible in order to convert them into fiat currency – the currencies that they are familiar and which their cost basis is typically in. However, other solutions exist such as hedging positions via derivatives traded on regulated financial markets or conversions into so-called stablecoins1.
Accounting Treatment and Regulatory Compliance
Cryptocurrencies, including stablecoins, require careful accounting treatment and compliance with regulations. In most cases cryptocurrencies are classified as “intangible assets” under IFRS. For broker-traders they are, however, classified as inventory, depending on the circumstances. Inventory is measured at the lower of cost and net realizable value, while intangible assets are measured at cost or revaluation. Under GAAP, most cryptocurrencies are treated as indefinite-lived intangible assets and are impaired when the fair value falls below the carrying value. These impairments cannot be reversed. CBDCs, however, are not considered cryptocurrencies. Similarly, and the classification of stablecoins depends on their status as financial assets or instruments.
KYC/KYT Considerations
The adoption of cryptocurrencies and Blockchain technology introduces challenges for corporate treasurers in verifying counterparties and tracking transactions. When it comes to B2C transactions, treasurers may need to implement KYC (Know Your Customer) processes to verify the age and identity of individuals, ensuring compliance with age restrictions and preventing under-aged purchases, among other regulatory requirements. Whilst the process differs for B2B (business-to-business) transactions, the need for KYC exists nevertheless. However in the B2B space, the KYC process is less likely to be made more complex by transactions done in cryptocurrencies, since the parties involved are typically well-established companies or organizations with known identities and reputations.
Central Bank Digital Currencies
(CBDCs) are emerging as potential alternatives to privately issued stablecoins and other cryptocurrencies. Central banks, including the European Central Bank and the Peoples Banks of China, are actively exploring the development of CBDCs. These currencies, backed by central banks, introduce a new dimension to the financial landscape and will be another arrow in the quiver of end-customers – along with cash, credit and debit cards or PayPal. Corporate treasurers must prepare for the potential implications and opportunities that CBDCs may bring, such as changes in payment options, governance processes, and working capital management.
Adapting to the Future
Corporate treasurers should proactively prepare for the impact of cryptocurrencies and Blockchain technology on their business operations. This includes educating themselves on the basics of cryptocurrencies, stablecoins, and CBDCs, and investigating how these assets can be integrated into their treasury functions. Understanding the infrastructure, processes, and potential hedging strategies is crucial for treasurers to make informed decisions regarding their balance sheets. Furthermore, treasurers must evaluate the impact of new payment options on working capital and adjust their strategies accordingly.
Zanders understands the importance of keeping up with emerging technologies and trends, which is why we offer a comprehensive range of Blockchain services. Our Blockchain offering covers supporting our clients in developing their Blockchain strategy including developing proofs of concept, cryptocurrency integration into Corporate Treasury, support on vendor selection as well as regulatory advice. For decades Zanders has helped corporate treasurers navigate the choppy seas of change and disruption. We are ready to support you during this new era of disruption, so reach out to us today.
Meet the team
Zanders already has a well-positioned, diversified Blockchain team in place, consisting of Blockchain developers, Blockchain experts and business experts in their respective fields. In the following you will find a brief introduction of our lead Blockchain consultants.
Grip on your EVE SOT
May 2023
8 min read
Author:
Erik Vijlbrief
Share:
This paper explores vital infrastructure decisions, regulatory scrutiny, and proposes a flexible risk approach for financial institutions in crypto asset navigation by 2025.
Over the past decades, banks significantly increased their efforts to implement adequate frameworks for managing interest rate risk in the banking book (IRRBB). These efforts typically focus on defining an IRRBB strategy and a corresponding Risk Appetite Statement (RAS), translating this into policies and procedures, defining the how of the selected risk metrics, and designing the required (behavioral) models. Aspects like data quality, governance and risk reporting are (further) improved to facilitate effective management of IRRBB.
Main causes of volatility in SOT outcomes
The severely changed market circumstances evidence that, despite all efforts, the impact on the IRRBB framework could not be fully foreseen. The challenge of certain banks to comply with one of the key regulatory metrics defined in the context of IRRBB, the SOT on EVE, illustrates this. Indeed, even if regularities are assumed, there are still several key model choices that turn out to materialize in today’s interest rate environment:
Interest rate dependency in behavioral models: Behavioral models, in particular when these include interest rate-dependent relationships, typically exhibit a large amount of convexity. In some cases, convexity can be (significantly) overstated due to particular modeling choices, in turn contributing to a violation of the EVE SOT criterium. Some (small and mid-sized) banks, for example, apply the so-called ‘scenario multipliers’ and/or ‘scalar multipliers’ defined within the BCBS-standardized framework for incorporating interest rate-dependent relationships in their behavioral models. These multipliers assume a linear relationship between the modeled variable (e.g., prepayment rate) and the scenario, whereas in practice this relationship is not always linear. In other cases, the calibration approach of certain behavioral models is based on interest rates that have been decreasing for 10 to 15 years, and therefore may not be capable to handle a scenario in which a severe upward shock is added to a significantly increased base case yield curve.
Level and shape of the yield curve: Related to the previous point, some behavioral models are based on the steepness (defined as the difference between a ‘long tenor’ rate and a ‘short tenor’ rate) of the yield curve. As can be seen in Figure 1, the steepness changed significantly over the past two years, potentially leading to a high impact associated with the behavioral models that are based on it. Further, as illustrated in Figure 2, the yield curve has flattened over time and recently even turned into an inverse yield curve. When calculating the respective forward rates that define the steepness within a particular behavioral model, the downward trend of this variable that results due to the inverse yield curve potentially aggravates this effect.
Figure 1: Development of 3M EURIBOR rate and 10Y swap rate (vs. 3M EURIBOR) and the corresponding 'Steepness'
Figure 2: Development of the yield curve over the period December 2021 to March 2023.
Hidden vulnerability to ‘down’ scenarios: Previously, the interest rates were relatively close to, or even below, the EBA floor that is imposed on the SOT. Consequently, the ‘at-risk’ figures corresponding to scenarios in which (part of) the yield curve is shocked downward, were relatively small. Now that interest rates have moved away from the EBA floor, hidden vulnerability to ‘down’ scenarios become visible and likely the dominating scenario for the SOT on EVE.
Including ‘margin’ cashflows: Some banks determine their SOT on EVE including the margin cashflows (i.e., the spread added to the swap rate), while discounting at risk-free rates. While this approach is regulatory compliant, the inclusion of margin cashflows leads to higher (shocked) EVE values, and potentially leads to, or at least contributes to, a violation of the EVE threshold.
What can banks do?
Having identified the above issues, the question arises as to what measures banks should consider. Roughly speaking, two categories of actions can be distinguished. The first category encompasses actions that resolve an inadequate reflection of the actual risk. Examples of such actions include:
Identify and re-solve unintended effects in behavioral models: As mentioned above, behavioral models are key to determine appropriate EVE SOT figures. Next to revisiting the calibration approach, which typically is based on historical data, banks should assess to what extent there are unintended effects present in their behavioral models that adversely impact convexity and lead to unrepresentative sensitivities and unreliably shocked EVE values.
Adopt a pure IRR approach: An obvious candidate action for banks that still include margins in their cashflows used for the EVE SOT, is to adopt a pure interest rate risk view. In other words, align the cashflows with its discounting. This requires an adequate approach to remove the margin components from the interest cashflows.
The second category of actions addresses the actual, i.e., economic, risk position of bank. One could think of the following aspects that contribute to steering the EVE SOT within regulatory thresholds:
Evaluate target mismatch: As we wrote in our article ‘What can banks do to address the challenges posed by rising interest rates’, a bank’s EVE is most likely negatively affected by the rise in rates. The impact is dependent on the duration of equity taken by the bank: the higher the equity duration, the larger the decline in EVE when rates rise (and hence a higher EVE risk). In light of the challenges described above, a bank should consider re-evaluating the target mismatch (i.e. the duration of equity).
Consider swaptions as an additional hedge instrument: Convexity, in essence, cannot be hedged with plain vanilla swaps. Therefore, several banks have entered into ‘far out of the money’ swaptions to manage negative convexity in the SOT on EVE. From a business perspective, these swaptions result in additional, but accepted costs and P&L volatility. In case of an upward-sloping yield curve, the costs can be partly offset since the bank can increase its linear risk position (increase duration), without exceeding the EVE SOT threshold. This being said, swaptions can be considered a complex instrument that presents certain challenges. First, it requires valuation models – and expertise on these models – to be embedded within the organization. Second, setting up a heuristic that adequately matches the sensitivities of the swaptions to those of the commercial products (e.g., mortgages) is not a straightforward task.
How can Zanders support?
Zanders is thought leader in supporting banks with IRRBB-related topics. We enable banks to achieve both regulatory compliance and strategic risk goals, by offering support from strategy to implementation. This includes risk identification, formulating a risk strategy, setting up an IRRBB governance and framework, policy or risk appetite statements. Moreover, we have an extensive track record in IRRBB and behavioral models, hedging strategies, and calculating risk metrics, both from a model development as well as a model validation perspective.
Are you interested in IRRBB related topics? Contact Jaap Karelse, Erik Vijlbrief (Netherlands, Belgium and Nordic countries) or Martijn Wycisk (DACH region) for more information.
Partnering with Nationaal Warmtefonds: from niche fund to becoming a key pillar in the national energy transition
Since its launch just over a decade ago, Nationaal Warmtefonds has grown from a niche financing platform to a driving force in promoting residential energy efficiency across the Netherlands. Over the last five years, our partnership has deepened and developed, with Zanders reshaping its support to adapt to every operational challenge and growth stage.
Nationaal Warmtefonds was established in 2013 as an experimental fund backed by the Dutch government to help homeowners make their houses more energy efficient. Today, it's a key player in the Netherlands’ climate ambitions, granting over 1.8 billion euro of loans and helping more than 130.000 households make their homes more sustainable.
From cautious beginnings
In the early stages, Nationaal Warmtefonds-backed loans were only offered to homeowners who could afford traditional credit. But in 2015, the Paris Agreement was signed, setting new international climate targets and raising action on energy efficiency to a national priority. This sparked a rapid extension of the fund’s mandate. Notably, the decision was made to expand from financially stable owners to provide access to funding to households with lower incomes. This led to a surge in the scale and impact of the fund.
“Initially the fund grew steadily – in the first year we financed €5 million,” says Ernst Jan Boers, Chairman of Nationaal Warmtefonds. “But within five years, we were doing €150 million a year and it became clear we had to reshape ourselves. The fund was expected to double in size and to support this growth, we needed more than just a loan administrator – we needed the full second and third lines.”
As Nationaal Warmtefonds’ objectives became more ambitious, so did the need for specialist risk management, compliance, and treasury functions. These were services beyond the capabilities of the organization and its existing administrative providers. So, five years ago, the fund set out to find an advisor that could support their growth strategy. This led them to Zanders.
“In the early stages, it was about managing the funds with boots on the ground,” says Ernst Jan.
Zanders offered treasury knowledge, but they were also willing to do the day-to-day work – and the same applied for compliance and risk. We needed a role that we called ‘fund director’ and Zanders filled that position.
Ernst Jan Boers, Chairman of Nationaal Warmtefonds
Tasked with managing the fund, coordinating with other service providers, and supporting the board, the Zanders team was quickly embedded into day-to-day operations, providing advice and hands-on support across risk, compliance, and treasury. And as the fund rapidly grew to over €400 million a year, Zanders’ role also expanded as it helped the fund navigate growth and the challenges it presented.
Navigating the challenges of fund expansion
A strengthening moment in the partnership came with the near collapse of a large, multi-million-euro eco-renovation of an apartment building, involving more than 180 homeowners. When the construction firm went bankrupt mid-way through the build, the future of the project plunged into uncertainty. Zanders played an important role in enabling the project to proceed – mediating between homeowners, authorities, and internal credit committees, while also designing a financial restructuring plan. With this hands-on, credit management, Zanders helped Nationaal Warmtefonds not only rescue the project (it was ultimately completed to almost zero-emission standards) but also reshape future governance and credit approval processes to reduce risk going forward.
Large, high-stakes projects like this highlighted how fast the fund was evolving and how far its role had expanded beyond its original scope.
“We started with a lifetime from 3 to 6 years for the fund,” Ernst Jan reflects. “But if you look at the scale of the transition and how embedded we’ve become in the national climate effort, we’ll likely be doing this work through to 2050.”
The impact of this growth is that the somewhat short-term nature of Nationaal Warmtefonds’ operational structure was no longer sufficient to manage the growing complexity and scale of its role.
“About a two years ago, things were moving so fast and we realized it was time to become a real organization,” admits Ernst Jan. “Up until that point, we had a board of just four people, each working only one or two days a week. Everything was outsourced – risk, finance, and loan administration. We had good controls, but no one on payroll, and not even a physical office. We were becoming too big for that model and, more importantly, we realized we’re not temporary – we’re actually here to stay.”
At this point Nationaal Warmtefonds decided to insource key service providers, and at the same time, the board transitioned from a part-time structure to working three to four days a week.
“As part of this shift, the role of fund director was no longer needed in the same way,” says Ernst Jan.
Zanders continues to support us – especially in areas like risk, compliance, and treasury – but the nature of the support has changed again. It's now more advisory and less operational, because we’ve built the internal structure to handle much of it ourselves.
Ernst Jan Boers, Chairman of Nationaal Warmtefonds
This marks a new, more consultancy-driven era for our partnership, where Zanders empowers Nationaal Warmtefonds with the expertise, guidance and strategic support to continue to grow the fund and proactively manage risk.
Flexible foundations for the future
From providing hands-on crisis management during complex projects to shifting towards a more advisory role as internal capacity grew, Zanders’ support for Nationaal Warmtefonds has evolved in line with the fund’s growth and changing needs. This flexibility has been crucial in navigating the challenges of rapidly scaling the fund as climate action has climbed the national agenda.
Looking to the future, as the energy transition deepens and new challenges arise, our partnership will keep adapting, continually re-balancing operational support with strategic advice to ensure Nationaal Warmtefonds is positioned to respond effectively and continue to drive forward the energy transition in the Netherlands.
To find out more about how we can support the growth strategy of your business and fund, please contact Eva de Lange.
In the high-stakes world of private equity, where the pressure to deliver exceptional returns is relentless, the playbook is evolving. Gone are the days when financial engineering—relying
Zanders Transfer Pricing Suite is an innovative, cloud-based solution designed for companies looking to automate the Transfer Pricing compliance of financial transactions. With over five years
This paper offers a straightforward analysis of the Basel Committee on Banking Supervision's standards on crypto asset exposures and their adoption by 2025. It critically assesses
In recent years, consumers’ and investors’ interest in sustainability has been growing. Since 2015, assets under management in ESG funds have nearly tripled, the outstanding value of
In this report, biodiversity loss ranks as the fourth most pressing concern after climate change adaptation, mitigation failure, and natural disasters. For financial institutions (FIs), it
Carbon offset processes are currently dominated by private actors providing legitimacy for the market. The two largest of these, Verra and Gold Standard, provide auditing services, carbon
Early October, the Basel Committee on Banking Supervision (BCBS) published a report[1] on the 2023 banking turmoil that involved the failure of several US banks as well as Credit Suisse. The
The SAP Business Technology Platform (BTP) is not just a standalone product or a conventional module within SAP's suite of ERP systems; rather, it serves as a strategic platform from SAP,
Treasurers dealing with multiple jurisdictions, scattered banking landscape, and local requirements face many challenges in this regard. Japan is one of the markets where bank connectivity
Seventy banks have been considered, which is an increase of twenty banks compared to the previous exercise. The portfolios of the participating banks contain around three quarters of all EU
The CSP helps reinforce the controls protecting participants from cyberattack and ensures their effectivity and that they adhere to the current Swift security requirements.
*Swift does not
As a result of the growing importance of this transformative technology and its applications, various regulatory initiatives and frameworks have emerged, such as Markets in Crypto-Assets
Over the past decades, banks significantly increased their efforts to implement adequate frameworks for managing interest rate risk in the banking book (IRRBB). These efforts typically focus
Nationaal Warmtefonds was established in 2013 as an experimental fund backed by the Dutch government to help homeowners make their houses more energy efficient. Today, it's a key player in the
As the European Union increasingly emphasizes robust digital resilience within the financial sector as of January 17th 2025, the Digital Operational Resilience Act (DORA) has become a critical
Managing banking book risk remains a critical challenge in today’s financial markets and regulatory environment. There are many strategic decisions to be made and banks are having trouble
On July 2nd, the European Banking Authority (EBA) published a Consultation Paper proposing amendments to its 2016 Guidelines on the application of the definition of default (DoD). As part of the
Artificial intelligence (AI) is advancing rapidly, particularly with the emergence of large language models (LLMs) such as Generative Pre-trained Transformers (GPTs). Yet, in quantitative risk
The games market just keeps getting bigger. And with limits on this growth seemingly uncharted, interest from governments and private sector investors is at an all-time high. Savvy Games Group
In an industry where growth is often measured in multiples, and value creation is expected to be both scalable and repeatable, operational excellence is no longer a supporting function—it’s
With extreme weather events becoming more frequent and climate policy tightening across jurisdictions, banks are under increasing pressure to understand how climate change will impact their
With the introduction of CRR3, effective from January 1, 2025, the ‘extra’ guarantee on Dutch mortgages – known as the Dutch National Mortgage Guarantee (NHG) – will no longer be
According to the IFRS 9 standards, financial institutions are required to model probability of default (PD) using a Point-in-Time (PiT) measurement approach — a reflection of present
Inflows from open reverse repos
In May 2024 the EBA stated1 that inflows from open reverse repos cannot be recognised in LCR calculations unless the call option has already been
This article is intended for finance, risk, and compliance professionals with business and system integration knowledge of SAP, but also includes contextual guidance for broader audiences.
1.
Our team at Zanders has been at the forefront of implementing BACS AUDDIS (Automated Direct Debit Instruction Service) with SAP S/4HANA, helping clients to streamline their direct debit
Thailand's e-Withholding Tax (e-WHT) system officially launched on October 27, 2020, in collaboration with 11 banks, marking a significant digital transformation with far-reaching benefits for
In today’s rapidly evolving financial landscape, fortifying the Financial Risk Management (FRM) function remains a top priority for CFOs. Zanders has identified a growing trend among
Emergence of Artificial Intelligence and Machine Learning
The rise of ChatGPT has brought generative artificial intelligence (GenAI) into the mainstream, accelerating adoption across
Introduction
In December 2024, FINMA published a new circular on nature-related financial (NRF) risks. Our main take-aways:
NRF risks not only comprise climate-related risks,
As mid-sized corporations expand, enhancing their Treasury function becomes essential. International growth, exposure to multiple currencies, evolving regulatory requirements, and increased
Industry surveys show that FRTB may lead to a 60% increase in regulatory market risk capital requirements, placing significant pressure on banks. As regulatory market risk capital requirements
First, these regions were analyzed independently such that common trends and differences could be noted within. These results were aggregated for each region such that these regions could be
Is Your Bank DORA-Compliant? Key Insights from the Digital Operational Resilience Study
July 2025
3 min read
Author:
Martin Ruf
Share:
Assessing bank readiness for DORA compliance: the key insights from a comprehensive survey
As the European Union increasingly emphasizes robust digital resilience within the financial sector as of January 17th 2025, the Digital Operational Resilience Act (DORA) has become a critical benchmark for compliance. A recent survey conducted with 23 banks reveals insightful data on their preparedness across various DORA categories. This blog dives into the findings and assess how well banks are positioned in meeting these regulatory standards.
General Requirements: Solid Foundations, Communication Gaps
The survey indicates strong compliance with foundational DORA requirements. Almost all banks have designated management functions for digital operational resilience and documented strategies. However, notable gaps exist in communicating these strategies effectively—as highlighted by the sizable number of banks without comprehensive stakeholder communication plans (12 “yes” vs. 11 “no” responses). Additionally, less than half the respondents have formal ICT risk appetite statements approved by senior management, leaving potential gaps in aligning risk management with organizational tolerance levels.
ICT Risk Management: Comprehensive Yet Evolving
Banks demonstrate proficiency in risk management frameworks with most having formal processes for risk identification and documentation. However, only about half systematically manage emerging and innovative technology risks—a critical aspect in today's evolving digital landscape. Equally concerning is the relative lack of focus on interconnectedness and concentration risks, with only 12 banks integrating these considerations into their risk assessments.
ICT Resilience Testing: Gap Between Basic and Advanced Practices
While regular ICT resilience testing is generally practiced, the adoption of advanced testing methodologies, such as threat-led penetration testing, is limited among the institutes that are required to perform these tests. Variability also exists in the processes for escalating issues and validating results, signifying areas requiring further attention.
The survey reveals that while vigilance exists in maintaining third-party risk management frameworks, there are significant concerns regarding the strength of contractual safeguards and incident management processes. Less than half the banks have robust exit strategies or cater to geopolitical risks—a critical oversight in managing potential external disruptions.
Incident Reporting: Strong Foundations with Room for Procedural Enhancement
The incident reporting results indicate well-established bases in documentation and reporting processes. However, training in incident reporting procedures remains less uniform, which could impact consistency in handling real incidents.
Business Continuity and Disaster Recovery: Recurring Gaps in Comprehensive Coverage
While the majority of banks report having BCDRPs in place, only 16 ensure comprehensive coverage of all critical business functions. Testing and updating these plans is similarly underwhelming, staying mostly stagnant, which could hinder timely recovery efforts in case of an outage.
IT-Security: Solid Security Postures with Continuous Improvement Needed
Encouragingly, all respondents have documented ICT security policies, and most banks have appropriate security controls in place. While programs for regular updates in policies and controls are broadly adhered to, continuous improvement through employee training and periodic evaluations of security measures remains essential.
Beyond the Checklist: Embedding True Resilience into Operations
This survey highlights that while the foundations for DORA compliance are well-established within the banking sector, several areas still require strategic enhancements. Bridging communication gaps, enhancing advanced testing, improving third-party engagements, and boosting procedural training will be key to transitioning from foundational compliance to comprehensive resilience.
These study insights serve to underscore not only the importance of regulatory adherence but also the critical need for continuous evaluation and proactive adaptation of digital resilience strategies amidst ever-evolving digital challenges. As banks continue this journey, the collective focus should remain on creating a more adaptive, secure, and resilient digital future.
To find out more about DORA compliance and meeting regulatory standards, please contact our partner Martin Ruf.
Achieving ALM excellence through bank treasury frameworks
July 2025
7 min read
Authors:
Jelle Thijssen, Zeph van den Bergh
Share:
With increasing regulatory expectations and evolving market dynamics, a well-structured ALM framework is essential for effective banking book risk management.
Managing banking book risk remains a critical challenge in today’s financial markets and regulatory environment. There are many strategic decisions to be made and banks are having trouble applying homogeneous hedging approaches across their balance sheet. As shown in the EBA’s IRRBB implementation heatmap of last February, hedging strategies and NMD modelling practices still vary significantly between banks. In addition, the EBA expects future developments on CSRBB and DRM. Meanwhile, behavioral risks and rapidly changing interest regimes need to be addressed, while balancing the stability of net interest income and economic value.
Treasury departments are at the heart of managing the banking book, with their ‘ALM framework’ serving as the essential blueprint for banking book management. This framework ensures alignment between risk appetite and business objectives. A well-developed ALM framework provides better insights and enhances understanding of the balance between risk and performance.
But, what are the characteristics of a mature ALM framework? What steps can be taken to elevate the maturity of the framework? And how can your framework unlock your full potential? This article explores the components that make up an effective ALM framework and describes what an advanced setup looks like. After inspecting ALM governance, risk frameworks, hedging strategies, ALM modeling and capital & performance management, we offer the opportunity to benchmark the maturity of your own framework against other banks and the ideal setup by filling out this survey.
Governance
The cornerstone of any effective ALM framework is appropriate governance, much like any well-functioning business activity. Setting up strong governance begins with defining a charter with a clear scope and mandate for the departments involved. It is crucial that the first and second line of defense have accurately defined roles and pro-active knowledge sharing needs to be the standard. Oversight by senior management is essential across all activities within the framework and the Asset-Liability Committee (ALCO) should be composed of members from treasury, risk and the business.
Figure 1: Distribution of roles and responsibilities of the first and second line, based on a survey performed by Zanders.
Another critical element of ALM governance is the ALM strategy and the associated policies. The ALM strategy covers how risk and return are balanced, what interest rate position is ideal and how risks are operationally hedged (granularity, frequency and instruments). Typically, banks operate most effectively when the strategy is owned by the treasury department. The strategy should integrate perspectives on interest rate risk, credit spread risk, (intraday) liquidity risk, FX risk and capital, and must be fully aligned with business objectives and overall risk appetite.
The second line should manage the translation of the strategy into comprehensive risk policies covering the same risk types and ensuring alignment with both global and local regulatory frameworks. As part of the overarching policy framework, a risk identification process must highlight emerging risk and feed into the Risk Appetite Setting (RAS). In turn, the RAS needs to define KPIs for guiding daily risk management, specifying the boundaries within which the first line can balance risk and return.
Risk Framework
Beyond sound governance, risk policies are integral to the broader risk framework. Within this framework, it is crucial to make informed decisions on measuring and hedging each individual risk type. Ideally, all risk types are managed within a central ALM system that supports risk dashboarding and stress testing.
Figure 2: Risk- scope for a selection of sub-risk types, based on a survey performed by Zanders.
In addition to identifying relevant risks and determining appropriate responses, it is essential to establish an internal operational framework for ongoing management. Centralizing and netting risks in central treasury books is fundamental to an efficient treasury function. While several approaches exist, internal transactions are typically preferred, as they enable accurate measurement of risks over different commercial and/or geographical portfolios.
The strategy for managing interest rate risk in the banking book should ultimately be reflected in a clearly defined target duration of equity. Segregating the structural position into a dedicated book facilitates precise monitoring and agile adjustments to market dynamics and regulatory changes. Market volatility may necessitate revisiting the target based on interest rate expectations, and many banks have been adjusting their target durations accordingly. The structural position is a critical strategic choice in the trade-off between earnings and value stability, and is thereby an essential factor in the hedge strategy.
Hedge Strategy
With the risk framework, the treasury strategy, and risk appetite statement as its foundation, a strategy for hedging must be defined. This strategy guides first line processes, stating clear objectives on both earnings and value stability. Striking a balance between these two elements is challenging, but forms the basis for optimizing the balance sheet. The decision to include or exclude margins should be consistent across cashflows and discounting and should be aligned with the primary hedging focus, whether it is stabilizing earnings or value.
Figure 3: Focus of hedging strategies, based on a survey performed by Zanders.
The scope of the hedging strategy must be consistent with the risk scope outlined in the risk framework and encompass the entire balance sheet. The strategy needs to address linear risks, and also explicitly account for non-linear risks that may arise due to convexity or behavioral factors.
While commercial books typically have the objective to stabilize or increase net margins without taking an active position, hedging must be an active steering process. The treasury function should focus on optimizing the economic value of equity and net interest income within defined target limits. It is essential for the hedging process to be dynamic, using real-time analytics to proactively identify opportunities for improvement as market conditions and expectations change. Banks need to make use of scenario planning and predictive modeling to anticipate hedge requirements and adapt accordingly.
Modeling
Hedging practices are based on the outcomes of a bank’s models, which should reflect reality as close as possible. A challenging yet essential aspect to modeling is addressing the optionalities inherent to many financial products. These embedded optionalities need to be modeled consistently for all assets and all liabilities. Ideally, banks have advanced interest rate-dependent behavioral models in place to model the interest rate sensitivity of deposits and loans. Pipeline risk, the migration between different deposit types and potential other behavioral characteristics of products also need to be modelled. These models provide banks with realistic insights into expected cashflows. As customer behavior can vary significantly under different market conditions, banks benefit greatly from simulating and analyzing these changes using stochastic models.
Figure 4: Type of behavioral modeling performed by banks, based on a survey performed by Zanders.
From a liquidity perspective, it is important for banks to use consistent methodologies for short and long-term cashflow forecasting. Additionally, integrating liquidity models, such as those for LCR and NSFR, with liquidity stress testing, offers valuable insights into potential future liquidity needs.
Machine learning is gaining more and more traction within the field of ALM and is becoming an integral part of ALM modeling. Using machine learning for client segmentation is increasingly more common and helps in better understanding client behavior. Several machine learning techniques for (reverse) stress testing have been developed, which improve the ability to identify vulnerabilities in balance sheets. Furthermore, predictive analytics helps to optimize balance sheet management, empowering banks to make informed strategic decisions.
Capital and Performance
Final critical elements of strategically steering a bank are the management of capital and performance measurement. Capital management is a fundamental part of modern-day banking and one of the important factors in balance sheet management. Mishandling capital requirements can significantly impact competitiveness and distort the view of risk-adjusted performance. To manage capital effectively, banks need to identify the ex-ante cost of capital for each transaction and incorporate it into pricing. Capital requirements should be allocated at the transaction level, allowing for accurate calculation of capital usage per portfolio. Ongoing capital monitoring and alignment to stress testing exercises and risk appetite is essential for optimal capital allocation and planning.
An effective Funds Transfer Pricing (FTP) framework is essential to assess risk-adjusted performance at the transaction level and to allocate overall performance across business units. In a mature FTP framework, all products are priced using an internally determined FTP curve. At a minimum, this curve needs to reflect the interest rate and liquidity risks inherent to transactions, but it can be extended to incorporate other types of risk. The FTP curve must be dynamic, adapting to portfolios and market conditions. Moreover, the FTP curve should be governed by senior management, who adjust it as needed to steer the balance sheet through (dis)incentivizing specific products or maturities.
Figure 5: Usage and granularity of FTP frameworks, based on a survey performed by Zanders.
Conclusion
The key to successfully managing banking book risks is an effective ALM framework. By leveraging your ALM framework and ensuring it aligns with the bank’s overall strategy, business objectives and complexity, you can enhance treasury’s performance and effectively manage the increased regulatory attention to IRRBB strategies.
At Zanders, we developed a model to assess the maturity level of a bank’s ALM framework. The model provides valuable insights into the maturity of the individual components and the ALM framework as a whole. This facilitates quick and straightforward benchmarking.
We invite you to complete the survey below and participate in the benchmarking exercise, which should take you less than 10 minutes. We will analyze your answers and share the (anonymized) findings with you.
The EBA is proposing key changes to its definition of default guidelines, with implications for credit risk practices.
On July 2nd, the European Banking Authority (EBA) published a Consultation Paper proposing amendments to its 2016 Guidelines on the application of the definition of default (DoD). As part of the consultation process, open until 15 October 2025, the credit risk specialists at Zanders will submit a formal response, leveraging our extensive experience in DoD regulation and implementation.
In this article, we share our perspective on three of the EBA’s proposed amendments, focusing on the potential impact and implementation challenges for institutions:
We expect that a shorter probation period for forbearance measures (that only alter the repayment schedule leading to a NPV loss not greater than 5%) are expected to provide incentives for banks to opt for those types of measures rather than the most sustainable ones.
We recommend the EBA to implement EU wide DoD guidelines they considered for payment moratoria (similar to the one for Covid), whereas the EBA proposes not to. Zanders would approve permanent moratoria guidelines, as it clarifies if governmental moratoria introduced for climate risk related natural disasters should be regarded as forbearance.
We are oncerned that the proposal to consider material arrears on non-recourse factoring exposures up to 90 (instead of 30) DPD as technical past due situations could result in an undesired increase in the percentage of IFRS stage 1 exposures migrating directly to stage 3 (impairment).
The following chapters elaborate on these three proposed amendments in more detail.
Forbearance
The first amendments addressed in the EBA’s consultation paper (CP) are related to forbearance. The supervisory authority explains that an increase of 1% threshold for a diminished financial obligation (DFO) to 5% was considered for certain forbearance measures. This follows from the European Commission’s mandate that the update of the EBA guidelines on DoD“… shall take due account of the necessity to encourage institutions to engage in proactive, preventive and meaningful debt restructuring to support obligors.”1
In the EBA’s current DoD guidelines (DoD GL), a forbearance measure leading to a 1% or more DFO results in a default classification, which could discourage institutions from applying these measures. However, the CP purposefully proposes to exclude an increase to a 5% DFO threshold, since institutions can already implement strict(er) forbearance definitions (i.e. for concession, financial difficulty) to prevent undue default classifications. Instead, the EBA proposes to shorten the probation period from 12 to 3 months for forbearance measures that: (1) only lead to suspensions or postponements and not e.g. changes to the interest rate or exposure amounts and (2) leading to less than 5% DFO loss.
This treatment will likely incentivize institutions to choose forbearance measures in scope of the shorter probation period, rather than the ones that would be optimal for a “sustainable performing repayment status” of the obligor. The latter would be in line with the EBA’s own requirements on the management of forborne exposures (Par. 125 EBA/GL/2018/06). Furthermore, the fact that the EBA does not set the “predefined limited period of time” for the measures in scope could lead to RWA variability, as some institutions may apply the shorter probation period to longer duration forbearance measures than others. For example, if Bank A sets the limited period of time to 6 months, they can apply the shorter probation period more often compared to Bank B, which sets the period of time at 3 months. Finally, it appears as if the proposal of the banking authority aims at favouring granting forbearance measures in scope to obligors with short-term (rather than structural) financial difficulties. That is, the EBA explains that the forbearance measures in scope of the shorter probation period treatment “… would most likely be viable for obligors in temporary financial difficulties”. The shorter probation period would then lead to a return to a performing status earlier for obligors to which the forbearance measures in scope are extended, which leads to a better RWA for these obligors. Alternatively, a distinct probation period (or even higher DFO threshold) could be proposed for obligors in short-term financial difficulties, as defined in Paragraph 129(A) of the EBA’s guidelines on Management of Forborne Exposures. This would also achieve the EBA’s goal, without influencing institutions’ decision about which forbearance measure to apply.
It should be mentioned that while a large RWA impact is not anticipated from the establishment of a distinct probation period, there will likely be a significant implementation burden associated with the change. This is because, as multiple forbearance measures are usually adopted in tandem, different probation periods must be traced concurrently. The implementation of this modification would need to be retroactive, though, as credit risk models will need to be recalculated using adjusted historical data in order to account for this change. In the past, retroactively modifying the probationary period has proven to be a time-consuming and expensive problem.
Legislative payment moratoria
In light of the COVID-19 crisis, the EBA published guidelines in 2020 on handling payment moratoria introduced by governments as a means of financial aid in the context of forbearance. For certain COVID-19 measures allowing e.g. a grace period in scope of the guidelines, EBA/GL/2020/02 and amendments in .../08 and …/15, would not in itself require institutions to classify the exposures as forborne.
Even though the EBA considered introducing guidelines for potential future moratoria, the CP proposes against these changes. As one of the arguments against new moratoria guidelines, the EBA remarks that moratoria in itself will not result in DFO loss of more than 1%, hence not leading to defaults. The EBA implies that introducing new moratoria guidelines would therefore be obsolete. The EBA is also worried about RWA variability that might arise if governments declare legislative moratoria for crises in their jurisdictions. That is, the EBA expects that intra-EU comparability of RWA across institutions, might be compromised.
Adding the considered guidelines describing when moratoria should lead to forbearance in the amended DoD GL is advisable, even though the EBA proposes in the CP to remove them. Zanders challenges that guidelines describing when moratoria do not lead to forbearance would not be necessary, because the 1% DFO threshold will not be met. That is, Zanders highlights moratoria guidelines would still decide when the forborne status should be assigned to exposures if moratoria are applied. This forborne status impacts the default status later on, both for performing and defaulted exposures. The reason is that if performing forborne exposures become 30 days past due within 24 months after receiving the forborne status, a defaulted status should be assigned. If the moratoria do not lead to a forborne status, these exposures should default after becoming 90 days past due on a material amount instead. Furthermore, for defaulted exposures, it is important to understand when moratoria result in the forborne status and when they do not. That is, in order for a forborne defaulted exposure to go out of default, a substantial payment and an extended cure period are needed. Zanders would therefore be in favor of EBA guidelines that specify when moratoria should result in a forborne status and when this is not necessary.
As for the RWA variability, as self-identified by the EBA, stringent criteria could be introduced prescribing what moratoria are in scope of the amended DoD GL. As described by the EBA as well, in light of climate risk related natural disasters, payment moratoria could occur more often as a governmental means of financial aid. In contrast to ad hoc rules for each specific crisis, such as observed during the COVID-19 pandemic, Zanders contends that permanently applicable moratoria instructions in the updated DoD GL will eventually lead to a more stable RWA impact when economic or natural catastrophes occur.
Days past due for non-recourse factoring
Paragraph 23(D) of the current version of the DoD guideline stipulates that in the specific situation of non-recourse factoring for which the arrears materiality threshold is breached, but none of the receivables is more than 30 days past due (DPD), should be treated as a technical past due situation. Non-recourse factoring refers to the situation where the institution (e.g. a bank) has bought receivables from its client (e.g. service provider) owed by the debtor (e.g. service consumer). The idea behind the 30 DPD is that the DPD counter might continue to increase due to a consecutive overlap in non-payments of invoices, lengthy administrative processes, and a low degree of control of the institution over the invoices.
The CP proposes to allow for up to 90 DPD to be considered technical past due situations, in correspondence to the industry requesting the EBA to be more lenient in the DoD guidelines for non-recourse factoring. This is motivated by the fact that many corporates have at least one invoice past due more than 30 days, while being rated investment grade.
Although Zanders understands corporates’ need for more leniency, allowing for up to 90 DPD to be recognized as technical past due could make stage 2 obsolete for IFRS provisioning models. That is, if material arrears on non-recourse factoring exposures should be considered technical past due for situations up to 90 DPD, the said exposures will move from 0 DPD to 91 DPD in one day. The additional lenience would break the desired flow of exposures transitioning from IFRS stage 1 (performing), first towards stage 2 (significant increase in credit risk), before going to stage 3 (credit impaired). This stage migration effect could be mitigated by another stage 2 trigger: forbearance. However, the institution cannot apply forbearance measures to a sold invoice that is due to the institution’s client, rather than due to the institution itself. Therefore, as a stage 2 trigger, forbearance cannot compensate for the lack of the30 DPD in the particular scenario of non-recourse factoring risks.
Zanders proposes to find a balance between leniency on DoD guidelines and stage migrations, by increasing the 30 days threshold. The proposed number of days should be based on an analysis of non-recourse factoring portfolios from a representative sample of supervised institutions. This analysis should then strike a balance between the average observed days past due of invoices sold on the one hand and the representativeness of IFRS stage transitions on the other hand. Zanders is convinced that amending DoD GL based on this analysis will prevent the undesired impact on IFRS provisioning models and will better fit European corporate invoicing practice.
Conclusion
In this post we analysed 3 proposed amendments from the published Consultation Paper, in which the European Banking Authority (EBA) proposes amendments to its 2016 Guidelines on the application of the definition of default (DoD). Alternatives are suggested for all 3 proposed amendments as the proposed amendments leave room for improvements .
Reach out to our expertsJohn de Kroon and Dick de Heus, if you are interested in getting a better understanding of what the proposed amendments mean for your credit risk portfolio.
Article 178(7) CRR as amended by Regulation (EU) 2024/1623 (CRR3). ↩︎
Expanding the Utility of AI in Risk Management with AI Agents
July 2025
5 min read
Authors:
Stanley Nwanekezie, Hardial Kalsi
Share:
Discover how AI agents are transforming risk management by making advanced analytics more accessible, efficient, and intelligent.
Artificial intelligence (AI) is advancing rapidly, particularly with the emergence of large language models (LLMs) such as Generative Pre-trained Transformers (GPTs). Yet, in quantitative risk management, the perceived utility of these technologies remains relatively narrow. Most current applications focus on technical use cases, such as code autocompletion within Integrated Development Environments (IDEs), to boost productivity for developers and quantitative analysts. While valuable, these uses only hint at AI’s broader potential. Limiting AI to technically knowledgeable users overlooks opportunities to empower a wider range of stakeholders, including those without programming skills.
In this article, we explore AI agent frameworks, highlight their potential to enhance various banking functions, and share our thoughts on key design considerations when using agents in risk-sensitive environments.
What exactly are AI agents?
While the definition of an AI agent may vary depending on the specific use case, they are generally characterised by a high degree of autonomy and a goal-oriented design. A recurring theme in the development of these systems is their ability to operate independently across entire analytical workflows. This marks a shift in how AI is utilised - transforming models from passive tools or advanced search engines into active, decision-making agents capable of driving end-to-end processes.
In the context of risk management, these workflows might include executing models, validating outputs, conducting ongoing monitoring and review, running sensitivity analyses or stress tests, and generating model performance reports. Interestingly, these actions can all be initiated by a simple trigger, often in the form of a natural language prompt - a method that has become increasingly familiar. Unlike conventional systems designed for single tasks, agents are built to reason, decide, and act across multiple steps, adapting to requirements with flexibility.
A typical agent architecture consists of five core components:
1- Interface Layer / Trigger: Translates business-level questions (e.g., “What’s the impact of a 25% increase of default probability on risk-weighted assets?”) into executable workflows, enabling non-technical users to trigger complex analyses.
2- Input and Data Processing: Preprocesses and transforms input data or outputs from other checkpoints into structured data that can be used in the agent’s decision-making process.
3- Memory & Context Manager: Maintains a record of prior steps, decisions, and user inputs to guide multi-stage processes intelligently and retain context over series of interactions.
4- Tool Integrator: Connects to and uses various tools (such as Python environments, databases, APIs, and model libraries) to perform technical tasks. The agent dynamically works out which tool is relevant for executing specific tasks based on predefined instructions.
5- Large Language Model (LLM): Determines the sequence of actions needed to achieve a specific goal, e.g. “Backtest this IRB model under a recession scenario”. In this example, the LLM would identify actual periods spanning a receding economy and uses the corresponding data to execute the model and return the results.
This architecture allows AI agents to operate like digital collaborators, fetching and processing data, visualising results, and helping to explain patterns that we may otherwise miss - all without requiring users to interact with a single line of code.
Benefits of AI Agents Across Different Banking Functions
Beyond improving information access, AI agents deliver strategic benefits through automation, broader access to analytical tools, faster decision-making, and the removal of process bottlenecks. Here’s how agentic solutions support various stakeholders:
Front Office (Trading, Structuring, Portfolio Management): Enhance front-office functions including pre-trade analysis, data acquisition and processing, continuous market monitoring, and rapid trade execution. By integrating structured and unstructured data, ranging from market sentiment to fundamental and technical indicators, the agents allow trading and investment professionals to make faster, more informed decisions that are grounded in a holistic view of market conditions.
Risk Modelling and Analytics Teams: Aid modelers to accelerate prototyping and calibration by offloading repetitive tasks such as parameter sweeps, benchmarking, or sensitivity runs. Agents can also assist with documentation and help iterate on design logic more efficiently, freeing up time for more complex problem solving.
Model Risk Management (MRM): Streamline model validation through automation and a system designed to enhance efficiency and reliability. The system can independently replicate results from model execution, generate challenger models, and document testing steps, offering a transparent and auditable workflow that strengthens governance and reduces approval timelines.
Risk Control and Regulatory Reporting: Automate aspects of stress testing and capital reporting for control functions. By having the ability to recalculate model results under different model assumptions, maintaining traceable logic, and generating consistent documentation, the agents help ensure model results align with regulatory standards.
Ensuring Trust and Quality with AI Agent Solutions: Oversight, Governance, and Guardrails
As promising as AI agents are, their deployment in risk-sensitive environments must be accompanied by robust controls. Key design considerations include:
Security: Solutions are restricted to rely only on credible and approved AI models or models that have demonstrated high safety for institutional use. All other components are designed in Python, eliminating risks that may be posed from third-party systems and processes.
Data Governance: Agents only access approved, secure data sources, with permissions and version control strictly enforced. Where privacy is critical, data anonymisation or summarisation techniques can be applied.
Explainability: Transparency is ensured through well-defined workflows, step-by-step process documentation, and audit trails to help stakeholders understand how decisions are made.
Scope Boundaries: Agents operate within clearly defined limits (e.g., executing but not creating new models). A human-in-the-loop approach is used for material-risk decisions, while lower-risk processes may be fully autonomous.
Validation: Like any model, agents undergo rigorous testing for accuracy, consistency, and robustness, especially in edge cases. By applying the traditional “three lines of defense” model to AI agents, oversight and accountability is embedded into their lifecycle.
Conclusion
AI agents offer enormous potential to drive automation and expand access to analytical tools, especially for non-technical stakeholders. This facilitates deeper integration of business and regulatory expertise into processes across trading, reporting, and model development. When built with strong governance, robust data controls, and transparent logic, AI agents don’t just support critical workflows, they improve them.
At Zanders, we support clients in understanding how AI agents can benefit their risk management frameworks to unlock operational efficiency and expand access to advanced analytics. For more information on how Zanders can help you to utilize the power of AI agents, contact Dilbagh Kalsi (Partner) or Stanley Nwanekezie (Manager).
Smarter cash management unlocks a powerful growth lever for Savvy Games Group
In a fast-paced gaming and esports market, optimizing cash management was critical to empowering Savvy Games with the financial clarity and agility to surge forward with its ambitious investment strategy.
The games market just keeps getting bigger. And with limits on this growth seemingly uncharted, interest from governments and private sector investors is at an all-time high. Savvy Games Group is a global gaming and esports business, wholly owned by Saudi Arabia’s Public Investment Fund (PIF). Tasked with transforming the Kingdom of Saudi Arabia (KSA) into a global games hub, the Riyadh-based group is pursuing an ambitious investment strategy aimed to rapidly accelerate growth of the sector and maximize the opportunities the Kingdom offers.
Acquisition-driven growth
Savvy is clear in its intention to be the leading force in global games investment. At first glance, this could appear a bold claim for a three-year-old company operating in one of the world’s most buoyant and exciting markets. But it’s a challenge Savvy has already proven it’s well-equipped to deliver. Despite being a relative newcomer to the games sector, through high-profile acquisitions—including Scopely in the US and EFG Group in Europe and the US—Savvy has quickly established itself as an active investor. This has led to fast growth for the business. In just a few years, the Group has expanded to become a global enterprise of more than 3,500 employees across 69 locations in 22 countries.
While the scale and speed of Savvy’s development successfully solidified its reputation and investor profile, it also created a disparate banking and cash management structure. With the Group’s cashflows spanning a global network of more than 40 banks and 400 bank accounts, cash management was cumbersome and inefficient.
A rapid bank rationalization
With centralization as the clear goal, the starting point was to consolidate Savvy’s banking services and implement an inhouse bank in order to harmonize disparate cash management processes. To enable this, in June 2024, Savvy issued a request for proposal (RfP) for the provision of banking services to the Savvy Group.
“After a competitive RfP, we chose Citibank for our global cash management and HSBC for our cash management in the US and in Saudi Arabia,” Saleh Alfadhel, Savvy’s Group CFO, recounts. “We then had to go from 40 banks and 400 bank accounts to two banks and 50 bank accounts in one year.” This was a complex project, involving the establishment of three cash pools—a multi-currency notional pool in London, a US dollar and Saudi Arabian Riyal (SAR) pool in KSA, and a virtual US Dollar pool in the US. But this was only one part of establishing the Group’s treasury function. While bank rationalization and cash pooling created the foundations for a more streamlined and centralized treasury organization, to extract maximum value from this new structure, they also needed full visibility of the group’s cash balances and positions worldwide. This is where a second RfP came in—the selection and implementation of a global treasury management system (TMS).
From selection to solution
Driving Savvy’s treasury technology project was the target to have a new, global TMS for the Group in place by December 2024.
By leveraging Zanders’ technical expertise of Kyriba and deep treasury experience, we successfully developed and implemented best-in-class processes across cash management, payment processing, and in-house banking. Harnessing Kyriba’s functionality, we streamlined and automated our treasury operations for greater efficiency and control.
Dheeraj Parmar (Assistant Treasurer at Savvy Games Group)
With Zanders leading the technical conversations with the vendors, Savvy was able to explore and compare the different solutions on offer in a highly structured, relevant, and informed way. This ensured the selection of a TMS that was the best-fit to deliver high levels of transparency and central control of cash management. The outcome was the selection of Kyriba and the appointment of Zanders to advise on the implementation of the first five modules. The deadline set for completing this was December 2024.
“Between June and December, Zanders implemented five modules of Kyriba,” Saleh says. “In six months, we had a full implementation of Kyriba across our operating companies, the headquarters in KSA, and the three inhouse banks.”
Between June and December 2024, Zanders implemented five modules of Kyriba. In six months, we had a full implementation of Kyriba across our operating companies, the headquarters in KSA, and the three inhouse banks.
Saleh Alfadhel (CFO at Savvy Games Group)
With clarity comes cash control
Savvy’s Kyriba journey may still be in its early stages but the value of the visibility it gives them over their cash position globally is already evident. “As of December 2024, we have a liquidity pool set up, and we have a dashboard in Kyriba showing us 100% of our in-scope balances,” Saleh says. “We estimate that by having full visibility and cash concentration, we can operate the Savvy Games Group with circa 45% less cash globally.”
And there is still more value-driving performance for Savvy to unlock from operating a centralized, digital treasury. Kyriba cloud-based treasury management solutions offer a powerful way for businesses to connect banks, ERPs, apps, and portals. This unifies data, providing not only the clarity and insight to improve liquidity, but also the opportunity to automate processes and improve efficiency. Unlocking this enhanced performance is where Zanders’ work with the group turns to next. “Once we add host-to-host, straight through processing and a shared service center to Kyriba, we should have full automation between our ERPs—SAP in Germany and Oracle in KSA and the US,” Saleh says. “With this, we will be able to automate accounts payable and the treasury department completely.”
Continuing our transformation journey in collaboration with Zanders will allow us to further optimize our treasury operating model while ensuring scalability to support the company’s growth—both organically and through strategic M&A actions.
Dheeraj Parmar (Assistant Treasurer at Savvy Games Group)
In the high-stakes world of private equity, where the pressure to deliver exceptional returns is relentless, the playbook is evolving. Gone are the days when financial engineering—relying
Zanders Transfer Pricing Suite is an innovative, cloud-based solution designed for companies looking to automate the Transfer Pricing compliance of financial transactions. With over five years
This paper offers a straightforward analysis of the Basel Committee on Banking Supervision's standards on crypto asset exposures and their adoption by 2025. It critically assesses
In recent years, consumers’ and investors’ interest in sustainability has been growing. Since 2015, assets under management in ESG funds have nearly tripled, the outstanding value of
In this report, biodiversity loss ranks as the fourth most pressing concern after climate change adaptation, mitigation failure, and natural disasters. For financial institutions (FIs), it
Carbon offset processes are currently dominated by private actors providing legitimacy for the market. The two largest of these, Verra and Gold Standard, provide auditing services, carbon
Early October, the Basel Committee on Banking Supervision (BCBS) published a report[1] on the 2023 banking turmoil that involved the failure of several US banks as well as Credit Suisse. The
The SAP Business Technology Platform (BTP) is not just a standalone product or a conventional module within SAP's suite of ERP systems; rather, it serves as a strategic platform from SAP,
Treasurers dealing with multiple jurisdictions, scattered banking landscape, and local requirements face many challenges in this regard. Japan is one of the markets where bank connectivity
Seventy banks have been considered, which is an increase of twenty banks compared to the previous exercise. The portfolios of the participating banks contain around three quarters of all EU
The CSP helps reinforce the controls protecting participants from cyberattack and ensures their effectivity and that they adhere to the current Swift security requirements.
*Swift does not
As a result of the growing importance of this transformative technology and its applications, various regulatory initiatives and frameworks have emerged, such as Markets in Crypto-Assets
Over the past decades, banks significantly increased their efforts to implement adequate frameworks for managing interest rate risk in the banking book (IRRBB). These efforts typically focus
Nationaal Warmtefonds was established in 2013 as an experimental fund backed by the Dutch government to help homeowners make their houses more energy efficient. Today, it's a key player in the
As the European Union increasingly emphasizes robust digital resilience within the financial sector as of January 17th 2025, the Digital Operational Resilience Act (DORA) has become a critical
Managing banking book risk remains a critical challenge in today’s financial markets and regulatory environment. There are many strategic decisions to be made and banks are having trouble
On July 2nd, the European Banking Authority (EBA) published a Consultation Paper proposing amendments to its 2016 Guidelines on the application of the definition of default (DoD). As part of the
Artificial intelligence (AI) is advancing rapidly, particularly with the emergence of large language models (LLMs) such as Generative Pre-trained Transformers (GPTs). Yet, in quantitative risk
The games market just keeps getting bigger. And with limits on this growth seemingly uncharted, interest from governments and private sector investors is at an all-time high. Savvy Games Group
In an industry where growth is often measured in multiples, and value creation is expected to be both scalable and repeatable, operational excellence is no longer a supporting function—it’s
With extreme weather events becoming more frequent and climate policy tightening across jurisdictions, banks are under increasing pressure to understand how climate change will impact their
With the introduction of CRR3, effective from January 1, 2025, the ‘extra’ guarantee on Dutch mortgages – known as the Dutch National Mortgage Guarantee (NHG) – will no longer be
According to the IFRS 9 standards, financial institutions are required to model probability of default (PD) using a Point-in-Time (PiT) measurement approach — a reflection of present
Inflows from open reverse repos
In May 2024 the EBA stated1 that inflows from open reverse repos cannot be recognised in LCR calculations unless the call option has already been
This article is intended for finance, risk, and compliance professionals with business and system integration knowledge of SAP, but also includes contextual guidance for broader audiences.
1.
Our team at Zanders has been at the forefront of implementing BACS AUDDIS (Automated Direct Debit Instruction Service) with SAP S/4HANA, helping clients to streamline their direct debit
Thailand's e-Withholding Tax (e-WHT) system officially launched on October 27, 2020, in collaboration with 11 banks, marking a significant digital transformation with far-reaching benefits for
In today’s rapidly evolving financial landscape, fortifying the Financial Risk Management (FRM) function remains a top priority for CFOs. Zanders has identified a growing trend among
Emergence of Artificial Intelligence and Machine Learning
The rise of ChatGPT has brought generative artificial intelligence (GenAI) into the mainstream, accelerating adoption across
Introduction
In December 2024, FINMA published a new circular on nature-related financial (NRF) risks. Our main take-aways:
NRF risks not only comprise climate-related risks,
As mid-sized corporations expand, enhancing their Treasury function becomes essential. International growth, exposure to multiple currencies, evolving regulatory requirements, and increased
Industry surveys show that FRTB may lead to a 60% increase in regulatory market risk capital requirements, placing significant pressure on banks. As regulatory market risk capital requirements
First, these regions were analyzed independently such that common trends and differences could be noted within. These results were aggregated for each region such that these regions could be
Cash Agility: The Underrated Power Lever in Private Equity Value Creation
July 2025
7 min read
Author:
Lou Gueroeva
Share:
Cash agility plays an increasingly important role in how private equity firms manage growth, risk, and execution.
In an industry where growth is often measured in multiples, and value creation is expected to be both scalable and repeatable, operational excellence is no longer a supporting function—it’s a strategic enabler. Yet one of the most fundamental enablers of value creation remains underdeveloped across many private equity-backed businesses: the financial value chain.
This system—spanning everything from working capital and liquidity to payments, banking, and treasury technology—often determines whether a company can scale without friction, execute M&A efficiently, or respond to volatility with speed. And at the heart of that system lies a single objective: cash agility.
Why Cash Agility Matters in PE
Private equity firms have long emphasized growth acceleration, M&A, and operational leverage as core value drivers. These remain powerful levers—but they are increasingly vulnerable to delays, integration challenges, and market-driven volatility. What’s less volatile, and arguably more repeatable, is a firm’s ability to control and redeploy its own capital faster.
Cash agility describes the capability to mobilize internal liquidity—whether to seize investment opportunities, fund strategic initiatives, or manage downside risks—without unnecessary friction or reliance on external capital. It represents the intersection of visibility, control, and speed across the financial value chain.
In this sense, cash agility is about creating an institutional capability to convert operational execution into strategic flexibility.
The Financial Value Chain: A Missed Opportunity
In many portfolio companies, the financial value chain is fragmented. Processes have evolved piecemeal, often in response to tactical needs rather than strategic planning. Treasury sits apart from commercial functions. Working capital is optimized through isolated projects. Systems don’t talk to each other. Spreadsheets fill the gaps between data, decision, and executionAs a result, CFOs and PE sponsors alike struggle with basic questions:
How much cash is available across the group today? Where is it trapped? Can it be upstreamed, invested, or deployed without delay?
In our recent project with a mid-market portfolio company, the finance team had to manually consolidate bank balances from over 200 accounts across 30 entities to produce a weekly liquidity report—consuming hours of effort and often resulting in outdated insight. The company had been growing fast through M&A, but its cash visibility had not kept pace. This created real constraints when the group needed to move quickly on a bolt-on acquisition, forcing reliance on external bridge financing and delaying execution by weeks.
This scenario is common across mid-sized and even large PE-backed businesses. And while every firm understands the importance of “cash control,” few have turned that awareness into a repeatable capability.
From Fragmentation to Agility: What Good Looks Like
Building cash agility starts with aligning the components of the financial value chain into a cohesive, strategically designed operating model. This typically includes:
Real-time cash visibility across all entities and currencies, ideally enabled through TMS/ERP integration and automated bank feeds.
Forecasting processes linked to operational and commercial drivers, integrated with actual cash positions—offering a forward-looking, actionable view of liquidity rather than a static snapshot.
Banking architecture designed for mobility over rigidity—supporting automated sweeps, intercompany lending, and minimal account fragmentation.
Payment processes embedded with control but freed from manual bottlenecks—using centralized workflows, audit trails, and fraud prevention tools.
Capex and working capital governance that prioritizes ROI, liquidity impact, and execution timing over pure budget conformance.
Cash flow management as a continuous fitness program for liquidity—driving productivity, improving free cash flow, and delivering more sustainable performance than reactive working capital initiatives alone.
For PE investors, the ultimate test of these systems isn’t operational elegance. It’s whether they enable faster execution, more efficient capital deployment, and consistent delivery of the investment thesis.
Common Bottlenecks
Across Zanders’ private equity engagements, several recurring issues tend to slow progress toward cash agility:
M&A Complexity: Acquisitions bring in diverse systems, bank setups, and control environments. Without a clear treasury integration playbook, complexity compounds.
Underinvestment in Treasury: Many companies have no dedicated treasury function or treat it as a back-office necessity despite a highly positive business case. This leads to disjointed tools, lack of ownership, and reactive problem solving.
Disconnected Systems: ERP, TMS, and bank portals often operate in isolation. Without an integrated architecture, data is delayed, duplicated, or distorted.
Legacy Banking Landscapes: Companies often maintain outdated banking setups, including hundreds of rarely used accounts or manual payment processes that create risk and inefficiency.
Static Forecasting: Forecasts are built manually, reviewed infrequently, and rarely integrated into daily cash decisions.
Solving these challenges requires more than a few process tweaks. It demands a step change in how financial operations are conceived, designed, and executed.
Case in Point: When Financial Architecture Drives Value
In one engagement with a global consumer technology leader generating over $40 billion in annual revenue, Zanders helped transform an inherited web of disconnected financial operations into a single, scalable treasury architecture. The company had expanded rapidly, but its cash remained fragmented across geographies and systems. We centralized liquidity into a unified control structure, redesigned the firm’s bank strategy and FX risk setup, and implemented automated cash processes through an in-house bank.
The results were transformational. Annual costs dropped by $18 million, and over $8 billion in trapped cash was unlocked for reinvestment. Treasury operations became leaner, with over $10 million in savings achieved through rationalized account structures and reduced IT system costs. Perhaps more strategically, the business freed up $17 to $35 million in withheld taxes by migrating treasury entities—capital it could now allocate to growth, innovation, or debt reduction. What had once been an operational bottleneck became a value multiplier.
Another engagement with a multinational education group revealed the power of standardization at scale. With 80+ campuses across continents and multiple ERP systems, treasury processes were fragmented and reactive. Zanders introduced a centralized target operating model, implemented a TMS integrated with the group’s ERP infrastructure, and deployed straight-through-processing to streamline reporting and control.
As a result, the company now saves $3.8 million annually, has released $1.7 million in working capital, and accumulated a projected $14 million benefit over a five-year horizon. More importantly, it has increased cash forecasting accuracy, reduced manual workload, and enhanced operational resilience—capabilities that will serve the group across future growth cycles.
Cash Agility: A Lever for Repeatability
For private equity investors, the question isn’t whether cash agility creates value. It’s whether it creates value that’s consistent, transferable, and visible to the next buyer.
Too often, value creation initiatives focus on EBITDA expansion—growth, margin improvement, pricing, procurement. These levers are critical, but they are also cyclical, competitive, and often constrained by talent or timing.
The financial value chain offers a different type of leverage. When optimized, it unlocks value that is self-funding, recurring, and resilient. Cash agility enhances decision velocity, reduces the cost of capital, and minimizes execution risk. It also makes businesses more attractive at exit by demonstrating financial discipline, liquidity control, financial risk awareness and systems maturity.
This is especially relevant in today’s environment, where LPs and acquirers scrutinize not just the numbers, but the operating backbone behind them. Clean books and good margins are important—but increasingly, buyers want to know: Can this company manage growth? Can it scale its financial systems? Can it fund itself efficiently?
These are questions cash agility helps answer.
Where Zanders Fits In
Zanders works with both PE sponsors and portfolio companies to build this capability. Our role is to serve as an external financial operating partner—focused on aligning finance execution with investment priorities.
We combine strategic thinking with hands-on implementation, delivering projects that range from working capital diagnostics to full treasury transformations. Our clients include global PE houses, mid-market sponsors, and management teams navigating carve-outs, integrations, and digital finance initiatives.
What distinguishes our approach is the focus on outcome: measurable improvements in cash visibility, efficiency, and control—not just slideware or process maps. We work with the CFO, but we work for the investor.
Cash Agility as a Strategic Outcome
Ultimately, cash agility is not an end in itself. It’s the enabler that turns capital into capability.
It allows portfolio companies to reinvest faster, fund growth internally, and respond to uncertainty with confidence. It gives CFOs the tools they need to lead, not lag, in execution. And it helps investors translate operational improvements into multiples—by building the infrastructure of repeatability.
In a market where capital is no longer cheap, and execution risk is rising, agility is not a luxury. It’s a requirement.
Gaining Insights from Shorter Horizons: NGFS’s New Short-Term Scenarios
June 2025
8 min read
Authors:
Hardial Kalsi, Miguel Manzanares
Share:
To help banks manage climate risk over a more relevant time horizon, the NGFS has introduced scenarios focused on the next three to five years.
With extreme weather events becoming more frequent and climate policy tightening across jurisdictions, banks are under increasing pressure to understand how climate change will impact their portfolios. Previously, most climate scenario analyses have focused on long-term trajectories, stretching out to 2050 or beyond. However, these long-term analyses have often been far too abstract for day-to-day risk management.
The new NGFS short-term scenarios investigate the impact of climate risks over the next five years, offering a more practical solution. By isolating the individual impacts from physical and transition risk, and by providing better granularity at both temporal and sectoral levels, the new scenarios provide a new and valuable tool for climate risk modelling.
In this article, we explore what makes these scenarios unique, their benefits and limitations, their impact on future macroeconomic and market trends, and importantly, how banks can utilize them to fulfil regulatory requirements.
Physical and transition risks in the scenarios
The short-term scenarios capture four possible futures, each reflecting a different mix of physical and transition risks. The scenarios show how varying levels of climate policy and climate-related events could shape the economic and financial outcomes over the next 5 years. The four scenarios are summarized in the figure below.
Figure 1: The four NGFS short-term scenarios.
Key benefits and limitations of the new scenarios
The scenarios offer several benefits, including a more practical time horizon and better isolation of physical and transition risks. However, they also come with inherent limitations that should be acknowledged when being used. Below, we summarise the main benefits and limitations of the new scenarios.
Benefits
Time horizon
Although NGFS has already released several versions of their long-term scenarios, this is the first release of climate scenarios whose narratives focus on the next few years. Short-term scenarios cover time horizons that are typically more relevant for risk assessment management in banks, such as capital planning, liquidity assessments, and regulatory stress testing exercises. In addition, the uncertainty of climate and macroeconomic variables increase over longer horizons, making the short-term scenarios more dependable.
Calibrated using recent data
As with any model which has been recalibrated using the latest data, by incorporating the most recent economic conditions, market trends, and climate policy commitments, the short-term scenarios provide more reliable and accurate forecasts. This allows banks to run more credible stress tests, develop informed strategies, and leads to outputs that are more aligned with current market and policy conditions.
Isolation of physical and transition risk
Three of the four scenarios isolate only physical or transition risk, which can provide more targeted insights for climate risk assessment. By separating these risks, banks can identify the specific drivers of financial impact more accurately, whether from policy changes or climate-related events. Unlike scenarios that contain a combination of transition and physical risks, isolating only one of the risks can make the results easier to interpret and act upon.
Variation across sectors and regions
NGFS short-term outputs cover up to 15 macro-regions (e.g. EU27, Asia and North America) and up to 46 countries, which is similar to the long-term scenario results. The biggest improvement is found on the temporal granularity: while most of the variables for the long-term scenarios are provided in 5-year intervals, the short-term scenarios are mostly provided on a yearly basis.
Limitations
Still not short enough?
While the NGFS short-term scenarios aim to address near-term climate-related risks, even shorter time horizons may be necessary for accurate and practical modelling in both credit and, in particular, market risk. More granular timeframes, such as a quarterly projection interval, would support banks to rapidly react to policy changes, market reactions, or acute physical climate events, which can unfold within weeks or months and not years.
Lack of dispersion within regions or sectors
In some cases, the results show limited differentiation between sectors and regions. This can make it difficult to accurately capture sector-specific or country-specific vulnerabilities. For example, countries with significant geographical and socioeconomic differences, such as Switzerland, Iceland, and Ukraine, are grouped together under the region "Rest of Europe". Similarly, the sector "Market Services" includes a wide range of distinct industries, such as Real Estate, Telecommunications, and Waste and Water Collection.
Physical risk is still difficult to accurately model
Accurately capturing physical climate risk within a short-term horizon remains methodologically challenging. Acute events like floods or wildfires are based on the estimation of tail risks (e.g. return periods) which can be difficult to model accurately. In addition, physical risks exhibit high spatial variability. For instance, coastal areas can be more vulnerable to hurricanes than inland areas, even if they are in the same country. Therefore, aggregating scenario data on the country or regional level can potentially underestimate the risks in specific areas.
Over-simplification of policy implementation
Policy pathways in the short-term scenarios tend to assume smooth, linear implementation and immediate effectiveness. In reality, climate policies often face political, social, and economic frictions that delay or prolong their impact. Hence, these assumptions may lead to the underestimation of transition shocks, particularly where abrupt or uncoordinated policy actions could trigger market volatility.
Impact of the new scenarios on important modelling variables
To take a look at the NGFS short-term scenarios in action, we can examine the impact of the scenarios on key macroeconomic variables. Figure 2 shows the behavior of GDP and carbon price (with respect to baseline values) within Europe and Asia for all four scenarios. There are clear negative shocks which are seen in the GDP for all the scenarios. Similarly, we see a positive spike in the carbon price for both regions, however the effect in Asia is much greater than in Europe. Asia experiences a sharper percentage increase in carbon prices because it starts from a much lower baseline compared to Europe, where carbon prices are already high and policies have been in place for years. Additionally, in general, Asia is more emissions-intensive and heavily reliant on fossil fuels (particularly coal) which means more aggressive changes to carbon pricing are required to reduce emissions.
Figure 2: Top – YoY change in GDP (compared to baseline). Bottom – change in carbon price (compared to baseline).
Although the impact to variables such as macroeconomic indicators, emissions trends, and shifts in production offer essential context, they are usually only the first step in climate risk modelling. Ultimately, we are interested in how these variables translate into changes in market-based metrics, such as corporate bond spreads or PDs, which directly affect portfolio valuation. For example, for stress testing purposes, macro and sectoral outputs must be mapped onto these market-based metrics to assess potential losses and capital impacts.
Figure 3 compares the corporate bond spread adjustments for the Oil, EV Transport Equipment, and Hydroelectric sectors under the HWTP scenario. The results illustrate a shifting investor sentiment in the corporate bond market. The Oil sector experiences a significant increase in spread adjustments over the time horizon due to an increase in perceived risk and a decline in investor favorability. In contrast, the EV Transport Equipment and Hydroelectric sectors maintain negative spread adjustments, highlighting that they are viewed more favorably. Overall, these results capture a market preference for cleaner and more sustainable industries and the scenarios clearly distinguish between sectors that are carbon-intensive and those aligned with low-carbon technologies.
Figure 3: Adjustment to corporate bond spreads for the Oil, EV Transport Equipment, and Hydroelectric sectors (HWTP scenario).
Zanders’ opinion
Although the five-year horizon of the new scenarios is still somewhat too long for direct application to market risk modelling (where exposures fluctuate on much shorter timescales), it aligns far better with the lifecycle of most credit products, especially those with relatively short maturities such as personal loans. Banks should utilise the scenarios as starting points for modelling the effects of near-term climate shocks on the performance of their credit products. However, the new scenarios can still provide valuable insights for market risk modelling. The scenarios can help identify sectoral sensitivities, adjust volatility and correlation assumptions, and enrich the narratives of existing scenarios.
The scenarios also help to standardise climate stress testing by providing a consistent set of assumptions, variables, and modelling frameworks that financial institutions can use as a common reference. This alignment reduces discrepancies in inputs and methodologies, enabling more comparable results across banks and jurisdictions. As a result, institutions and supervisors can more effectively benchmark climate-related risks, identify outliers, and support coordinated regulatory responses, ultimately improving the credibility and usefulness of climate stress tests.
Importantly, the new scenarios are well-suited to meet the needs of regulatory frameworks like the Internal Capital Adequacy Assessment Process (ICAAP), which typically considers a 3-to-5-year horizon. This makes them far more applicable than traditional long-term scenarios, which typically look out to 2050. Similarly, the ECB climate stress testing framework requires banks to use a variety of time horizons and both physical and transition risk scenarios. With ever-growing regulatory expectations, such as the recent CP10/25 consultation paper from the PRA on managing climate-related risks, the new short-term scenarios provide a timely and relevant tool for banks.
Conclusion
The new NGFS short-term scenarios are an important addition to climate risk modelling frameworks, offering a direct focus on the next five years – a time period which is far more aligned with capital planning, liquidity assessments, and regulatory stress. However, the scenarios are not intended to replace existing long-term scenarios. Rather, they complement them by providing a near-term view of climate risk that is highly relevant for all banks.
For more information on how Zanders can support you to understand the impact of climate risk on your business, please contact Steyn Verhoeven and Polly Wong.
Navigating the Dutch National Mortgage Guarantee (NHG) in CRR3
June 2025
7 min read
Authors:
Rick Stuhmer, Victor van Donger
Share:
A regulatory change in CRR3 may significantly impact the capital treatment of NHG-covered Dutch mortgages.
With the introduction of CRR3, effective from January 1, 2025, the ‘extra’ guarantee on Dutch mortgages – known as the Dutch National Mortgage Guarantee (NHG) – will no longer be automatically eligible for the modelling approach. This requires institutions to apply the substitution approach instead. Although this may seem like a minor change, it can have far-reaching consequences. In this article, we provide a background on this change in the treatment of NHG and discuss the potential implications and challenges it may bring.
Introduction Dutch National Mortgage guarantee (NHG)
The Dutch National Mortgage Guarantee (NHG) serves as a safety net for borrowers and lenders of mortgage loans in the Netherlands. It is designed to provide protection in cases of financial distress caused by circumstances such as divorce, disability, or unemployment [1] [2] [3]. If these situations require the sale of the residential property and a residual debt remains after all other collection sources have been exhausted, the NHG will cover this remaining debt when contractual conditions are met1.
The NHG guarantee is provided by the Stichting Waarborgfonds Eigen Woning (WEW) [1] [4]. Although Stichting WEW is not state-owned, the Dutch state acts as a suretyship provider. This arrangement ensures that if Stichting WEW’s capital is insufficient to meet its guarantee claims, the state will supply unlimited interest-free loans. These loans must be repaid only after the foundation’s assets have been restored [5].
Following the Capital Requirements Regulation (CRR), the NHG guarantee classifies as Unfunded Credit Protection (UFCP) Credit Risk Mitigation (CRM) and should be treated accordingly.
Exposure class of Stichting WEW
As outlined in the previous text, the direct protection provider of the NHG is Stichting WEW. In the event that NHG fails to make payments, the Dutch sovereign state provides a suretyship to Stichting WEW, essentially serving as a counter-guarantee for the NHG guarantee extended by Stichting WEW.
CRR III article 4(8) [6] defines a public sector entity (PSE) as: “a non-commercial administrative body responsible to central governments, regional governments or local authorities, or to authorities that exercise the same responsibilities as regional governments and local authorities, or a non-commercial undertaking that is owned by or set up and sponsored by central governments, regional governments or local authorities, and that has explicit guarantee arrangements, and may include self-administered bodies governed by law that are under public supervision;”
Stichting WEW satisfies the definition of PSE in CRR III article 4(8), as it is a non-commercial undertaking (stichting) established2 by the central government, with an explicit guarantee arrangement from the Dutch central government. However, the CRR does not clearly define the sponsoring of the central government. Should it be determined that the sponsoring requirement is not met, Stichting WEW must instead be classified as a corporate exposure class3.
The remainder of the text assumes that Stichting WEW can be classified under the PSE exposure class as defined in CRR III article 112(c) (SA) and 147(2)(aa)(ii) (IRB). Nonetheless, the validity of the arguments throughout the following chapters remains intact, regardless of whether Stichting WEW is classified under the corporate or PSE exposure class.
Stichting WEW may not be classified as an exposure to a central government following CRR III articles 116 (SA) and 147(3)(a) (IRB), which specify that only specific public sector entities should be allocated to the central government exposure class. Given that Stichting WEW does not appear on the list published by the European Banking Authority (EBA) [7], it cannot be classified as an exposure to the central government under these articles.
There is no market consensus in the Dutch mortgage market on how to classify Stichting WEW: whether as a PSE or as a Corporate exposure. During our recently hosted roundtable discussing the implications of regulatory changes concerning NHG, participating banks indicated that it might be challenging to clearly classify Stichting WEW as a PSE due to the inconclusive regulatory guidance noted in this chapter. Banks are encouraged to engage in discussions with their Joint Supervisory Team (JST) and/or National Competent Authority (NCA) to determine the appropriate treatment of Stichting WEW.
Allowed UFCP approaches for NHG guarantees
According to CRR III article 108(3), if the AIRB approach is used for similar direct exposures to the protection provider, the UFCP modelling approach is required. In this context, similar direct exposure refers to exposure to the Stichting WEW4. With the competent authorities’ approval, the AIRB approach can be used for PSEs (and corporates), as specified in CRR III article 151(8-9). Therefore, if the AIRB approach is used for exposures to Stichting WEW, then the UFCP modelling approach is applicable. Conversely, if the SA or FIRB approach is used instead, then the UFCP substitution approach is mandatory.
Applying the effect of NHG guarantees
Under the substitution approach, the counter-guarantee provided by the Dutch central government can be recognized. CRR III article 214 states that guarantees backed by the central government may be treated as exposures within the central government exposure class, as defined in CRR III articles 112(a) (SA) and 147(2)(a) (IRB). This implies that the NHG guarantee can be classified under the central government exposure class [8]. Consequently, while capitalizing the NHG guarantee using the SA approach for the Dutch central government, it is possible, though not obligatory, to apply a 0% risk weight associated with the Dutch central government5.
If the institution employs the AIRB approach for exposures to to Stichting WEW, the modelling approach can be applied. In this scenario, risk weights for Stichting WEW and the Dutch central government (CRR article 214) are not used, as the effect of the NHG guarantee is modelled directly.
Substitution approach for banks without AIRB PSE models
For banks without AIRB models for Stichting WEW, the above argumentation does not apply, and the UFCP substitution approach for NHG presents several challenges.
The following list provides a non-exhaustive overview of these challenges:
1. Reconsideration of methodologies: Many banks model NHG separately, possibly through a specifically calibrated segment.
2. Level of application: Implementing the substitution approach within the reporting stream poses difficulties, as it requires separating the NHG-covered portion of the exposure from the uncovered portion. This could necessitate changes in data delivery and processing.
3. Changing coverage amounts over time: The NHG coverage percentage has changed from 100% to 90%, requiring at least two different implementations/calculations.
4. Unknown claimable amount: The exact amount that can be claimed is only known once the residential property is sold.
5. Loss-sharing exclusion: The substitution approach cannot incorporate the loss-sharing characteristic.
6. Mismatch between 0% substitution and actual losses of 5-10%: This is typically due to:
Failed NHG claims, which cannot be integrated into the substitution approach.
Discounting of cash-flows.
In summary, the substitution approach for banks without AIRB PSE models presents significant practical and methodological challenges. Effectively addressing these is essential to ensure a reliable implementation of the revised NHG treatment and maintain regulatory compliance.
Conclusion
Although the change in the CRR may seem minor at first glance, its consequences can be far-reaching. This article has outlined the key aspects of the revised NHG treatment, along with potential implications and challenges. However, it is not possible to provide a one-size-fits-all overview that fully captures the impact for every financial institution affected by this change.
If you would like to understand what the revised NHG treatment means specifically for your organization, feel free to contact our experts: Rick Stuhmer & Victor van Dongen.
[5] Stichting Waarborgfonds Eigen Woningen, „Memorie van toelichting bij de Wet herziening eigendomsgrenzen 2023, onderdeel 1477577. Rijksfinanciën.,” 2023. [Online]. Available here.
[6] European Parliament and European Council, „Amending Regulation (EU) No 575/2013 as regards requirements for credit risk, credit valuation adjustment risk, operational risk, market risk and the output floor,” 2024. [Online]. Available: https://eur-lex.europa.eu/legal-content/EN/TXT/PDF/?uri=OJ:L_202401623.
As of January 2014, a 10% loss sharing rule was introduced, meaning NHG guarantees only 90% of the residual debt. ↩︎
NHG statutes article 11 allow Dutch ministers to appoint 3 out of 5 members of the supervisory board, which together appoint the 6th member. This effectively means that the Dutch government controls 4 out of 6 members [9]. ↩︎
As fallback, Stichting WEW must be allocated to the corporate exposure class following CRR III article 147(7). ↩︎
Article 214 does not influence the exposure class of direct exposure to the protection provider, only the exposure class of the NHG guarantee itself. ↩︎
The alternatives are not recognizing the counter-guarantee, and either using the 20% risk weight implied by Stichting WEW’s AAA rating following CRR III article 116 using the SA approach, or using the IRB risk weight of Stichting WEW using the IRB approach. Both will lead to higher risk weights than 0% and lead to higher capital requirements. ↩︎
Innovations in PD Modeling for IFRS 9: Extending the Vasicek Framework
May 2025
7 min read
Authors:
Kasper Wijshoff, Kyle Gartner, Mila van den Bergh
Share:
In the rapidly shifting landscape of financial risk management, accurate estimation of default probabilities is crucial for informed decision-making.
According to the IFRS 9 standards, financial institutions are required to model probability of default (PD) using a Point-in-Time (PiT) measurement approach — a reflection of present macroeconomic conditions. In practice, PiT PD estimates are most often obtained through the conversion of their Through-the-Cycle (TtC) counterpart. As the Vasicek model has long stood as the industry-standard for this conversion, Zanders is continuously driving model enhancements through novel research. This research delves into modern adaptations of the industry-standard Vasicek methodology.
This article highlights collaborative research involving 17 students from Erasmus University Rotterdam, aiming to infuse greater granularity into credit risk modeling. Research was conducted by four student teams in the form of a group seminar project. Additionally, one student investigated this topic as part of her master thesis. By integrating both advanced statistical and machine learning techniques, this research showcases how modern adaptations could be introduced to redefine the traditional Vasicek framework, offering deeper insights into PD conversion methodologies. These enhancements provide flexibility and interpretability and contribute to a more extensive modeling toolkit.
Background
Compliance with International Financial Reporting Standard (IFRS 9) requires companies to obtain PiT PD estimates, which are influenced by macroeconomic variables. Banks reporting under IFRS 9 often use the TtC counterpart as a starting point, making use of various different conversion techniques to obtain the PiT PD (also our previous blog post A comparison between Survival Analysis and Migration Matrix Models). The industry-standard methodology to obtain these is by means of conversion through the Vasicek framework. The TtC PD reflects the PD irrespective of systemic factors, thereby reflecting the long-term average of the PD. Contrarily, the PiT PD reflects the probability that a party defaults at a specific point in the macroeconomic cycle, implying that PiT PD estimates fluctuate throughout the macroeconomic cycle. The mathematical technique introduced by Vasicek in 1977 and formalized in 2002 (Vasicek, An equilibrium characterization of the term structure, 1977; Vasicek, The distribution of loan portfolio value, 2002), serves as the industry-standard method for performing this conversion, integrating both systematic and idiosyncratic risks.
Understanding the Vasicek Model
Under the Vasicek model, the PiT PD can be derived from the TtC PD with the use of the Z-factor, which is defined as the state of the economy. The Z-factor corresponds to the systematic factor within the Vasicek framework and should be modeled as a function of macroeconomic variables. The linear regression constitutes a benchmark for modeling the Z-factor within the IFRS 9 framework due to its simplicity and the interpretability of its predictions. Formally, the Vasicek model is denoted as:
where PDPiT,i,t represents the PiT PD of firm i at time t. The economic state at time t is denoted as Zt, with ρ representing the correlation between firm i’s asset returns and the economic state. The Vasicek model assumes normality in asset returns and integrates both systematic and idiosyncratic risk, making it suitable for a broad range of applications.
Despite its simplicity and theoretical consistency, the model also faces critiques for its limitations under certain conditions (Basson & Van Vuuren, 2023), such as:
Simplistic Linearity Assumptions
Distributional Assumptions
Static Correlation Structure
These limitations can cause inaccurate PD estimations resulting in poor risk management, which could be detrimental for financial institutions. The industry-standard model often struggles with the extreme economic scenarios or sector-specific variations that are the most informative to predict. As the IFRS 9 principles allow for more freedom with regards to the modelling usage (while still being explainable), these limitations lead to ongoing exploration for enhancements.
Extending the Vasicek Model
To improve the Vasicek model, three different approaches were considered. The first approach covers extending the Vasicek model to a non-linear model which does not rely on linear assumptions. Secondly, granularity is added to the Vasicek model by considering a multitude of Copula functions. Finally, the correlation between a firms asset returns and the economic state is made time- and industry dependent in order to relax the assumption of a static correlation structure.
The Z-factor is heavily influenced by many interconnected variables, with regulations and policies leading to increasingly complex dynamics that are difficult to accurately model. As of now, the industry-standard method to model the Z-factor is through the use of linear regression. However, one could argue that the real-world state of the economy rather exhibits non-linear patterns.
To introduce this non-linearity, many methodologies were considered, including statistical models such as regularized regressions and regime-switching models. Additionally, Machine Learning (ML) techniques, ranging from Gradient Boosting to Neural Network approaches, have been proposed to better capture the intricate relationships that cannot be captured by linear models. These techniques (partly) relax assumptions on the underlying data structures and help in understanding complex patterns in the data, offering improved estimation accuracy while minimizing overfitting risks. Such models are particularly beneficial when dealing with high-dimensional data where traditional approaches tend to underfit.
Our findings indicate that Z-factor estimation accuracy can significantly be improved upon, using models such as the regime-switching model or the long short-term memory neural network. These models showed significantly more accurate Z-factor estimation, both in-sample and out-of-sample. Other ML models included in this research do not show a significant increase in prediction accuracy as compared to the single factor Vasicek model. However, the use of these models also adds an extra layer of complexity to the modeling approach.
As IFRS 9 regulations require model predictions to be interpretable, frameworks such as SHapley Additive exPlanations (SHAP) can be introduced as a measurement tool. Although SHAP values do not equal full explainability, they can be used to assess feature importance and general insights into the identity and magnitude of important macroeconomic variables used for Z-factor prediction. This increased complexity and decreased interpretability of the modelling process, makes that additional academic and/or regulatory advancements need to be made before ML methods can be used within IFRS 9 frameworks. One could argue whether the additional complexity introduced by using ML models justifies the marginal increase in estimation accuracy.
Copula Approach: Distributional Flexibility
Risks are often aggregated over broad sectors or asset classes without considering nuances at more granular levels. Such a model may overlook specific risk drivers relevant to particular firms or industries, leading to less accurate PD estimates.
The second research direction involves using Copula-based methodologies to inject granularity into PiT PD estimations. Within the Copula approach, dependencies between random macroeconomic variables can be captured independently of their respective distributions. This approach thus allows for a more accurate description of the system’s behavior, where the system consists of m macroeconomic variables and the Z-factor. Moreover, each (macroeconomic) variable can be modeled by its empirical CDF, avoiding the need for parametric assumptions. The option to avoid making any distributional assumptions makes the copula approach very flexible.
By allowing for more flexible dependency structures, Copula models can provide a better representation of tail risks. This is particularly relevant for IFRS Stage 2 loans, which includes financial instruments that have shown a significant increase in credit risk since initial recognition. In this research a variety of conditional Copula models are considered and tested. The conditional Copula computes the distribution of the Z-factor conditional on the m macroeconomic variables in the system. Despite challenges like the Gaussian Copula’s inability to model joint extreme events effectively, alternatives such as the t-Copula show a statistically significant improvement over the benchmark Vasicek model. In particular, the copula models significantly reduce the amount of underestimation, a crucial advantage in the context of credit risk modelling.
In conclusion, results indicate that this approach significantly improves PD estimation, as compared to the benchmark Vasicek model, while interpretability and marginal flexibility stays intact. However, it does introduce a higher degree of complexity within the model compared to the linear benchmark model. Hence, we consider this method to be a promising area of future research for PD estimation.
Time and Industry Varying Correlation Structure
The industry-standard Vasicek model assumes a constant correlation across industries and time periods. In reality, correlations among default events can change over time and/or vary across industries due to economic cycles or industry specific shocks. This presents a research opportunity to enhance the practical applicability by incorporating sectoral dynamics and temporal variations within the correlation parameter of the model. Resulting in the following equation:
where the correlation parameter ρi,t is unique for firm i at time t. This segmentation is not limited to industries and time periods, but could also be extended across different regions or size classes, depending on the specific portfolio that is being considered. The correlation parameter ρi,t is modeled with a beta-distribution with time-varying mean and is defined on the interval between 0 and 1. The mean of the beta distribution is modelled as a logit link function driven by company-specific data (Ferrari & Francisco, 2004). This method thus allows for the temporal dependency to change over time, taking into account that the underlying relationship of the data does not remain identical across different time periods. Implementing varying correlations allows PD models to adapt and reflect real-world scenarios more precisely, ultimately leading to more robust credit risk predictions.
Results indicate that this approach significantly improves PD estimation accuracy, as compared to the benchmark Vasicek model. Moreover, this improvement is realized while the interpretability and logic of the benchmark model stays intact. Therefore, we consider this improvement to be a general improvement to existing Vasicek frameworks!
Conclusion
In this research, we have examined several different improvements with regards to PD modelling under IFRS 9 by using a Vasicek model, which is the industry standard. The first approach focused on extending the Vasicek framework by including non-linearity through advanced statistical and machine learning models. It was found that the regime-switching model and the long short-term memory neural network significantly improved Z-factor prediction accuracy. However, the increased complexity and the decreased interpretability of these models raises the question whether the gains of these approaches outweigh the additional efforts in practical applications.
Secondly, a conditional copula approach was introduced to capture the dependencies between macroeconomic variables and the Z-factor. The Copula models demonstrated exceptionally good relative performance in certain industries. Overall, the t-Copula proved to be the best Copula model in terms of overall predictive accuracy, significantly outperforming the standard Vasicek model. However, introducing a Copula model does lead to a higher degree of complexity within the model framework.
Lastly, we have incorporated a time and industry varying correlation parameter into the standard Vasicek model, thereby relaxing the static assumption implied by the original model. The use of this approach shows promising results, with PD estimation accuracy increasing significantly. This methodology is a simple yet important extension of the Vasicek framework that improves estimation accuracy while maintaining a level of simplicity and interpretability.
To conclude, we find that various methodologies can be introduced to challenge the existing Vasicek framework. Findings indicate that a number of models improve estimation accuracy, However, in some cases the marginal increase in accuracy does not weigh up against the additional efforts that are necessary to use these models in practice. The methodology that we would focus on in actual use-cases is the inclusion of time- and industry-varying correlations, which has shown positive results that are both theoretically consistent and remain interpretable and compliant with IFRS 9 regulations.
By extending the Vasicek model, Zanders continues to contribute valuable insights, supporting the financial industry's shift to a more comprehensive modeling toolkit. These advancements highlight our commitment to developing solutions that meet modern accounting and regulatory standards while providing financial risk managers with enhanced tools for risk estimation.
Are you interested in how you could leverage these methodologies to enhance your PD modelling approach? Contact Kasper Wijshoff, Kyle Gartner or Mila van den Bergh for more information.
Bibliography
Basson, L. J., & Van Vuuren, G. (2023). Through-the-cycle to Point-in-time Probabilities of Default Conversion: Inconsistencies in the Vasicek Approach. International Journal of Economics, 13(6), 42-52.
Ferrari, S., & Francisco, C.-N. (2004). Beta regression for modelling rates and proportions. Journal of applied statistics, 31(7), 799-815.
Vasicek, O. (1977). An equilibrium characterization of the term structure. Journal of financial economics, 177-188.
Vasicek, O. (2002). The distribution of loan portfolio value. Risk, 160-162.
Fintegral
is now part of Zanders
In a continued effort to ensure we offer our customers the very best in knowledge and skills, Zanders has acquired Fintegral.