
Remote partnered with Zanders to simplify bank onboarding, enabling seamless global operations and innovative remote work solutions.
Remote offers global employment services for internationally distributed workforce. It takes care of payroll, benefits, compliance, taxes, equity incentives and more, so that companies can employ someone internationally as easily as they do at home. The company’s vision is to make it simple to manage, employ, and pay anyone, anywhere. Founded in 2019, Remote is growing quickly and expanding into different markets. In 2022, Zanders supported the company to accelerate the onboarding of new banks. Ana de Sousa, Director and Global Head of Treasury at Remote, explains the collaboration in this Q&A.
"We tackle some of the biggest challenges involved in building distributed teams, which are the risk, cost, and complexity of employing international employees and contractors,” De Sousa clarifies. “Our customers include GitLab, DoorDash, Loom, Paystack, and thousands of other companies around the world.”
You have been Director Global Treasurer at Remote for a year now. What attracted you to join the company?
“At Remote we often say that ‘talent is everywhere, but opportunities aren’t.’ I grew up in a very small village in Portugal so I personally identify with this. I saw that Remote is changing the world and I wanted to be part of this change. Beyond the mission, it’s also exciting to be part of a company that is applying technology and automation to bring efficiency to an area as complex as global employment. I am also very aligned with Remote’s values. The value of kindness is very special for me, as I believe that we can always make extraordinary things when we are kind.”

How would you describe the company’s corporate culture?
“Because Remote is a fully distributed virtual company with no offices, most roles are country-agnostic and our employees can work from their chosen locations around the world. That means we have Remoters from 75+ different nationalities, coming from all different cultures, backgrounds and experiences. This contributes to a diverse work environment where everyone is encouraged to share their culture and interests with everyone.”
What would you say drives the need for remote work/remote hiring and remote services in general?
“Over the past few years, many companies turned to remote work as a solution to a problem. What they are discovering now is that it can provide significant business advantages as well. Remote work enables you to build a team without being constrained by geography, meaning companies can tap into wider pools of talent while also supporting greater flexibility and work-life balance.”
What is your experience within different regions/markets?
“Remote has a global presence with around 80 legal entities on six continents. I started my career overseeing cash management for the EMEA region. Later, I moved to a new job with a global scope. Here at Remote, every single member of the Treasury team has global coverage. This means we can leverage asynchronous and flexible work for the entire team to be effective.”
You are working completely remotely, without having a physical company office. What has been your experience with this setup and do you miss meeting your colleagues in person?
“I do miss team birthday parties with cake sometimes. I advocate freedom of choice, based on whatever is best for you. Working from an office is still offered by plenty of companies. For me, remote work has allowed me to keep my career in an international environment while prioritizing family and flexibility. It’s certainly still possible to meet up with colleagues without a company office. I recently met one of my team members in person for the first time, and it was just like catching up with a friend.”
In terms of managing family/work time, are there days where you would prefer to work in a physical company office?
“No, I manage my time according to my priorities. If my kids need me, I will be available for them. If my work is my priority, that is my focus. It is not a physical place that defines my commitment or my capacity of producing results. It is important to have the right structure that supports your professional career independently of the place.”
What are the communication tools you use internally and externally?
“We use tools like Slack, Notion, Loom, and Asana for communication and documentation. Beyond the tools, Remoters are trained in asynchronous communication, documentation, inclusive language, meeting best practices, and even to use the UTC time zone companywide. These are all essential for a team that is as distributed as ours.”
What would you say are treasury-specific challenges when working remotely?
“The biggest challenges of remote work arise when we try to take the old office-centric methods of doing things and expect them to work just as well in a remote setting. Remote work does require some different considerations. Treasury teams in particular need to be rigorous about documentation and practicing ‘overcommunication’ given the critical nature of our work.”
What is the company’s approach for creating an integrated team and what is your personal approach to build a team spirit while working completely remotely?
“As a fully remote company, Remote works hard to build belonging and a sense of community throughout the company. There are numerous opportunities for social connection, including bonding times, games, and even virtual reality time. We have more than 1,700 Slack channels including channels for music, TV, pets, food, sports and much more. At the same time, our culture is asynchronous, so people can participate on their own time and all scheduled events rotate across time zones.”
Expanding into new markets is part of Remote’s core strategy. What role does Treasury play to enable new country operations?
“At Remote, Treasury is part of the backbone of our operations and an enabler of international growth. In the majority of cases, without a bank account, we cannot launch in a country. In addition, domestic bank accounts are also critical to offer better experience to our customers.”
How did Zanders support you to accelerate the onboarding of new banks?
“Zanders helped streamline what could be a very complicated process with banking partners. We appreciated their continuous communication and follow-up on progress, as well as their advocacy on our behalf to challenge some of the requirements we faced and even get a few of them waived.”
How did you perceive the collaboration between Remote and Zanders, given the project was delivered on a fully remote basis?
“It worked very well. We would not have been able to work with a partner that didn’t know how to collaborate remotely. Working with the Zanders team, we were able to apply the same operating principles we use internally – clearly defining guidelines and expectations, overcommunicating, and building a high degree of trust between our teams.”
To round off, what advice would you give anyone starting to work 100% remotely?
“Life is too short to waste time commuting. Remote work is all about freedom, flexibility and happiness. When we do what we like, we’ll get great results, regardless of where the work is done.”
The collaboration between Remote and Zanders
Viktorija Janevska, manager at Zanders: “Account opening and KYC has been a challenge for many corporates in recent years, given the increasing KYC requirements and rather cumbersome onboarding experience. We at Zanders have been happy to support Remote with this interim project, taking the workload from the team and being the first point of contact for the banks with regards to the account opening and onboarding documentation requests. Key success factors for the project were the open and transparent communication between the two teams, regular update calls and priority setting.
Remote not only demonstrates an innovative working approach when it comes to working remotely, but also by using chats for most of their internal communication rather than email communication. During the project, the transition from email to chat communication required some adaptation and from time to time a reminder to use the preferred channel. It has been a great experience to accompany Remote on its journey and are looking forward to see the company’s further success.”

ESG-related derivatives: regulation & valuation
The most popular financial instruments in this regard are sustainability-linked loans and bonds. But more recently, corporates also started to focus on ESG-related derivatives. In short, these derivatives provide corporates with a financial incentive to improve their ESG performance, for instance by linking it to a sustainable KPI. This article aims to provide some guidance on the impact of regulation around ESG-related derivatives.
As covered in our first ESG-related derivatives article, a broad spectrum of instruments is included in this asset class, the most innovative ones being emission trading derivatives, renewable energy and fuel derivatives, and sustainability-linked derivatives (SLDs).
Currently, market participants and regulatory bodies are assessing if, and how new types of derivatives fit into existing derivatives regulation. In this regard, European and UK regulators are at the forefront of the regulatory review to foster activity and ensure safety of financial markets. Since it’s especially challenging for market participants to comprehend the impact of these regulations and the valuation implications of SLDs, we aim to provide guidance to corporates on these matters, with a special focus on the implications for corporate treasury.
Categorization & classification
When issuing an SLD, it’s important to understand which category the respective SLD falls in. That is, whether the SLD incorporates KPIs and the impact of cashflows in the derivatives instrument (category 1), or if the KPIs and related cashflows are stated in a separate agreement, in which the underlying derivatives transaction is mentioned for setting the reference amount to compute the KPI-linked cashflow (category 2). This categorization makes it easier to understand the regulations applying to the SLD, and the implications of those regulations.
In general, a category 1 SLD will be classified as derivative under European and UK regulations, and swap under US regulations, if the underlying financial contract is already classified as such. The addition of KPI elements to the underlying financial instrument is unlikely to change that classification.
Whether a category 2 SLD is classified as a derivative or swap is somewhat more complicated. In Europe, this type of SLD is classified as a derivative if it falls within the MIFID II catch-all provision, which must be determined on a case-by-case basis.
Overall, instruments that are classified as derivatives in Europe will also be classified as such in the UK. But to elaborate, a category 2 SLD will classified as a derivative in the UK if the payments of the financial instrument vary based on fluctuations in the KPIs.
When a category 2 SLD is issued in the US, it will only be classified as a swap if KPI-linked payments within the financial agreement go in two directions. Even if that is the case, the SLD may still be eligible for the status as commercial agreement outside of swaps regulation, but that is specific to facts and circumstances.
Apart from the classification as derivative or swap, it is also helpful to determine whether an SLD could be considered a hedging contract, so that it is eligible for hedging exemptions. The requirements for this are similar in Europe, the UK, and the US. Generally, category 1 SLDs are considered hedging contracts if the underlying instruments still follow the purpose of hedging commercial risks, after the KPI is incorporated. Category 2 SLDs are normally issued to meet sustainability goals, instead of hedging purposes. Therefore, it is unlikely that this category of SLDs will be classified as hedging contracts.
Regulation & valuation implications
When issuing an SLD that is classified as a derivative or swap, there are several regulatory and valuation implications relevant to treasury. These implications can be split up in six types which we will now explain in more detail. The six types (risk management, reporting, disclosure, benchmark-related considerations, prudential requirements, and valuation) are similar for corporates across Europe, the UK, and the US, unless otherwise mentioned.
Risk management
As is the case for other derivatives and swaps, corporate treasuries must meet confirmation requirements, undertake portfolio reconciliation, and perform portfolio compression for SLDs. Additionally, regulated companies are required to construct effective risk procedures for risk management, which includes documenting all risks associated with KPI-linked cashflows. While these points might be business as usual, it must also be determined if and how KPI-linked cashflows should be modeled for valuation obligations that apply to derivatives and swaps. For instance, initial margin models might need to be adjusted for SLDs, so they capture KPI-linked risks accurately.
Reporting
Corporate treasuries must report SLDs to trade repositories in Europe and the UK, and to swap data repositories in the US. Since these repositories require companies to report in line with prescriptive frameworks that do not specifically cover SLDs, it should be considered how to report KPI-linked features. As this is currently not clearly defined, issuers of SLDs are advised to discuss the establishment of clear reporting guidelines for this financial instrument with regulators and repositories. A good starting point for this could be the mark-to-market or mark-to-model valuation part of the EMIR reporting regulations.
Disclosure
Only Treasuries of European financial entities will be involved in meeting disclosure requirements of SLDs, as the legislation in the UK and US is behind on Europe in this respect, and non-financial market participants are not as strictly regulated. From January 2023, the second phase of the Sustainable Finance Disclosure Regulation (SFDR) will be in place, which requires financial companies to report periodically, and provide pre-contractual disclosures on SLDs. Treasuries of investment firms and portfolio managers are ought to contribute to this by reporting on sustainability-related impact of the SLDs compared to the impact of reference index and broad market index with sustainability indicators. In addition, they could leverage their knowledge of financial instruments to evaluate the probable impacts of sustainability risks on the returns of the SLDs.
Benchmark-related implications
In case the KPI of an SLD references or includes an index, it could be defined as a benchmark under European and UK legislation. In such cases, treasuries are advised to follow the same policy they have in place for benchmarks incorporated in other brown derivatives. Specific benchmark regulations in the US are currently non-existent, however, many US benchmark administrators maintain policies in compliance with the same principles as where the European and UK benchmark legislation is built on.
Prudential requirements
Since treasury departments of corporates around the world are required to calculate risk-weighted exposures for derivatives transactions as well as non-derivatives transactions, this is not different for SLDs. While there is currently little guidance on this for SLDs explicitly, that may change in the near future, as US prudential regulators are assessing the nature of the risk that is being assumed with in-scope market participants.
Valuation
The SLD market is still in its infancy, with SLD contracts being drawn up are often specific to the company issuing it, and therefore tailor made. The trading volume must go up, trade datasets are to be accurately maintained, and documentation should be standardized on a global scale for the market to reach transparency and efficiency. This will lead to the possibility of accurate pricing and reliable cashflow management of this financial instrument and increases the ability to hedge the ESG component.
To conclude
As aforementioned, the ESG-related derivatives market and the SLD market within it are still in the development phase. Therefore, regulations and their implications will evolve swiftly. However, the key points to consider for corporate treasury when issuing an SLD presented in this article can prove to be a good starting point for meeting regulatory requirements as well as developing accurate valuation methodology. This is important, since these derivatives transactions will be crucial for facilitating the lending, investment and debt issuance required to meet the ESG ambitions of Europe, the UK, and the US.
For more information on ESG issues, please contact Joris van den Beld or Sander van Tol.

Everyone understands the importance of data in an organization. After all, data is the new oil in terms of its value to a corporate treasury and indeed the wider organization. However, not everyone is aware of how best to utilize data. This article will tell you.
Developing a data strategy depends on using the various types of payment, market, cashflow, bank and risk data available to a treasury, and then considering the time implications of past historical data, present and future models, to better inform decision-making. We provide a roadmap and ‘how to’ guide to becoming a data-driven organization.
Why does this aim matter? Well, in this age of digitization, almost every aspect of the business has a digital footprint. Some significantly more than the others. This presents a unique opportunity where potentially all information can be reliably processed to take tactical and strategic decisions from a position of knowledge. Good data can facilitate hedging, forecasting and other key corporate activities. Having said all that, care must also be taken to not drown in the data lake1 and become over-burdened with useless information. Take the example of Amazon in 2006 when it reported that cross-selling attributed for 35% of their revenue2. This strategy looked at data from shopping carts and recommended other items that may be of interest to the consumer. The uplift in sales was achieved only because Amazon made the best use of their data.
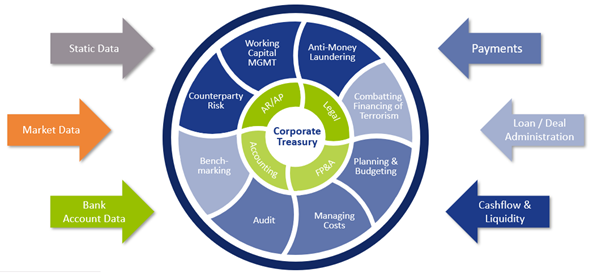
Treasury is no exception. It too can become data-driven thanks to its access to multiple functions and information flows. There are numerous ways to access and assess multiple sets of data (see Figure 1), thereby finding solutions to some of the perennial problems facing any organization that wants to mitigate or harness risk, study behavior, or optimize its finances and cashflow to better shape its future.
Time is money
The practical business use cases that can be realized by harnessing data in the Treasury often revolve around mastering the time function. Cash optimization, pooling for interest and so on often depend on a good understanding of time – even risk hedging strategies can depend on the seasons, for instance, if we’re talking about energy usage.
When we look at the same set of data from a time perspective, it can be used for three different purposes:
I. Understand the ‘The Past’ – to determine what transpired,
II. Ascertain ‘The Present’ situation,
III. Predict ‘The Future’ based on probable scenarios and business projections.
I – The Past
“Study the past if you would define the future”
Confucius

The data in an organization is the undeniable proof of what transpired in the past. This fact makes it ideal to perform analysis through Key Performance Indicators (KPIs), perform statistical analysis on bank wallet distribution & fee costs, and it can also help to find the root cause of any irregularities in the payments arena. Harnessing historical data can also positively impact hedging strategies.
II – The Present
“The future depends on what we do in the present”
M Gandhi
Data when analyzed in real-time can keep stakeholders updated and more importantly provide a substantial basis for taking better informed tactical decisions. Things like exposure, limits & exceptions management, intra-day cash visibility or near real-time insight/access to global cash positions all benefit, as does payment statuses which are particularly important for day-to-day treasury operations.
III – The Future
“The best way to predict the future is to create it.”
Abraham Lincoln
There are various areas where an organization would like to know how it would perform under changing conditions. Simulating outcomes and running future probable scenarios can help firms prepare better for the near and long-term future.
These forecast analyses broadly fall under two categories:
Historical data: assumes that history repeats itself. Predictive analytics on forecast models therefore deliver results.
Probabilistic modeling: this creates scenarios for the future based on the best available knowledge in the present.
Some of the more standard uses of forecasting capabilities include:
- risk scenarios analysis,
- sensitivity analysis,
- stress testing,
- analysis of tax implications on cash management structures across countries,
- & collateral management based on predictive cash forecasting, adjusted for different currencies.
Working capital forecasting is also relevant, but has typically been a complex process. The predication accuracy can be improved by analyzing historical trends and business projections of variables like receivables, liabilities, payments, collections, sales, and so on. These can feed the forecasting algorithms. In conjunction with analysis of cash requirements in each business through studying the trends in key variables like balances, intercompany payments and receipts, variance between forecasts and actuals, this approach can lead to more accurate working capital management.
How to become a data-driven organization
“Data is a precious thing and will last longer than the systems themselves.”
Tim Berners-Lee
There can be many uses of data. Some may not be linked directly to the workings of the treasury or may not even have immediate tangible benefits, although they might in the future for comparative purposes. That is why data is like a gold mine that is waiting to be explored. However, accessing it and making it usable is a challenging proposition. It needs a roadmap.
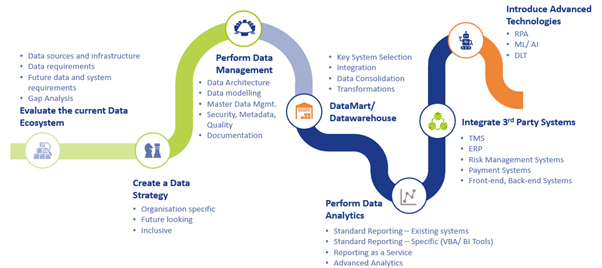
The most important thing that can be done in the beginning is to perform a gap analysis of the data ecosystem in an organization and to develop a data strategy, which would embed importance of data into the organization’s culture. This would then act as a catalyst for treasury and organizational transformation to reach the target state of being data-driven.
The below roadmap offers a path to corporates that want to consistently make the best use of one of their most critical and under-appreciated resources – namely, data.
We have seen examples like Amazon and countless others where organizations have become data- driven and are reaping the benefits. The same can be said about some of the best treasury departments we at Zanders have interacted with. They are already creating substantial value by analyzing and making the optimum use of their digital footprint. The best part is that they are still on their journey to find better uses of data and have never stopped innovating.
The only thing that one should be asking now is: “Do we have opportunities to look at our digital footprint and create value (like Amazon did), and how soon can we act on it?”
References:

Over the past years, more and more corporates have implemented a sustainability framework, incorporating specific KPIs that can be used as a basis to arrange sustainability-linked funding instruments.
Next to sustainable funding instruments, including both green and social, we also see that these KPI’s can be used for other financial instruments, such as ESG (Environmental, Social, Governance) derivatives. These derivatives are a useful tool to further drive the corporate sustainability strategy or support meeting environmental targets.
Since the first sustainability-linked derivative was executed in 2019, market participants have entered into a variety of ESG-related derivatives and products. In this article we provide you with an overview of the different ESG derivatives. We will touch upon the regulatory and valuation implications of this relatively new derivative class in a subsequent article, which will be published later this year.
Types of ESG-related derivatives products
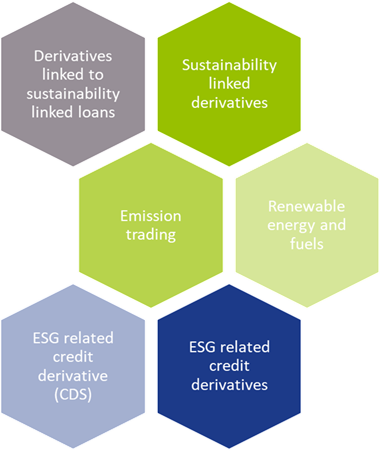
Driven by regulatory pressure and public scrutiny, corporates have been increasingly looking for ways to manage their sustainability footprint. As a result of a blooming ESG funding market, the role of derivatives to help meet sustainability goals has grown. ESG-related derivatives cover a broad spectrum of derivative products such as forwards, futures and swaps. Five types (see figure 1) of derivatives related to ESG can be identified; of which three are currently deemed most relevant from an ESG perspective.
The first category consists of traditional derivatives such as interest rate swaps or cross currency swaps that are linked to a sustainable funding instrument. The derivative as such does not contain a sustainability element.
Sustainability-linked derivatives
Sustainability-linked derivatives are agreements between two counterparties (let’s assume a bank and a corporate) which contain a commitment of the corporate counterparty to achieve specific sustainability performance targets. When the sustainability performance targets are met by the corporate during the lifetime of the derivative, a discount is applied by the bank to the hedging instrument. When the targets are not met, a premium is added. Usually, banks invest the premium they receive in sustainable projects or investments. Sustainability-linked derivative transactions are highly customizable and use tailor-made KPIs to determine sustainability goals. Sustainability-linked derivatives provide market participants with a financial incentive to improve their ESG performance. An example is Enel’s sustainability-linked cross currency swap, which was executed in July 2021 to hedge their USD/EUR exchange rate and interest rate exposures.
Emission trading derivatives
Other ESG-related derivatives support meeting sustainable business models and consist of trading carbon offsets, emission trading derivatives, and renewable energy and renewable fuels derivatives, amongst others. Contrary to sustainability-linked derivatives, the use of proceeds of ESG-related derivatives are allocated to specific ESG-related purposes. For example, emissions trading is a market-based approach to reduce pollution by setting a (geographical) limit on the amount of greenhouse gases that can be emitted. It consists of a limit or cap on pollution and tradable instruments that authorize holders to emit a specific quantity of the respective greenhouse gas. Market participants can trade derivatives based on emission allowances on exchanges or OTC markets as spots, forwards, futures and option contracts. The market consists of mandatory compliance schemes and voluntary emission reduction programs.
Renewable energy and fuel derivatives
Another type of ESG-related derivatives are renewable energy and renewable fuel hedging transactions, which are a valuable tool for market participants to hedge risks associated with fluctuations in renewable energy production. These ESG-related credit derivatives encourage more capital to be contributed to renewable energy projects. Examples are Power Purchase Agreements (PPAs), Renewable Energy Certificate (REC) futures, wind index futures and low carbon fuel standard futures.
ESG related credit derivatives
ESG-related CDS products can be used to manage the credit risk of a counterparty when financial results may be impacted by climate change or, more indirectly, if results are affected due to substitution of a specific product/service. An example of this could be in the airline industry where short-haul flights may be replaced by train travel. Popularity of ESG-related CDS products will probably increase with the rising perception that companies with high ESG ratings exhibit low credit risk.
Catastrophe and weather derivatives
Catastrophe and weather derivatives are insurance-like products as well. Both markets have existed for several decades and are used to hedge exposures to weather or natural disasters. Catastrophe derivatives are financial instruments that allow for transferral of natural disaster risk between market participants. These derivatives are traded on OTC markets and enable protection from enormous potential losses following from natural disasters such as earthquakes to be obtained. The World Bank has designed catastrophe swaps that support the transfer of risks related to natural disasters by emerging countries to capital markets. An example if this is the swap issued for the Philippines in 2017. Weather derivatives are financial instruments that derive their value from weather-related factors such as temperature and wind. There derivatives are used to mitigate risks associated with adverse or unexpected weather conditions and are most commonly used in the food and agriculture industry.
What’s old, what’s new and what’s next?
ESG-related credit derivatives would be best applied by organizations with credit exposures to certain industries and financial institutions. Despite the link to an environmental element, we do not consider catastrophe bonds and weather derivatives as a sustainability-linked derivative. Neither is it an innovative, new product that is applicable to corporates in various sectors.
Truly innovative products are sustainability-linked derivatives, voluntary emissions trading and renewable energy and fuel derivatives. These products strengthen a corporate’s commitment to meet sustainability targets or support investments in sustainable initiatives. A lack of sustainability regulation for derivatives raises the question to what extent these innovative products are sustainable on their own? An explicit incentive for financial institutions to execute ESG-related derivatives, such as a capital relief, is currently absent. This implies that any price advantage will be driven by supply and demand.
Corporate Treasury should ensure they consider the implications of using ESG-related derivatives that affect the cashflows of derivatives transactions. Examples of possible regulatory obligations consist of valuation requirements, dispute resolution and reporting requirements. Since ESG-related derivatives and products are here to stay, Zanders recommends that corporate treasurers closely monitor the added value of specific instruments, as well as the regulatory, tax and accounting implications. Part II of this series, later in the year, will focus on the regulatory and valuation implications of this relatively new derivative class.
For more information on ESG issues, please contact Sander van Tol.

With house bank accounts treated as master data instead of configuration objects including the latest enhancement, the bank account subledger concept, SAP S/4HANA Bank Account Management (BAM) aims to shift responsibility of bank account management life cycle from the technical teams to the cash and banking teams.
Bank accounts can now be created and maintained by the cash and banking responsible team, giving them more control over the timing of opening or closing of an account as well as expediting the overall process and limiting the number of users involved in the maintenance of the accounts.
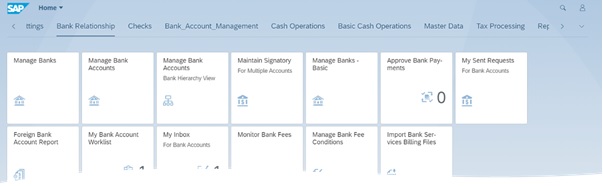
Figure 1 – Launchpad BankApplications
The advantages of using the full version of BAM are multiple, but below we highlight three of the main reasons full BAM is a must have for the companies using one or multiple SAP environments.
Flexible workflows
Maintenance of bank account data can trigger workflows based on the organization’s requirements and the approval processes in place. With the workflows the segregation of duties can be enforced when maintaining a bank account.
Even though workflows are not a new functionality in S/4HANA, the fact that workflow templates are available and can be amended by defining preconditions, step sequences and recipients improves the approval process of bank accounts.
The workflows can be created and activated as completely new ones or based on the already existing templates . You can create a new workflow by copying an existing one and updating the parameters according to the new requirements.
All the requests to release or approve bank account changes are available as of S/4HANA 2020 in the My Inbox for Bank Accounts app, the dedicated inbox app where users can check the status of each request initiated by the users themselves or sent to them and act upon.
Easy data replication
One of the challenges multiple organizations have, especially those operating various SAP environments, is data synchronization and replication. We often come across situations when banks, house banks and bank accounts are not maintained in all relevant environments creating data inconsistencies and making processes more difficult than they already are.
One of the ways of avoiding these types of situations is by replicating banks, house banks and bank accounts from production to quality assurance and to development environments using standard Idocs.
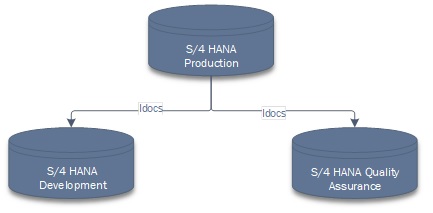
Figure 2 – Bank data replication in S/4 HANA
If the organization is operating on multiple SAP and non-SAP instances and running processes in a S/4 HANA side-car solution, the challenge of maintaining banks, house banks and bank accounts grows exponentially. Distributing the data via Idocs will not only keep all the systems coordinated, it will also decrease the amount of manual work and avoid situations when processes fail because of delays in keeping the data up to date in all relevant environments.
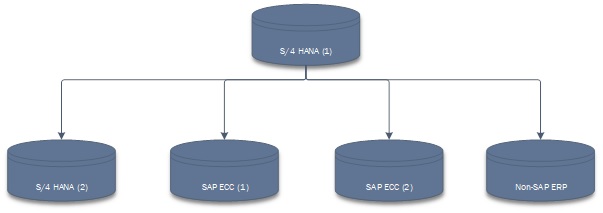
Figure 3 -Bank data replication across multiple environments
Simple way of managing cash pools
Cash pooling structures can easily be set up by the user and in this way the BAM solution is integrated with the process of making cash management transfers.
Even though the cash pooling and cash concentration in S/4HANA are managed using five different apps (shown in the figure below), the actual structure of the cash pool is defined directly in the Manage Bank Accounts app (Cash Pool tab).
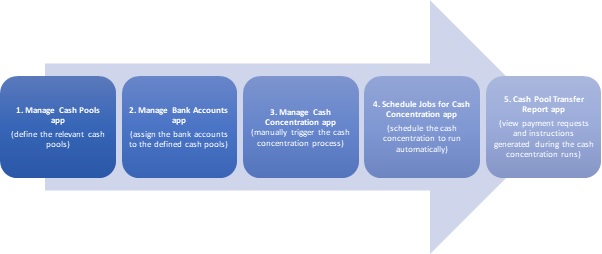
Figure 4 – Five apps to manage cash pooling and cash concentration in S/4HANA
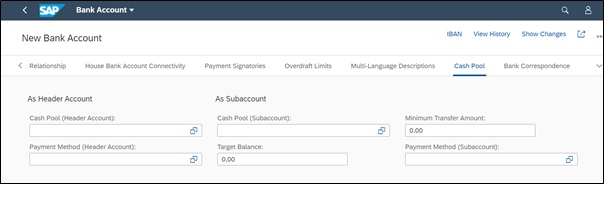
In the Cash Pool tab, the user can define the cash pool structure as per each company’s requirements. It is important to keep in mind the fact that a bank account can be assigned only to two different cash pools: once as the header account of a cash pool, and once in a different cash pool, as a subaccount.
The cash pools created in the system are not restricted to one company code but can be defined using various currency accounts belonging to multiple company codes. For each of the bank accounts included in a cash pool, a target balance as well as a minimum transfer amount can be defined in the Cash Pool tab of the Manage Bank Accounts app, with the mention that both (target balance as well as minimum transfer amounts) must be defined in the bank account currency.
During the cash concentration process, when bank transfers are generated, the payment methods defined in this tab will be picked up. Therefore, if required, two different payment methods can be assigned; the first for the structure where the bank account is acting as a header account and the second for the one where the account in scope is a subaccount. To pick them up from the drop-down list, the assigned payment methods must be initially setup in the system.
To conclude
Maintaining banks, house banks and bank accounts can be a difficult task especially in large organizations operating with different SAP and non-SAP environments. It can be time-consuming; it can involve multiple people from different parts of the organization (IT, master data, cash and banking etc.) and it can easily be prone to errors and mismatches if not correctly maintained and synchronized. Having one single source of truth for the bank accounts – which is easy to maintain, user-friendly, with appropriate controls in place and reporting capabilities, easy to replicate the data across different environments and which allows the user to create and maintain not only the bank accounts but also the cash pool structures – can save time, resources and simplify processes.

S/4 HANA Advanced Payment Management (APM) is SAP’s new solution for centralized payment hubs. Released in 2019, this solution operates as a centralized payment channel, consolidating payment flows from multiple payment sources. This article will serve to introduce its functionality and benefits.
Intraday Bank Statements offers a cash manager additional insight in estimated closing balances of external bank accounts and therefore provides the information to manage the cash more tightly on the company’s bank accounts.
Whilst over the previous years, many corporates have endeavoured to move towards a single ERP system. There are many corporates who operate in a multi-ERP landscape and will continue to do so. This is particularly the case amongst corporates who have grown rapidly, potentially through acquisitions, or that operate across different business areas. SAP’s Central Finance caters for centralized financial reporting for these multi-ERP businesses. SAP’s APM similarly caters for businesses with a range of payment sources, centralizing into a single payment channel.
SAP APM acts as a central payment processing engine, connecting with SAP Bank Communication Management and Multi-Bank Connectivity for sending of external payment Instructions. For internal payments & payments-on-behalf-of, data is fed to SAP In-House Cash. Whilst at the same time, data is transmitted to S/4 HANA Cash Management to give centralized cash forecast data.
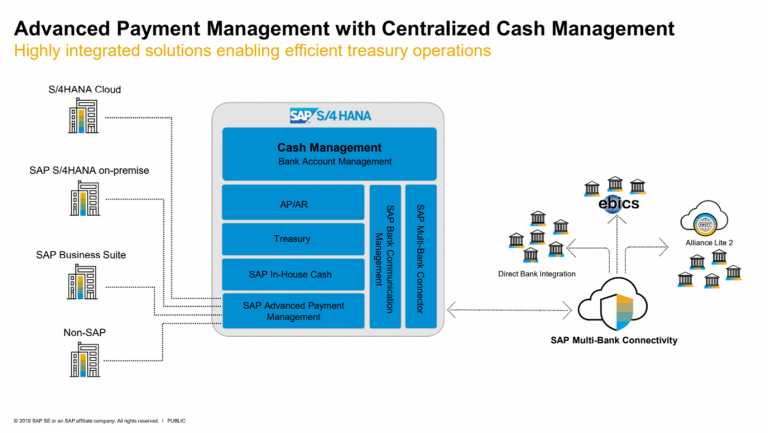
Figure 1 – SAP S/4 HANA Advanced Payment Management – Credit SAP
The framework of this product was built up as SAP Payment Engine, which is used for the processing of payment instructions at banking institutions. On this basis, it is a robust product, and will cater for the key requirements of corporate payment hubs, and much more beyond.
Building a business case
When building a business case for a centralized payment hub, it is important to look at the full range of the payment sources. This can include accounts payable/receivable (AP/AR) payments, but should also consider one-off (manual) payments, Treasury payments, as well as HR payments such as payroll. Whilst payroll is often outsourced, SAP APM can be a good opportunity to integrate payroll into a corporate’s own payment landscape (with the necessary controls of course!).
Using a centralized payment hub will help to reduce implementation time for new payment sources, which may be different ERPs. In particular, the ability of SAP APMs Input Manager to consume non-standard payment file formats helps to make this a smooth implementation process.
SAP APM applies a level of consistency across all payments and allows for a common payment control framework to be applied across the full range of payment sources.
A strength of the product is its flexible payment routing, which allows for payment routing to be adjusted according to the business need. This does not require specialist IT configuration or re-routing. It enables corporates to change their payment framework according to the need of the business, without the dependency on configuration and technology changes.
A central payment hub means no more direct bank integrations. This is particularly important for those businesses that operate in a multi-ERP environment, where the burden can be particularly heavy.
Lastly, as with most SAP products, this product benefits from native integration into modules that corporates may already be using. Payment data can be transferred directly into SAP In-House Cash using standard functionality in order to reflect intercompany positions. The richest level of data is presented to S/4 HANA Cash Management to provide accurate and up-to-date cash forecast data for Treasury front office.
Scenarios
SAP APM accommodates four different scenarios:
| Scenario | Description |
| Internal transfer | Payment from one subsidiaries internal account to the internal account of another |
| Payment on-behalf-of | Payment to external party from the internal account of a subsidiary |
| Payment in-name of | Payment to external party from the external account of a subsidiary. The derivation of the external account is performed in APM. |
| Payment in-name-of – forwarding only | Payment to external party from the external account of a subsidiary. The external account is pre-determined in the incoming payment instruction. |
A Working Example – Payment-on-behalf-of
An ERP sends a payment instruction to the APM system via iDoc. This is consumed by the input manager, creating a payment order that is ready to be processed.
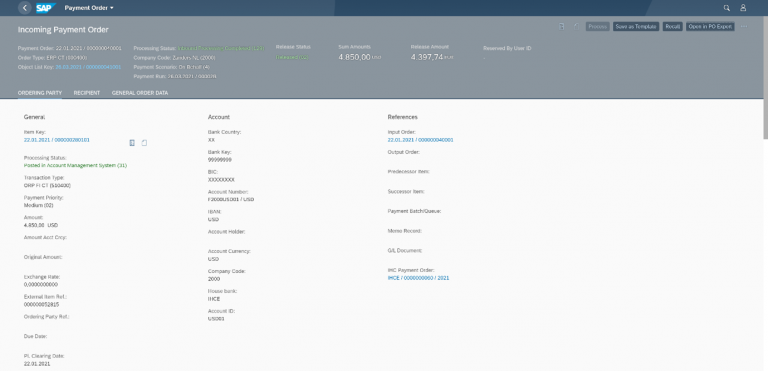
Figure 3 – Creation of Incoming Payment Order in APM
The payment order will normally be automatically processed immediately upon receipt. First the enrichment & validation checks are executed, which validate the integrity of the payment Instruction.
The payment routing is then executed for each payment item, according to the source payment data. The Payment Routing importantly selects the appropriate house bank account for payment and can be used to determine the prioritization of payments, as well as the method of clearing.
In the case of a payment-on-behalf-of, an external route will be used for the credit payment item to the third party vendor, whilst an internal route will be used to update SAP In-House Cash for the intercompany position.
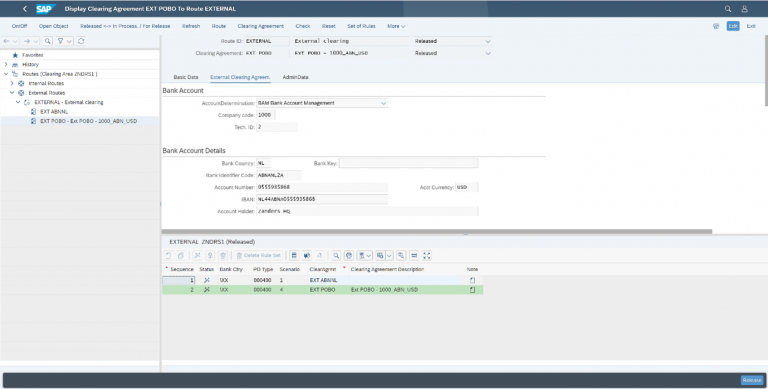
Figure 4 – Maintenance of Routes
Clearing can be executed in batches, via queues or individual processing. The internal clearing for the debit payment item must be executed into SAP In-House Cash in order to reflect the intercompany position built up. The internal clearing for the credit payment Item can be fed into the general ledger of the paying entity.
Figure 5 – Update of In-House Cash for Payment-On-Behalf or Internal Transfer Scenarios
Outgoing payment orders are created once the routing & clearing is completed. At this stage, any further enrichment & validation can be executed and the data will be delivered to the output manager. The output manager has native integration with SAP’s DMEE Payment Engine, which can be used to produce an ISO20022 payment instruction file.
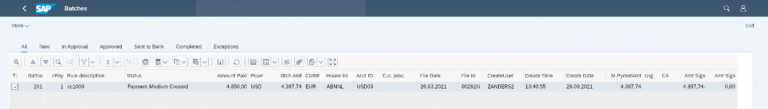
Figure 6 – Payment Instruction in SAP Bank Communication Management
The outgoing payment instruction is now visible in the centralized payment status monitor in SAP Bank Communication Management.
The full processing status of the payment is visible in SAP APM, including the points of data transfer.
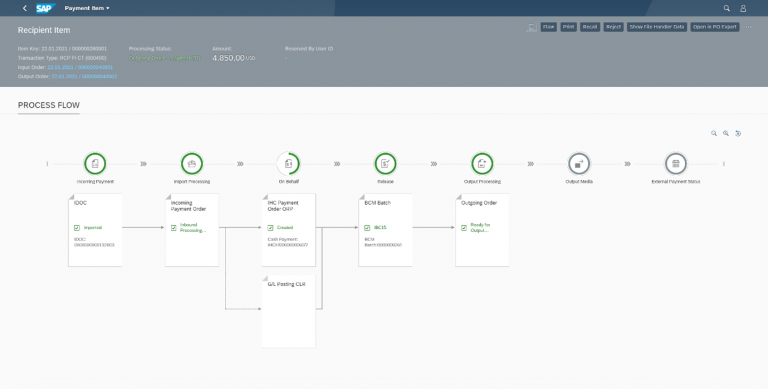
Figure 7 – SAP APM Process Flow
Introduction to Functionality
SAP APM is comprised of 4 key function areas:
- Input manager & output manager
- Enrichment and validation
- Routing
- Transaction clearing
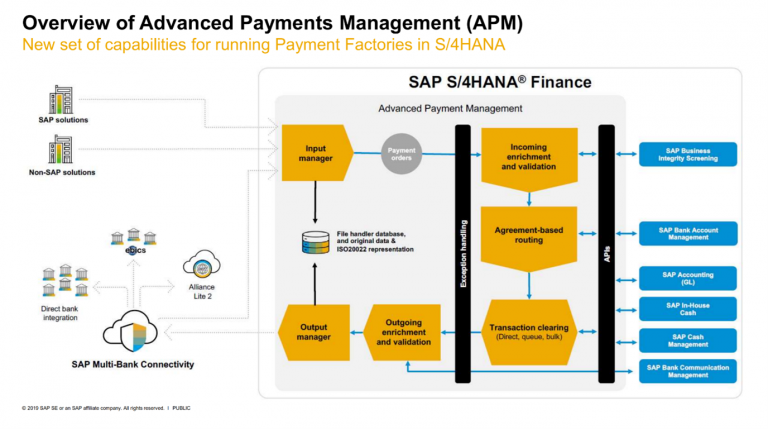
Figure 2 – SAP Advanced Payment Management Framework – Credit SAP
Input Manager
The input manager can flexibly import payment instruction data into APM. Standard converters exist for iDoc Payment Instructions (PEXR2002/PEXR2003 PAYEXT), ISO20022 (Pain.001.01.03) as well as for SWIFT MT101 messages. However, it is possible to configure new input formats that would cater for systems that may only be able to produce flat file formats.
Enrichment and Validation
Enrichment and validation can be used to perform integrity checks on payment items during the processing through APM. These checks could include checks for duplicate payment instructions. This feeds an initial set of data to S/4 HANA Cash Management (prior to routing) and can be used to return payment status messages (Pain.002) to the sending payment system.
Routing
Agreement-based routing is used to determine the selection of external accounts. This payment routing is highly flexible and permits the routing of payments according to criteria such as amounts and, beneficiary countries. The routing incorporates cut-off time logic and determines the priority of the payment as well as the sending bank account. This stage is not used for “forwarding-only” scenarios, where there is no requirement to determine the subsidiaries house bank account in the APM platform.
Clearing
Clearing involves the sending of payment data after routing to S/4 HANA Cash Management, in-house cash and onto the general ledger. According to selected route, payments can be cleared individually, or grouped into batches.
Further enrichment & validation can be performed, and external payments are routed via the output manager, which can re-use DMEE payment engines to produce payment files. These payment files can be monitored in SAP Bank Communication Management and delivered to the bank via SAP Multi-Bank Connectivity.

The most recent S/4HANA Finance for cash management completes the bank account management (BAM) functionality with a bank account subledger concept. This final enhancement allows the Treasury team to assume full ownership in the bank account management life-cycle.
With the introduction of the new cash management in S/4HANA in 2016, SAP has announced the bank account management functionality, which treats house bank accounts as master data. With this change of design, SAP has aligned the approach with other treasury management systems on the market moving the bank account data ownership from IT to Treasury team.
But one stumbling block was left in the design: each bank account master requires a dedicated set of general ledger (G/L) accounts, on which the balances are reflected (the master account) and through which transactions are posted (clearing accounts). Very often organizations define unique GL account for each house bank account (alternatively, generic G/L accounts are sometimes used, like “USD bank account 1”), so creation of a new bank account in the system involves coordination with two other teams:
- Financial master data team – managing the chart of accounts centrally, to create the new G/L accounts
- IT support – updating the usage of the new accounts in the system settings (clearing accounts)
Due to this maintenance process dependency, even with the new BAM, the creation of a new house bank account remained a tedious and lengthy process. Therefore, many organizations still keep the house bank account management within their IT support process also on S/4HANA releases, negating the very idea of BAM as master data.
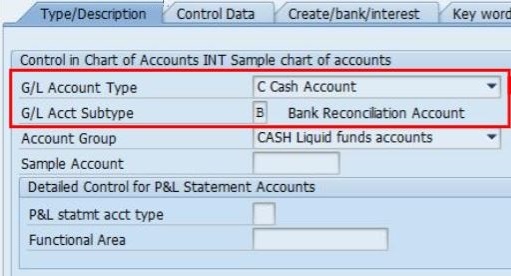
To overcome this limitation and to put all steps in the bank account management life cycle in the ownership of the treasury team completely, in the most recent S/4HANA release (2009) SAP has introduced a new G/L account type: “Cash account”. G/L accounts of this new bank reconciliation account type are used in the bank account master data in a similar way as the already established reconciliation G/L accounts are used in customer and vendor master data. However, two new specific features had to be introduced to support the new approach:
- Distinction between the Bank sub account (the master account) and the Bank reconciliation account (clearing account): this is reflected in the G/L account definition in the chart of accounts via a new attribute “G/L Account Subtype”.
- In the bank determination (transaction FBZP), the reconciliation account is not directly assigned per house bank and payment method anymore. Instead, Account symbols (automatic bank statement posting settings) can be defined as SIP (self-initiated payment) relevant and these account symbols are available for assignment to payment methods in the bank country in a new customizing activity. This design finally harmonizes the account determination between the area of automatic payments and the area of automatic bank statement processing.
In the same release, there are two other features introduced in the bank account management:
- Individual bank account can be opened or blocked for posting.
- New authorization object F_BKPF_BEB is introduced, enabling to assign bank account authorization group on the level of individual bank accounts in BAM. The user posting to the bank account has to be authorized for the respective authorisation group.
The impact of this new design on treasury process efficiency probably makes you already excited. So, what does it take to switch from the old to the new setup?
Luckily, the new approach can be activated on the level of every single bank account in the Bank account management master data, or even not used at all. Related functionalities can follow both old and new approaches side-by-side and you have time to switch the bank accounts to the new setup gradually. The G/L account type cannot be changed on a used account, therefore new G/L accounts have to be created and the balances moved in accounting on the cut-over date. However, this is necessary only for the G/L account masters. Outstanding payments do not prevent the switch, as the payment would follow the new reconciliation account logic upon activation. Specific challenges exist in the cheque payment scenario, but here SAP offers a fallback clearing scenario feature, to make sure the switch to the new design is smooth.

How to setup virtual accounts in SAP, part III. In the previous part of this series on ‘How to setup virtual accounts in SAP’, we delved into the details of a scenario where virtual accounts are managed on GL account level using SAP FI module only. This article investigates how SAP In-house cash (SAP IHC) module can be used to manage virtual accounts in your ERP.
SAP IHC is a module that facilitates a full suite of payment factory processes. It can be seen as an intercompany position subledger with a set of fancy features like POBO payment routing, bank statement allocation, arms-length intercompany interest calculations, out of the box payment and bank statement interfaces with participants (Opco’s) etcetera.
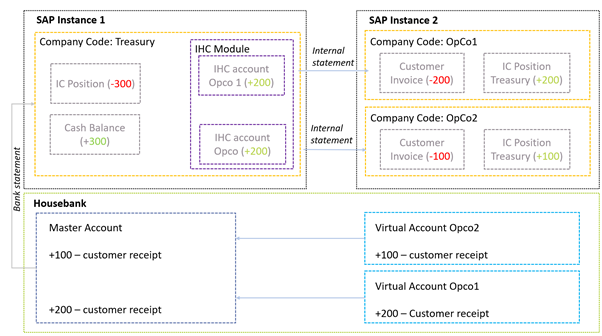
The process where virtual accounts are managed in IHC is depicted below:
In this process, we rely on a simple set of building blocks:
- In-house cash accounts to manage intercompany positions between Treasury and OpCo’s,
- GL accounts to represent external cash and the IC positions.
- Processing of external bank statements,
- Distribution of internal bank statements from IHC towards the OpCo’s ERP system,
- On the external bank statement for the Master Account, an identifier needs to be available that conveys to which virtual account the actual collection was originally credited. This identifier ultimately tells us which OpCo these funds originally belongs to and which IHC account to credit.
The idea here is that Treasury will receive the external bank statement and automatically post the receipts into the correct IHC account using the identifier. By posting items on the IHC account, the intercompany positions are updated. Then, at the end of the day, a set of internal bank statements is generated in IHC and sent through an interface to the OpCo’s ERP. The OpCo’s ERP processes these statements, clears out the customers invoices and updates the IC position with treasury.
The two major benefits of using IHC over the solution as described in the previous articles of this series are:
- The OpCo’s do not require any direct integration with the bank and can rely on internal interfacing with Treasury. Especially in companies with a fragmented ERP landscape this can become a valuable proposition.
- IHC can very aptly integrate virtual account management processes with internal netting payments, payments on behalf of (POBO) and payment in name of processes.
Implementing virtual accounts in SAP
In the explanation below we assume that the basic FI-CO settings for the company code a.o. are already in place. Also, it is by no means a complete inventory of all the settings that are required to get IHC up and running. It focusses more on the configurational parts that specifically cater for the VA requirements specifically.
Master data – general ledger accounts
Three sets of GL accounts need to be created: balance sheet accounts for the representation of the intercompany positions, one set for virtual account clearing purposes between the EBS and the IHC accounting process, and the GL account to represent the cash position with the external bank. These GL accounts need to be assigned to the appropriate company codes and can now be used to in the bank statement import process and the IHC accounting process.
In the Treasury entity we should create a single GL (per position currency) representing the IC position with all its OpCo’s because the granularity of IC position per OpCo is managed in the IHC subledger. This approach results in less of an increase of accounts in the chart of account.
Transaction code FS00
House bank maintenance bank account maintenance
In order to be able to process bank statements and generate GL postings in your SAP system, we need to maintain the house bank data first. A house bank entry comprises of the following information that needs to be maintained carefully:
- The house bank identifier: a 5-digit label that clearly identifies the bank branch.
- Bank country: The ISO country code where the bank branch is located.
- Bank key: The bank key is a separate bank identifier that contains information like SWIFT BIC, local routing code and address related data of your house bank.
Transaction code FI12
Secondly, under the house bank entry, the bank accounts can be created, including:
- The account identifier: a 5-digit label that clearly identifies the bank account.
- Bank account number and IBAN: This represents the bank account number as assigned to you by the bank.
- Currency: the currency of the bank account.
- G/L Account: the general ledger account that is going to be used to represent the balance sheet position on this bank account. Or the IC position with Treasury.
Transaction code FI12 in SAP ECC or NWBC in S/4 HANA
The idea here is that we maintain one house bank and bank account in the treasury company code that represents the Master account as held with your house bank. This house bank will have the G/L account assigned to it that represents the house banks external cash position.
In each of the OpCo’s company codes, we maintain one house bank and bank account that represents each of the IHC bank accounts as held with the treasury center. This house bank will have the G/L account assigned to it that represents the intercompany position with the Treasury entity.
Electronic bank statement settings
The electronic bank statement (EBS) settings will ensure that, based on the information present on the bank statement, SAP is capable of posting the items into the general or sub ledgers according to the requirements. There are a few steps in the configuration process that are important for this to work:
1) Posting rule construction
Posting rules construction starts with setting up Account symbols and assigning GL accounts to it. The idea here is to define at two account symbols, the first one to represent the external Cash position (BANK), and the second one for the virtual account clearing between IHC and EBS (VACLR)
A separate account symbol for customers is not required in SAP.
For the account symbol for BANK we do not assign a GL account number directly in the settings; instead we will assign a so-called mask by entering the value “+++++++++”. What this does in SAP is for every time the posting rule attempts to post to “BANK”, the GL account as assigned in the house bank account settings is used (FI12 or NWBC setting above).
For the account symbol VACLR we can assign a dedicated O/I clearing GL that is used to clear out the EBS posting against the IHC posting (more on that later). These GL accounts should have already been created in the first step (FS00).
Now that we have the account symbols prepared, we can start tying together these symbols into posting rules. We need to create 3 posting rules.
Posting rule 1 is going to debit the BANK symbol and it is going to credit VACLR symbol
Posting rule 2 is going to debit the BANK symbol and it is going to credit a BLANK symbol. The posting type however is going the be set to value 8 “Clear Credit Subledger Account”. What this setting is going to attempt is to clear out any open item sitting in the customer sub-ledger using algorithms. We will explain more on these algorithms below.
As you can imagine, posting rule 1 is applicable for the Treasury entity. Posting rule 2 is going to be used in the OpCo’s EBS process.
Transaction code OT83
2) Posting rule assignment
In the next step we can assign the posting rules to the so-called “Bank Transaction Codes” (or BTC’s like NTRF) that are typically observed in the body of the bank statements to identify the nature of the transactions.
To understand under which Bank Transaction Code these collections are reported on the statement, you typically need to carefully analyze some sample statement output or check with your bank’s implementation team for feedback.
Important to note here is to assign an algorithm to posting rule 2. This algorithm will attempt to search the payment notes of the bank statement for “reference numbers” which it can use to trace back the original customer invoice open item. Once SAP has identified the correct outstanding invoice, it can clear this one off and identify it as being paid.
If SAP is unsuccessful to automatically identify the open item, it can be manually post processed in FEBAN or FEB_BSPROC.
Transaction code OT83
3) Bank account assignment
In the last part, we can assign the posting rules assignments to the bank accounts. This way we can differentiate different rule assignments for different accounts if that is needed.
Transaction code OT83
4) Search strings
If the posting rule assignment needs more granularity than the level provided in step 2 above (on BTC level), we can setup search strings. Search strings can be configured to look at the payment notes section of the bank statement and find certain fixed text or patterns of text. Based on such search strings, we can then modify the posting behavior by for instance overruling the posting rule assignment as defined in step 2.
Whether this is required depends on the level of information that is provided by the bank in its bank statements.
Transaction code OTPM
Prepare IHC to parallel post certain bank statement items into IHC accounts
In IHC there are two ways to parallel post bank statement items into IHC accounts; as payment items or as payment orders.
This can be controlled by setting a specific function module on BTE2810. If we set function module “BKK_IHB_BASTA_IN_POST”, SAP will post an IHC payment item. If we assign “IHC_APPL_XBS_POST”, SAP will post an IHC payment order.
Additional information can be found in note 2370212.
In the subsequent part of the article we assume that we use the payment item logic.
Transaction BF42
IHC account determination from payment notes
In this section of the configuration we can determine which IHC account should be used to post the bank statement items towards using payment notes search strings.
For example, if the master account bank statement payment notes for VA collections for a particular VA contains a string “From VA 54353” and we know this belongs to IHC account “F4000EUR01”, we can setup a rule in this part of the configuration for that. This will ensure that all items on a bank statement containing this text string will get posted into IHC account F4000EUR01.
Maintenance view TBKKIHB1
Assign external BTC to posting category
Here we can identify the external banks BTC codes (NTRF, NCMZ a.o.) which are applicable for the VA movements to post into IHC. Secondly, we can identify with which posting category to post them into the IHC accounts.
Once we identified the BTC code related to our VA collections (e.g. NCMZ), we can link them to the correct posting categories here. You could use standard categories 90 (Balancing Ext. Acct (D)) for debits and 91 (Balancing Ext. Acct (C)) for credits.
Alternatively, you can setup and link your own custom posting categories here to more precisely control how our VA collections are posted into IHC. This is out of scope for this article though.
Importing and processing bank statements
We should now be in good shape to import our first statements. We could download them from our electronic banking platform. We could also be in a situation where we already receive them through some automated H2H interface or even through SWIFT. In any case, the statements need to be imported in SAP. This can be achieved through transaction code FF.5. The most important parameters to understand here are the following:
- File parameters: Here we define the filename and storage path where our statement is saved. We also need to define what format this file is going to be, i.e. MT940, CAMT.053 or one of the many other supported formats
- Posting Parameters: Here we can define whether the line items on the bank statements are going to be posted to general or sub-ledger.
- Algorithms: Here we need to set the range of customer invoice reference number (XBLNR) for the EBS Algorithm to search the payment notes for any such occurrence in a focused manner. If we would leave these fields empty, the algorithm would not work properly and would not find any open invoice for automatic clearing.
Once these parameters are maintained in the import variant, the system will start to load the statements and generate the required postings.
Transaction code FF.5 / FEBP
Display IHC account statement
Now that we successfully loaded an external bank statement, we can now check whether the items are posted into the IHC account. This can be done via transaction code F9K3. For each IHC account we can now look at the “Account Turnover” and observe all the VA collections that are posted on the account.
Transaction code F9K3
Prepare the IHC account for FINSTA statement distribution
We need to enable the distribution of internal IHC statements to the OpCo’s ERP on the IHC account master record. This can be achieved via F9K2. On the “Account Statement” tab we can adjust the statement format to “FINSTA” and dispatch type to “ALE” to ensure we are going to send FINSTA statements over an ALE connection. This would be the most common combination; other combinations can be configured and selected here as well.
Transaction code F9K2
Setting up ALE partner profiles
Finally, we can configure the system to determine to which system the FINSTA’s need to be send. This can be done in WE20, partner type GP (business partner).
Here we need to setup the outbound parameters for the FINSTA message type. An appropriate port needs to be selected that represents the ERP of the OpCo.
Transaction code WE20
Trigger the distribution of a FINSTA statement
Now that we have some transactions posted on the IHC account and the FINSTA settings enabled, we can trigger the system to send the FINSTA statements to the receiving ERP system. This can be done in F9N7.
Here we can select the correct IHC account and statement date and run the program to generate the FINSTA statement.
Once the finsta is generated and sent to the receiving ERP, it can be processed there via FEBP there.
Transaction code F9N7
Closing remarks
This is the third part of a series on how to set up virtual accounts in SAP. Please find below the other articles on this subject:

One of the main challenges treasurers face when setting up a cash pool or an in-house bank is setting an appropriate interest rate for the resulting transactions. This topic, among others, has been addressed in the recently published OECD transfer pricing guidelines on financial transactions. As expected, the OECD has left it to the taxpayers and advisors to translate the guidance into concrete methodologies for compliance. Zanders has designed a cloud-based solution that automates the entire process.
The pricing of intercompany treasury transactions is subject to transfer pricing regulation. In essence, treasury and tax professionals need to ensure that the pricing of these transactions is in line with market conditions, also known as the arm’s length principle, thereby avoiding unwarranted profit shifting.
We have has been assisting dozens of multinationals on this topic through our Transfer Pricing Solution (TPS). The TPS enables them to set interest rates on intercompany transactions in a compliant and automated way. Since its go-live, clients have priced over 1000 intercompany loans with a total notional of over EUR 60 billion using this self-service solution.
Cash Pooling Solution
In February 2020, the OECD published the first-ever international consensus on financial transactions transfer pricing. One of the key topics of the document relates to the determination of internal pooling interest rates. As a reaction, Zanders has launched a co-development initiative with key clients to design a Cash Pooling Solution that determines the arm’s length interest rates for physical cash pools, notional cash pools and in-house banks.
The goal of this new solution is to present treasury and tax professionals with a user-friendly workflow that incorporates all compliance areas as well as treasury insights into the pooling structure. The three main compliance areas for treasury professionals are:
- Ensuring that participants have a financial incentive to participate in the pooling structure. Entities participating in the pool should be ‘better off’ than they would be if they went directly to a third-party bank. In other words, participants’ pooled rates should be more favorable than their stand-alone rates. The OECD sets out a step-by-step approach to improve interest conditions for participating entities to distribute the synergies towards the participants.First, the total pooling benefit should be calculated. This total pooling benefit is the financial advantage for a group compared to a non-pooled cash management set-up. The total pooling benefit can be broken down into a netting benefit and an interest rate benefit. The netting benefit arises from offsetting debit and credit balances. The interest rate benefit arises from more beneficial interest rate conditions on the cash pool or in-house bank position, compared to stand-alone current accounts.
Once the total pooling benefit has been calculated, it should be allocated over the leader entity and the participating entities. Therefore, a functional analysis of the pooling structure should be made to identify which entities contribute most in terms of their balances, creditworthiness and the administration of the pool. The allocated amount should be priced into the interest rates. A deposit rate will thus receive a pooling premium. A withdrawal rate will incorporate pooling discount. - Ensuring a correct tax treatment of the cash pool transactions. Pooling structures are primarily in place to optimize cash and liquidity management. Therefore, tax authorities will expect to see the balances of cash pool participants fluctuate around zero. Treasury professionals should monitor positions to prevent participants from having a structural balance in the pool. If the balance has a longer-term character, tax authorities can classify such pooling position as a longer-term intercompany loan. Consequently, monitoring structural balances can lower tax risk significantly.
- Appropriate documentation should be in place for each time treasury determines the pooling interest rates. The documentation should include the methodology as well as all specifics of the transfer pricing analysis. Proper documentation will enable the multinational to substantiate the interest rates during tax audits.
Multinationals are confronted with a significant compliance burden to comply with these new guidelines. Different hurdles can be identified, ranging from access to the appropriate market data to a considerable and recurring time investment in determining and documenting the internal deposit and withdrawal rates for each pooling structure.
It remains to be seen how auditors treat these new guidelines, but the recent increased focus on transfer pricing seems to indicate that this will be a topic that may need additional attention in the coming years.
Zanders Inside solutions
In order to support treasury and tax professionals in this area, Zanders Inside launched its cloud-based Cash Pooling Solution. This solution will focus on each of the three compliance areas as described above. In addition, the solution leverages a high degree of automation to support the entire end-to-end process. It offers a cost-effective alternative for the manual process that multinationals go through. Please watch our video showing how the Cash Pooling Solution tackles the challenge of OECD compliancy.

Intraday bank statement (IBS) reporting, a service that your house bank can provide your company, enables your cash manager to understand which debits and credits have cleared on your bank accounts throughout the current day. We explain how to implement it in SAP.
Intraday Bank Statements offers a cash manager additional insight in estimated closing balances of external bank accounts and therefore provides the information to manage the cash more tightly on the company’s bank accounts.
Compared to intraday bank statement reporting, end-of-day (EOD) bank statement reporting is only available the next calendar day. The information therefore always comes too late to be meaningful for cash management decisions – apart from providing an opening bank balance for the next day.
Business rationale behind IBS reporting
So, why would a Treasury typically start implementing IBS reporting in its cash management processes?
- Cash visibility: In general, IBS reporting will provide your cash management function an additional tool to improve cash visibility. Achieving cash visibility intrinsically might not be a goal of its own, but by achieving visibility, the cash manager now has information to make certain economically relevant decisions in certain situations.
- Managing cash: By creating cash visibility, we now have an opportunity to manage cash on our accounts in an intelligent way. In case we estimate a positive closing balance, we could decide to invest this surplus in, for example, a money market fund or overnight deposit to earn some return. In case of an expected deficit, we need to fund the account to ensure no EOD negative position happens. This can be achieved by transferring funds from another bank account (in same currency), swapping funds from another bank account (in different currency), or funding it from, for example, a facility drawdown.
- Reduced risk of delinquency: As we now implemented a process to increase control over our bank balances, we now have less chance of e.g. rejected payments due to insufficient available funds and therefore less chance of being delinquent on certain obligations to pay.
- Reduced requirements on overdraft facility: By reducing the chance of having insufficient funds on our account, the overdraft facility requirements can also be reduced.
- Timely clearing of open items: IBS can also be used to clear off open items throughout the day, as opposed to only rely on clearing from EOD statements. Benefit here is that KPI’s like days sales outstanding (DSO) will improve and that reconciliation effort is spread out more through time.
This article will now only focus on the cash management side; the IBS reconciliation process may be discussed another time. If you like to know more about bank reconciliation using intraday statements, feel free to reach out to us. We have a pre-developed solution that we can implement at your side.
IBS concepts
There are a few design considerations that need to be looked at before attempting to implementing this solution in SAP.
- Reporting formats: MT942, CAMT.052, BAI2 are formats that can be imported by SAP standard and are also supported by most banks to some degree. There may be some informational or structural benefits that one format has over the other which should be considered in the design.
- Reporting frequency: It is possible to agree with the bank on reporting frequencies of IBS. Ten times through working hours? Or one time only, half an hour before the payment cut-off time? In most cases, the bank will charge a fee for every statement it sends, so this should be considered in the design.
- Delta vs cumulative reporting: As it is possible for the bank to report multiple times a day, it is important to understand how the data is reported. There are two methodologies. In case of delta reporting, only new transactions are reported, relative to the previously distributed IBS. Alternatively, there is cumulative reporting, where all booked items are reported on the statement throughout the day. Delta reporting typically means that the data in your SAP system needs to be appended for every new IBS. Cumulative reporting means that every time you process an IBS in SAP, the data needs to be rebuilt completely.
- Data integration: The intraday data as provided by the bank needs to be integrated with already existing cash-relevant data to compile a proper reporting view of estimated closing balance for the day. This needs to happen in the cash management module of SAP (FF7* reports). The design of the structure of the cash management report should be carefully aligned with the liquidity structure (i.e. ZBA structure).
- Prevention of duplications: Integrating the intraday data with existing data should be designed with data duplication in mind. It is paramount that the data on the same cash movement is not counted twice from two sources and data duplication should always be prevented while designing the solution. For example, if we are not careful, a payment flow can be included in the report twice, once from the intraday statement when it is debited and once from the payment in transit GL in the SAP administration. This would result in a skewed estimated closing balance.
Ultimately, the goal here is to receive and upload intraday bank statements throughout the day and to load cash movement data into your SAP system. This cash-relevant data needs to be made visible through the cash management reports so that the cash manager can better estimate EOD balances and make intelligent decisions related to funding accounts or investing excess funds.
Setting up Intraday Bank Statement reporting in SAP
We will now go into detail on how to setup intraday statement reporting and assume that the basic FI-CO settings for e.g. the company code are already in place. We also assume that the EOD bank statement process has already been implemented. To learn how to set this up, please read this article on virtual accounts.
Cash Management
It is important to understand that intraday statement data is converted into so called ‘Memo Records’ once loaded in SAP. These memo records can be visualized in the cash management reports (FF7AN/FF7BN). We will now explain the necessary settings on the cash management report section to ensure that the intraday data can be made visible in these cash management reports.
Define planning levels
First, we need to define a planning level; a label that is assigned to all cash movements as reported on the intraday statement. The planning level is used to structure the data in the cash management reports.
The level is a two-digit label, freely definable. We set it to C1.
The sign we need to set to blank as cash movements reported on this level can be both positive and negative.
The source will be ‘BNK’. This ensures that this planning level is reported on both ‘cash position’ and ‘liquidity forecast’ in the FF7AN/FF7BN reports.
The descriptions are freely definable. We define it as ‘INTRADAY’.
Define planning types
A planning type is a label under which a ‘memo record’ is stored on the SAP database. A planning type is subsequently linked to a ‘planning level’ to ensure the underlying data can be visualized in the cash management reports.
First, we define the planning type label: we set it identical to the planning level; C1 and link it to planning level C1.
We need to define an archiving category. This defines the data retention period of the memo records. If the period is exceeded and the reorganization program is executed; the memo record data will be cleansed.
The auto-expiry option defines whether the memo record will expire automatically and becomes invisible in the cash management report output. This needs to be enabled. The idea here is that the intraday statement data will be superseded by the EOD statement data once this is loaded after midnight next calendar day. To ensure we do not double count identical cash movements from both sources, the intraday data needs to be expired.
Also, a number range and description need to be entered. No specific functional considerations are needed here.
Define grouping and maintain headers
A ‘grouping’ is a label that is used to structure the cash management report data in a meaningful manner for the user. The grouping can be selected in the cash management reports and is going to dictate how the data is shown to the user.
We will configure a grouping ‘CASHPOS’.
Maintain structure
Under the grouping we can now maintain the structure of the cash management data. For our report, we are including two components. The first component is the planning level., the second will be the GL account under which we record our bank account balances. This is the GL account we typically maintain in the house bank account data (table T012K, transaction FI13, NWBC).
For the first component we are going to add an entry as follows:
The grouping we set to ‘CASHPOS’.
The type we set to ‘E’ for planning level. Now we can define a planning level that is going to be relevant to our cash management report output.
We set the selection to C1 (our intraday planning level we defined earlier).
This setting will ensure all cash management data as stored under C1 planning level is going to be selected in the report output.
For the second component we are going to add an entry as follows:
The grouping we set to ‘CASHPOS’.
The type we set to ‘G’ for GL Account. Now we can define the bank GL account that is going to be relevant for our cash management report output.
The selection we are going to set to a GL account is saved in our bank account entry in table T012K.
This setting will ensure all cash management data as stored under the GL account and relevant for our bank account will be selected in the report output.
The combination of these two lines is going to ensure that we will only see the C1 data for our one bank account. We can add multiple lines to increase the scope of the reports output.
Importing and processing bank statements
We should now be in good shape to import our first intraday statements. We could download these statements from our electronic banking platform. Also, we could be in a situation where we already receive them through some automated H2H interface or even through SWIFT. In any case, the statements need to be imported in SAP. This can be achieved through e.g. transaction code FF.5. The most important parameters to understand here are the following:
- File parameters: Here we define the filename and storage path where our statement is saved. We also need to define what format this file is going to be; MT940, CAMT.053, or one of the many other supported formats
- Posting parameters: Here we can define whether the line items on the bank statements should be posted to general or sub-ledger. This section is not relevant for intraday statements, as SAP does not support GL postings and reconciliation from intraday statements out of the box.
- Cash management: This is the most important section, specifically for intraday statement processing. The fields and tick boxes control a few parameters:
- A/CM payment advice: This needs to be enabled to ensure that SAP creates the memo record data from the intraday statements.
- B/Summarization: This tick box controls whether a single memo record will be created for the whole delta balance as reported on the statement or for each reported debit and credit on the statement. If high volumes are expected, summarization can reduce the number of memo records and improve performance a bit. Obviously, it does reduce the data granularity.
- C/Planning type: Here we set the planning type under which the memo records are going to be recorded. In our sample we set this to C1.
- D/ Account balance: This needs to be set if we are loading intraday statements.
- Algorithms: Here we need to set the range of customer invoice reference number (XBLNR) for the electronic bank statement (EBS) algorithm, to search the payment notes for any such occurrence in a focussed manner. If we would leave these fields empty, the algorithm would not work properly and would not find any open invoice for automatic clearing. This section is not relevant for intraday statements as SAP does not support GL postings and reconciliation from intraday statements out of the box.
Once these parameters are maintained in the import variant, the system will start to load the statements and generate the required postings.
Transaction code: FF.5
Now we can check if the memo records are updated in table FDES.
Subsequently, we can check the FF7BN report for grouping ‘CASHPOS’ and observe the output.


