VIVAT: One tool for risk management and Solvency II reporting

The insurance company VIVAT was looking for a flexible tool to perform standard model calculations according to Solvency II directives. It decided to use the existing risk-initiated ALM tool which led to some challenges but which now offers various advantages.


VIVAT is a commercial financial service provider with insurance brands whose names are more familiar than that of the parent company: REAAL, Zwitserleven, Zelf, Route Mobiel (roadside assistance), and Proteq Dier & Zorg (insurance for pets). ACTIAM is the asset manager. On its website, the insurance company gives the impression of being a strong socially-motivated company; the very different brands together have the goal of helping people increase their empowerment. In the summer of 2015, VIVAT was taken over by Anbang Insurance Group, which is well known for its strong technology-based services.

In 2009, the Solvency II directive was implemented as a harmonious European regulatory framework for insurers, with the goal of insurers having enough capital in reserve to prevent bankruptcy. Since 2011, the European Authority for Insurance and Company Pensions (EIOPA) regulates these insurance companies. The starting date at which the Solvency II directives actually came into force was changed several times. Finally, the directives became effective on 1 January 2016.

ALM tool

VIVAT is a commercial financial service provider with insurance brands whose names are more familiar than that of the parent company: REAAL, Zwitserleven, Zelf, Route Mobiel (roadside assistance), and Proteq Dier & Zorg (insurance for pets). ACTIAM is the asset manager. On its website, the insurance company gives the impression of being a strong socially-motivated company; the very different brands together have the goal of helping people increase their empowerment. In the summer of 2015, VIVAT was taken over by Anbang Insurance Group, which is well known for its strong technology-based services.

In 2009, the Solvency II directive was implemented as a harmonious European regulatory framework for insurers, with the goal of insurers having enough capital in reserve to prevent bankruptcy. Since 2011, the European Authority for Insurance and Company Pensions (EIOPA) regulates these insurance companies. The starting date at which the Solvency II directives actually came into force was changed several times. Finally, the directives became effective on 1 January 2016.

From that date, VIVAT Insurances also had to be Solvency II-compliant. The company needed a flexible tool with which it could calculate required capital in line with the Solvency II directive. The solution was found in an existing risk-initiated asset & liability management (ALM) tool. “From a risk standpoint, we wanted certain management information such as interest risk sensitivity,” recounts Erwin Charlier, head of modeling at VIVAT. “With the ALM tool, we were able to access information which gave us better insight into the risks. Then we thought: since we already have the tool, let’s expand it to the Solvency II-standard model. So we now use it to calculate the figures which go to the DNB and which are in our annual report.”

The insurance company VIVAT was looking for a flexible tool to perform standard model calculations according to Solvency II directives. It decided to use the existing risk-initiated ALM tool which led to some challenges but which now offers various advantages.

Stakeholder management

With this increased scope, the tool has become a bigger and more widely applicable model for VIVAT. Besides the different components for risk reporting, other departments now also use the tool. “For example, for valuation of certain assets by our asset manager and by Balance Sheet Management, for controlling the balance sheet,” says Kees Smit, manager of risk balance sheet reporting at VIVAT and thereby senior user and ‘owner’ of the tool. “The tool is used for management as well as for accountability and therefore fulfills a central role in the model landscape for risk management.”

With one owner and several ‘clients’, the ALM tool demands a great deal of internal co-ordination and good ‘stakeholder management’. “Priorities for the tool are carefully agreed and weighed up with the various departments”, says Smit. “Sometimes that leads to difficult decisions, but since we manage the tool ourselves and a small dedicated team handles it, we always find a solution.” At the same time there also arose a need for structure and process management. Charlier says: “We had insufficient capacity for this internally and so we looked around externally and came across Zanders.”

Request for change

Adding extra functions to the ALM tool starts with a Request for Change (RfC). The tool’s functionalities have to be documented in this as clearly as possible. “

Zanders played an important role in this process.

Erwin Charlier, head of modeling at VIVAT.

quote

“It is important that the RfC is of high quality, so that we know what we can do with it and what has to happen to the tool. We need people who know down to the last detail what its intention is, people who model or implement, and if all goes to plan it is part of a release process and then users can actually start using it.”

Where the tool is solely used within the risk function to generate certain information, it can be set up according to your own pragmatic ideas. “But as soon as it becomes a formal tool – which is used for external reporting – then you have to formalize all sorts of things,” says Charlier. “To be in control you no longer want that degree of flexibility. And that then means other people get involved.” On top of this, the department that delivered the Solvency II-reporting then became the senior user. This led to other demands and wishes because the intent of the tool changed. “Initially, the tool was not set up to be our Solvency II-tool. If you decide to do that later, the organization has to ensure it has the people and the means to achieve a high standard,” says Charlier.

Process in phases

“One of the goals of the project was to have the change process take place in a very structured way,” says Zanders consultant Mark van Maaren. “This means a clear standardized process which is then followed.” Changes that other users don’t know about can cause problems. “The process comprises different phases,” adds Zanders’ Stef van Wessel. “From development, testing, acceptance, and production. In order for everything to run smoothly, the previous phase has to be completed before you start the next one. In the production phase only the owner and his team are involved. In other words: the people who have written the code can no longer change it when it’s in production – to avoid different changes by people in different places having a negative impact on one another.”

In the first phase of the project, the challenge was to make the tool Solvency II-compliant. Then the wish-list, which was not dependent on the required Solvency directives, was added to the tool. Completion is planned for the end of 2016. Charlier explains: “Solvency, though, has been faced with quite a few forward-looking perceptions, and these also have had to be taken into consideration.” Van Wessel adds: “But by standardizing the process, separating the roles within it, and setting up authorizations, many problems can be mitigated.” Over the past year that has been accomplished: a control framework which complies with the Solvency II-directives.

Division of labor

Initially, the management of the tool was the responsibility of Charlier’s modeling department. In the second phase of the project, it was decided to transfer a number of components to the IT department. “Each application has its own conditions and requirements, but we do not come up to the mark in all areas and to the standard IT would like,” Charlier related. “We have a great model, but perhaps we could improve a few things under the bonnet. For example: employees have certain skills, but the question is if this is an efficient use of resources. On the one hand, there is a heavy data component; via communication with other databases you retrieve all sorts of information to calculate with and then transfer to various areas. Setting up the data and reporting side takes a lot of time and could easily be done by IT. But the core, the calculation center, is for me typically something for the modeling department: how do you value the assets on your balance sheet, how do you handle yield curves in interest-rate risk measurement?” IT is positive about the division of roles. And we want to use our human capital as efficiently as possible.

Double focus

A huge advantage of a tool developed in-house is that it offers VIVAT a lot of flexibility. “In addition, the tool is now completely in tune with our own wishes,” says Smit. “Under our own management, changes in the tool can be made quickly. That’s nice, since the required functionalities within risk management are constantly changing.” It also offers ‘double focus’ in one functionality. Charlier says: “That way we have developed the knowledge and ability to be able to take a detailed look under the hood. If something unexpected comes out of the model, we can see where it comes from. The only thing is that it takes some effort from the organization.”

The alternative for the insurer was to use separate tools for the various reports. “But the disadvantage of this is that you can have inconsistency problems which you have to reconcile,” Van Maaren explains. “For example, sometimes companies buy platforms and then expand on them – you see all sorts on the market. The ready-made package you buy which you can use straight away just doesn’t exist.”

Future challenges

Will the model be further expanded with more functions? Charlier is unsure: “As a real ALM tool I would like to be able to do more on the liability side. The liability side is included, but is covered by other sources of data. The focus of the tool is now more on the asset side; the L in ALM is not so prominent in the tool.”

In the future, Charlier foresees a number of great challenges. “I find the role split and efficient sharing of resources a very important focus point. Moreover, regulations won’t stand still and we will have to adapt to them,” he says. In the first year that insurers have to comply with the requirements of Solvency II, the solvency ratios are quite volatile. “But new demands give you, as an organization, the chance to adapt to the latest insights. It would be a lost opportunity to not act upon these. What would be really nice is if you could use the tool to project a number of years into the future. For example with stress tests or an operational plan to look further into the future.”

How has Zanders supported VIVAT?

  • Project management of the implementation of the ALM tool, including stakeholder management and the coordination of transferring tasks and responsibilities to the IT organization.
  • Supporting and coordinating the development of functional specifications.
  • Supporting user acceptance testing and the testing of functional specifications.
  • Documenting the ALM tool.
  • Reviewing and improving the risk appetite statement.
  • Enhancing interest-rate hedging policies, methodology, and processes.
  • Developing a Solvency II compliant investment policy.

Would you like to know more? Contact us today.

Customer successes

View all Insights

The Matching Adjustment versus the Volatility Adjustment

September 2015
3 min read

What is their impact and what are the main differences


On April 30th 2014, the European Insurance and Occupational Pensions Authority (EIOPA) published the technical specifications for the preparatory phase towards Solvency II. The technical specifi cations on the long-term guarantee package offer the insurers basically two options to mitigate ‘artificial’ fluctuations in their own funds, the Volatility Adjustment and the Matching Adjustment. What is their impact and what are the main differences between these two measures?

Solvency II aims to unify the EU insurance market and will come into effect on January 1st 2016. The technical specifications published by EIOPA will be used for interim reporting during 2015.

Although the specifications are not yet finalized, it is unlikely that they will change extensively. The technical specifications consist of two parts; part one focuses on the valuation and calculation of the capital requirements and part two focuses on the long-term guarantee (LTG) package. The LTG package was agreed upon in November 2013 and has been one of the key areas of debate in the Solvency II legislation.

Artificial volatility

The LTG package consists of regulatory measures to ensure that short-term market movements are appropriately treated with regards to the long-term nature of the insurance business. It aims to prevent ‘artificial’ volatility in the ‘own funds’ of insurers, while still reflecting the market consistent approach of Solvency II. When insurance companies invest long-term in fixed income markets, they are exposed to credit spread fluctuations not related to an increased probability of default of the counterparty.

These fluctuations impact the market value of the assets and own funds, but not the return of the investments itself as they are held to maturity. The LTG package consists of three options for insurers to deal with this so-called ‘artificial’ volatility: the Volatility Adjustment, the Matching Adjustment and transitional measures.

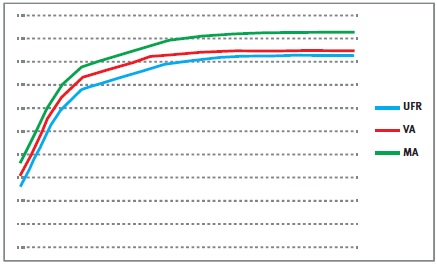
Figure 1

The transitional measures allow insurers to move smoothly from Solvency I to Solvency II and apply to the risk-free curve and technical provisions. However, the most interesting measures are the Volatility Adjustment and the Matching Adjustment. The impact of both measures is difficult to assess and it is a strategic choice which measure should be applied.

Both try to prevent fluctuations in the own funds due to artificial volatility, yet their requirements and use are rather different. To find out more about these differences, we immersed ourselves into the impact of the Volatility Adjustment and the Matching Adjustment.

The Volatility Adjustment

The Volatility Adjustment (VA) is a constant addition to the risk-free curve, which used to calculate the Ultimate Forward Rate (UFR). It is designed to protect insurers with long-term liabilities from the impact of volatility on the insurers’ solvency position. The VA is based on a risk-corrected spread on the assets in a reference portfolio. It is defined as the spread between the interest rate of the assets in the reference portfolio and the corresponding risk-free rate, minus the fundamental spread (which represents default or downgrade risk).

The VA is provided and updated by EIOPA and can differ for each major currency and country. The VA is added to the liquid part of the risk-free zero-coupon rates, i.e. until the so-called Last Liquid Point (LLP). After the LLP, the curve converges to the UFR. The resulting rates are used to produce the relevant risk-free curve.

The Matching Adjustment

The Matching Adjustment (MA) is a parallel shift applied to the entire basic risk-free term structure and serves the same purpose as the VA. The MA is calculated based on the match between the insurers’ assets and the liabilities. The MA is corrected for the fundamental spread. Note that, although the MA is usually higher than the VA, the MA can possibly become negative. The MA can only be applied to a portfolio of life insurance obligations with an assigned portfolio of assets that covers the best estimate of the liabilities.

The mismatch between the cash flows of the assets and the cash flows of the liabilities must not be a material risk in relation to the risks inherent to the insurance business. These portfolios need to be identified, organized and managed separately from other activities of the insurers. Furthermore, the assigned portfolio of assets cannot be used to cover losses arising from other activities of the insurers.

The more of these portfolios are created for an insurance company, the less diversification benefits are possible. Therefore, the MA does not necessarily lead to an overall benefit.

Differences between VA and MA

The main difference between the VA and the MA is that the VA is provided by EIOPA and based on a reference portfolio, while the MA is based on a portfolio of the insurance company.

Other differences include:

  • The VA is applied until the LLP, after which the curve converges to the UFR, while the MA is a parallel shift of the whole risk-free curve;
  • The MA can only be applied to specifically identified portfolios;
  • The VA can be used together with the transitional measures in the preparatory phase, the MA cannot;
  • The MA has to be taken into account for the calculation of the Solvency Capital Requirement (SCR) for spread risk. The VA does not respond to SCR shocks for spread risks.

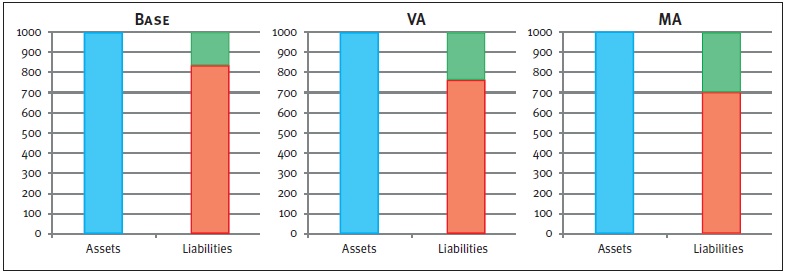
Figure 2: Graphical representations of balance sheets. The blue box represents the assets, the red box the liabilities, and the green box the available capital.

The impact of the VA and MA is twofold. Both adjustments have a direct impact on the available capital and next to this, the MA impacts the SCR. As a result, the level of free capital is affected as well. While the exact impact of the adjustments depends on firm-specific aspects (e.g. cash flows, the asset mix), an indication of the effects on available capital as well as the SCR is given in Figure 2. Please note that this is an example in which all numbers are fictitious and used merely for illustrative purposes.

Impact on available capital

Both the VA and the MA are an addition to the curve used to discount the liabilities, and will therefore lead to an increase in the available capital. The left chart in Figure 2 shows the Base scenario, without adjustment to the risk-free curve. Implementing the VA reduces the market value of the liabilities, but has no effect on the assets. As a result, the available capital increases, which can be seen in the middle chart.

A similar but larger effect can be seen in the right chart, which displays the outcome of the MA. The larger effect on the available capital after the MA compared to the VA is due to two components.

  1. The MA is usually higher than the VA, and
  2. the MA is applied to the whole curve.
Impact on the SCR

The calculation of the total SCR, using the Standard Formula, depends on several marginal SCRs. These marginal SCRs all represent a change in an associated risk factor (e.g. spread shocks, curve shifts), and can be seen as the decrease in available capital after an adverse scenario occurs. The risk factors can have an impact on assets, liabilities and available capital, and therefore on the required capital.

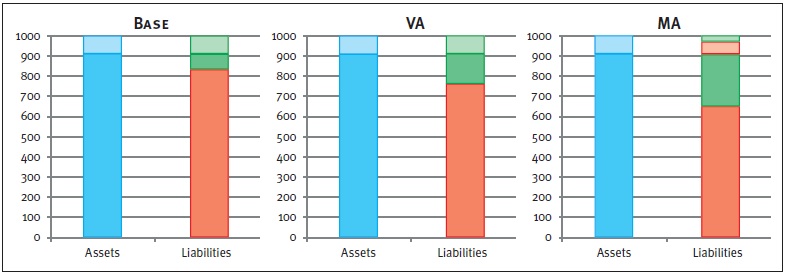
Take for example the marginal SCR for spread risk. A spread shock will have a direct, and equal, negative impact on the assets for each scenario. However, since a change in the assets has an impact on the level of the MA, the liabilities are impacted too when the MA is applied. The two left charts in Figure 3 show the results of an increase in the spread, where, by applying the spread shock, the available capital decreases by the same amount (denoted by the striped boxes).

Figure 3: Graphical representations of balance sheets after a positive spread shock. The lined boxes represent a decrease of the corresponding balance sheet item. Note that, in the MA case, the liabilities decrease (striped red box) due to an increase of the MA.

Hence, the marginal SCR for the spread shock will be equal for the Base case and the VA case. The right chart displays an equal effect on the assets. However, the decrease of the assets results in an increase of the MA. Therefore, the liabilities decrease in value too. Consequently, the available capital is reduced to a lesser extent compared to the Base or VA case.

The marginal SCR example for a spread shock clearly shows the difference in impact on the marginal SCR between the MA on the one hand, and the VA and Base case on the other hand. When looking at marginal SCRs driven by other risk factors, a similar effect will occur. Note that the total SCR is based on the marginal SCRs, including diversification effects. Therefore, the impact on the total SCR differs from the sum of the impacts on the marginal SCRs.

Impact on free capital

The impact on the level of free capital also becomes clear in Figure 3. Note that the level of free capital is calculated as available capital minus required capital. It follows directly that the application of either the VA or the MA will result in a higher level of free capital compared to the Base case. Both adjustments initially result in a higher level of available capital.

In addition, the MA may lead to a decrease in the SCR which has an extra positive impact on the free capital. The level of free capital is represented by the solid green boxes in Figure 3. This figure shows that the highest level of free capital is obtained for the MA, followed by the VA and the Base case respectively.

Conclusion

Our example shows that both the VA and the MA have a positive effect on the available capital. Apart from its restrictions and difficulties of the implementation, the MA leads to the greatest benefits in terms of available and free capital.

In addition, applying the MA could lead to a reduction of the SCR. However, the specific portfolio requirements, practical difficulties, lower diversification effects and the possibility of having a negative MA, could offset these benefits.

Besides this, the MA cannot be used in combination with the transitional measures. In order to assess the impact of both measures on the regulatory solvency position for an insurance company, an in-depth investigation is required where all firm specific characteristics are taken into account.

Fintegral

is now part of Zanders

In a continued effort to ensure we offer our customers the very best in knowledge and skills, Zanders has acquired Fintegral.

Okay

RiskQuest

is now part of Zanders

In a continued effort to ensure we offer our customers the very best in knowledge and skills, Zanders has acquired RiskQuest.
Okay

Optimum Prime

is now part of Zanders

In a continued effort to ensure we offer our customers the very best in knowledge and skills, Zanders has acquired Optimum Prime.

Okay
This site is registered on wpml.org as a development site.