
TP Vision took over Philips’ TV business on 1st April, 2012. The joint venture, with Chinese/Taiwanese TPV and Dutch Philips as stakeholders, has taken many important steps since then to create a healthy and profitable TV company. The transformation process brought a lot of changes, including many for the finance department.
TP Vision was founded on the combined assets and skills of two prominent players in the TV business: based in Amsterdam, it is 70% owned by TPV and 30% by Royal Philips Electronics. TP Vision is the exclusive brand licensee of Philips TV in Europe, Russia, Middle East, Brazil, Argentina, Uruguay, Paraguay, and selected countries in Asia-Pacific, excluding China, India, and North America. It is now engaged in developing, manufacturing, and marketing Philips branded TV sets.
“TP Vision is creating a profitable and focused TV company by combining the design expertise and innovative Philips TV heritage with the operational excellence, flexibility, and speed of TPV,” explains Simon Karregat, head of treasury and credit & risk management at TP Vision. Having worked for Philips as head of the dealing room, Karregat really understands the new company’s TV business, which was previously part of Philips Consumer Lifestyle.
He continues: “As fierce competition in the TV market put pressure on margins, TVs were an unprofitable business over the last couple of years. We intend to change this by creating a lean and agile company that is solely focused on TVs.”
Separate entity
To make TP Vision successful and profitable, the company needs to go through a comprehensive transformation process, which had already started long before the official birth of the joint venture on 2nd April, 2012. “In preparation of the joint venture, we separated the TV business from Philips Consumer Lifestyle first. From 1st January, 2012 we reported ‘TV’ as a separate entity,” Karregat says. “It is important for treasury activities that such a fundamental change takes place in a smooth and controllable way. The early measures ensured a hassle-free transition when TP Vision finally took over the TV business from Philips and operated as an independent stand-alone company as of 1st April, 2012.”
Decoupling from a big corporate like Philips was, and still is, a complex process for TP Vision. The disentanglement of the TV business from Philips was a tough challenge because it had been fully integrated into the Philips Consumer Lifestyle business all over the world. This applied to all areas including sales, finance, and IT. One of the most important constraints in the disentanglement was that the operation had to be realized within a very short time frame but with strict cost management. From the beginning of the joint venture, the top priority was cost efficiency and continuing to reduce the breakeven point of the global company. Additionally, achieving Philips’ target gross margin had to be achieved in a highly competitive TV market. This was done by closely managing product costs while selling an improved mix of products (more high-end and larger screen sizes).
New banking infrastructure
To overcome all the challenges related to finance, TP Vision engaged Zanders to support them in setting up a new treasury organization and separating the television business from Philips’ integrated in-house banking structure. This meant that, in a short time frame, not only did Philips’ treasury have to implement and test a new banking infrastructure, but also a new payment infrastructure and a treasury management system (TMS).
At the beginning, TP Vision could take over some elements from Philips and use them right away, such as production units, IT infrastructure, and distribution centers. Other solutions and systems needed to be set up from scratch. “Because of the time pressure, the complexity of the process, and the kernel versions in the original system, we decided to retain the Philips kernel for the time being and to migrate to the leaner TPV kernel later,” Karregat explains. The kernel is the main component of most computer operating systems and thus builds the backbone of most business and finance applications. Karregat continues: “We couldn’t copy the treasury system from Philips because the payment infrastructure of TPV is different.” The company selected IT2 as their TMS. In some countries, however, certain processes (e.g., invoice booking, entering payment proposals, reporting) are outsourced to third parties, such as Infosys. Karregat adds: “We were fully aware that such a complex migration process would cause some initial difficulties as people had to get used to a completely new way of working. This took some time and required a lot of training.”
Bank selection
The selection of a banking partner was another important step in the joint venture’s financial formation process. Karregat says: “After a thorough selection procedure, two banks remained on the list of bank candidates. As we didn’t want to delay our transformation process until the final signing of a contract with one of the two candidates, we started to set up our internal financial structure simultaneously. We created two groups to work on this: one for each of the two banks.”
Karregat had to consider many different factors when building TP Vision’s new treasury, including credit limits and FX limits: “You have to operate differently, with different interfaces and different restrictions for the different countries. We chose Bank of America as our bank because of their global network, and they are providing the necessary limits for us. However, as they do not offer services in all the countries that we operate in, another party sometimes has to be involved. Multiple banks mean multiple sources, whereas with one bank you can use just one banking tool. It all looks standardized but, in reality, it is not: banks have their own policies and procedures, their own formats. Your treasury system must be able to absorb this.”
TP Vision decided to take over the in-house banking concept of Philips. Karregat explains: “With in-house banking you can manage your own internal payments, it provides a better insight into your liquidity, and you can better manage and fund your entities. It is definitely very efficient.”
Zanders assisted Philips in the set up of a stand-alone treasury for the new joint venture. In order to disentangle the treasury and cash management operations for TV, the assistance included:
- The set-up and implementation of a global bank account infrastructure;
- The creation and implementation of a cash management structure;
- Arrangement of local working capital facilities for entities with legal restrictions on setting up cash pools;
- The set-up of an in-house bank;
- The set-up of a cash flow forecasting methodology company-wide;
- Selection and implementation of a TMS;
- The identification and implementation of a hedge strategy;
- The set-up of a proper treasury policy, processes and procedures
Fewer organizational layers
As a big organization, Philips is used to working according to clearly defined standards. However, as they don’t fit TP Vision’s lean treasury structure, the joint venture is now creating its own processes and standards.
“Adequate cash-flow forecasting is essential for our company and we have to manage our treasury exposures thoroughly. The smaller the company, the bigger the risks. We definitely have to trigger a change in employee mindsets. They have to pay more attention to treasury and cash-flow forecasting than before,” says Karregat. In addition, people are more involved in treasury now as there are fewer organizational layers. “For example, we are now much closer to the countries’ treasury. Therefore, treasury has become much more tangible for them. This effect is perceptible throughout the entire organization.”
New IT infrastructure
In parallel, preparations to migrate to a new IT system are in full swing. TP Vision will use the Philips’ IT system for 12 months after the disentanglement and will get its own IT infrastructure in place very soon. This transition will affect both the treasury management system and payment system. “To prepare for this fundamental change, we are running numerous workshops to identify all possible impacts and to find appropriate solutions,” says Karregat.
Karregat concludes: “We have encountered many difficult challenges, but have now reached a phase where many ‘to do’ items have disappeared from the list. While a major renovation was going on in the back of the store, the front needed to remain open and give the impression that there was nothing going on. I believe that we have been successful in achieving this.”

Hybrids, Expensive Debt or Cheap Equity?
Hybrids are financial instruments that combine certain elements of debt and equity. Examples are preferred equity, convertible bonds, subordinated debt and index-linked bonds. For the issuers, hybrid securities can combine the best features of both debt and equity: tax deductibility for coupon payments, reduction in the overall cost of capital, and a strengthening of senior credit ratings.
This article describes the reasons behind the increased interest among corporates in using hybrid instruments to optimize their capital structure and the impact of hybrids on the WACC and shareholder value. It also takes a look at treatment by accountants, tax regulation and rating agencies.
Over €8bn of capital was raised in 2005 by corporates in Europe in the hybrid category, according to The Treasurer, April 2006. Over the past decade, it has primarily been financial institutions who have been frequent issuers of hybrids to optimize their capital structure. However, corporates are now also increasingly tapping this segment.
This growing interest can be explained both by new insights regarding the accounting and rating benefits of these instruments, as well as an increased appetite by investors who are drawn by the opportunity to make an additional yield in the current low-interest rate and credit spreads environment.
Accounting Treatment
A hybrid instrument can be structured to achieve equity treatment from an IFRS perspective. IAS 32 (Financial Instruments: Disclosure and Presentation) requires a hybrid to have optional payment for all coupons and that the instrument should have no defined economic maturity.
If the instrument is structured to achieve equity accounting, the coupon is accounted for as a ‘preferred’ dividend distribution. This way, there is no interest expense and the reported net income is not affected. Likewise, earnings per share (EPS) are unchanged as for the purposes of the EPS calculation, preferred dividends are deducted from earnings.
However, if the instrument is treated as equity there is no IAS 39 (Financial Instruments: Recognition and Measurement) hedge accounting available for any associated swaps. The resulting P&L volatility may lead issuers to choose to have the instruments structured so that they are accounted for as debt.
View of Rating Agencies
Credit rating agency Moody’s published its Tool Kit for Assessing Hybrid Securities, a framework to determine the relative debt and equity characteristics of hybrid instruments, in December 1999. Since then, the rating agency has assessed hundreds of instruments, positioning them along the debtequity continuum in baskets from A (more debtlike) to E (more equity-like). Each basket on this continuum translates into the following percentages of equity and debt for the purpose of financial ratio calculations:
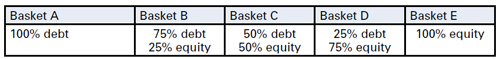
To illustrate, a €100m hybrid placed by Moody’s in Basket D will result in a €75m increase in equity and a €25m increase in debt. All relevant ratios, which include either debt or equity, will be adjusted accordingly by the agency.
In February 2005, Moody’s announced its revised methodology for the category, significantly increasing the acknowledgement of the equity-like features of the instruments and rewarding higher equitycredit to structures which meet specifically required features, particularly regarding subordination, coupon deferral and permanence in the capital structure. Moody’s revision has made it possible for corporates to achieve meaningful equity-credit of 50 per cent or more, and has prompted increased corporate activity in this area.
Standard & Poor’s and Fitch Ratings have also clarified their thinking on hybrids, and the three big rating agencies are now roughly in line in their treatment of hybrid capital.
Tax Treatment
The recent flow of corporate transactions has started in Europe thanks to favourable tax legislation in several European countries that makes it easier than in the US to develop new hybrid products that both improve rating treatment and qualify as debt for tax purposes. In the UK, however, the corporate tax law contains several provisions that challenge the tax deduction on interest paid on debt with ‘excessive’ equity characteristics.
The potential to achieve a more robust tax opinion may lead issuers choosing to have the instrument structured to be accounted for as debt. In article seven of this series on the WACC, ‘Reducing the WACC by Utilizing Tax Opportunities’; more tax angles related to this topic will be covered.
Impact on the WACC and Shareholder Value
Optimizing the WACC and maximizing returns to shareholders is a top priority for corporate treasurers.
Hybrid instruments strengthen the capital base by creating a buffer between senior creditors and shareholders. Hybrid capital offers an opportunity, when correctly structured and used as a substitute for more expensive and less flexible common equity, to lower the WACC.
Hybrid issues typically price between 50 and 200 basis points over senior debt. This means that the marginal cost of funding can be significantly lower than funding achieved through traditional debt and equity funding sources. This cost-effectiveness can be illustrated with the following example.
A company wants to raise €100m of capital with half of it qualifying as equity for rating purposes. It has, simply put, two options:
- €50m each of traditional debt and equity.
- €100m of hybrid capital with an equity treatment by the rating agencies of 50 per cent.
We assume the following rates apply to this company:
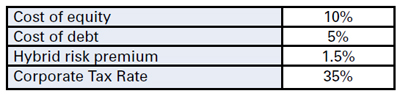
The marginal cost of capital for option 1 (traditional capital) would be:
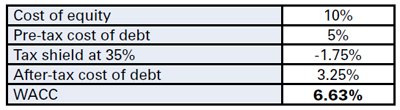
The marginal cost of capital for option 2 (hybrid capital) would be
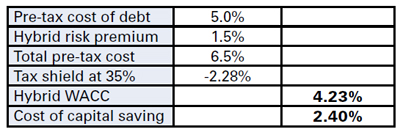
Please note: this calculation assumes full tax deductibility of the hybrid instrument.
By issuing hybrid capital with 50 per cent equity treatment the company achieves a cost of capital saving of 2.4 per cent. The advantage could be bigger still with 75 per cent equity treatment. The example shows that when hybrids are applied to substitute expensive equity, they offer an opportunity to lower the WACC of the issuer.
Conclusion
Hybrids offer corporates the opportunity to strengthen or maintain their credit ratings and balance sheet ratios, while funding acquisitions, share repurchases or pension deficits.
The economics achievable in current markets are an additional driving factor in the continuing rise in the number of hybrid instruments issued by corporates.
As a non-dilutive instrument, hybrid capital is particularly suitable for issuers who have limited access to equity or have dilution concerns. Raising hybrid capital offers the opportunity to lower the marginal cost of capital and therefore increase the return to shareholders.
To return to the question in the title of this article, hybrid capital can indeed be considered cheap equity. The additional cost on top of the normal cost of senior debt does not preclude the potential overall reduction in the cost of capital.
For companies with sufficient debt capacity within their current ratings, however, raising cheaper financing (not only in terms of spreads but also in terms of upfront fees) through traditional debt markets could still be a more attractive option. Possible changes in tax regimes and rating methodologies should also be taken into account when deciding on which funding instrument to choose.
Project Selection – How to Choose the Right Project and Make Effective Comparisons – Part five of the WACC Guide examines the extent to which input, assumptions and models used for project app roval can create a biased opinion of the shareholder value.
Treasury, as the custodian of risk management, could reinforce its role as an internal consultant on cash flow and help management prepare and substantiate decisions in allocating limited resources within the company.
In business, success and failure are never far apart. Among the many different options available, management has to select those initiatives that can be managed with (limited) corporate resources in terms of capital, people and time available. The aim of the game is to maximize shareholder or stakeholder value.
Estimating the potential for the creation of shareholder value or economic ‘value add’ of a project is not rocket science. Any project with a positive net present value (NPV), where the cash flow is discounted at the weighted average cost of capital (WACC), should increase shareholder or economic value. However, experienced business managers know that in reality this is not that easy.
Management has always tried to include some objectivity in project selection in order to avoid personal risk. There are a wide range of methods and models for calculating and ranking the NPVs of projects under review, but most models are a variation on discounted cash flow or real option methods. While many of these are complex and cumbersome to use, if not ineffective in day-to-day business, others in contrast are far too simple.
The model selected will affect the estimated shareholder value created as well as the ranking of projects. Without careful examination, a model or method could provide a false objective measure to determine the value created. This is not because the formulae are incorrect, but because the input assumptions applied by the analyst are often taken for granted and not properly understood.
This article examines to what extent input, assumptions and models used for project selection could create a biased opinion of the creation of shareholder value. Companies should also make sure that the investment proposals allow management to compare individual projects and select those that make the best contribution to the creation of shareholder value. Treasury, as a custodian of risk management, could be the internal consultant to management in preparing and substantiating decisions on the allocation of a company’s limited resources.
Scope of Projects
Projects are different from business operations because they require a team of (hand-picked) people to achieve pre-defined objectives within an agreed timeframe, as well as an (upfront) agreed investment.
Once the objectives are achieved and the output is handed back to the business, the project and its organization is dissolved.
Typically, projects are created to improve or expand business operations but the nature and effect of a project can vary widely. For instance, a project on the acquisition and integration of new business is different to a project to develop and introduce a new product. A calculation of the shareholder value created can, of course, help to prioritize all these projects but because the effort, scope and risk of each project are different, companies must make sure they make accurate and meaningful comparisons between projects.
1. Cash flow projections
Each model starts with a forecast of project cash inflow and outflow. By its very nature, the validity of a forecast is highly dependent on the underlying assumptions, and most models recognize that cash flow projections cannot be 100% accurate.
More complex models include a sensitivity testing function but this takes considerable effort to build.
Many companies take shortcuts by varying the net or gross cash flows as calculated for the base case. These shortcuts might give an inaccurate view because varying the value of (net) cash flow does not recognize the fact that delayed projects could incur not only higher cost but also costs over a prolonged period. As a result, revenues could be lower than anticipated or the expected cash inflows from that project may be delayed. In fact, any delay to the anticipated cash inflow can have a disproportionate effect on the NPV of the project.
A second issue related to cash flow projection is what elements should be included. Some companies include only ‘hard dollar savings’, ignoring ‘soft dollar savings’, such as unlocking partial full-time equivalents (FTEs) allowing staff to focus on (other) value adding activity, or existing cash flow that might be jeopardized if the project is not accepted.
Other benefits, such as security, market perception or quality of data, are even more difficult – if not impossible – to quantify. And, even if they were, it would still be difficult to quantify their contribution to individual projects.
The more companies focus on ‘hard dollar savings’, the more projects will need to focus on core business operations. As a result, projects that would significantly improve the quality of management information systems without reducing headcount might be overlooked. Short and low risk projects with a small upfront investment will be considered a higher priority than larger, more risky projects. For instance, projects building on existing infrastructure to create incremental benefits will typically be favoured above projects that result in a paradigm shift within the organisation.
A third issue is the horizon of the cash flow projection.
For comparison purposes, companies often have standard projection horizons of three or five years. However, the longer the project implementation takes, the longer it will take for the benefit to materialize.
Prefixed horizons favour projects with ‘quick wins’, low investments and short implementation. Important infrastructure projects might not return a significant positive NPV over a three-year period. On the other hand, projects with lasting ‘quick wins’ contribute a benefit after three, four or even 10 years – long after anybody would even remember the objectives!
If one sets the horizon of projections in a different way for each project, comparing the projects will not be straightforward. If one assumes that projects are considered only to the extent that they enhance shareholder or stakeholder value, the relevant horizon should be adjusted to the profile of stakeholders.
2. Discount factor
After the projections have been validated, the next step is to discount cash flows in order to make the NPV comparable. In theory, the WACC represents the rate at which projects will start generating shareholder value. The WACC is the weighted average cost of capital though and if a company is treated as a portfolio of projects, the WACC is a reflection of all activities and risks inherent in the company’s businesses.
Furthermore, the WACC is not constant over time. Among other factors, the WACC depends on the risk free rate, the company’s funding strategy (leverage) and risk profile. Each of these factors will change over time and can be different for each business line or project. The cost of capital should therefore be agreed individually for each project, and there are a number of issues that need attention.
Allocation of equity and debt
The allocation of equity and additional funding to projects is an important factor for the calculated NPV.
Using the current WACC for the calculation disregards the effect a project might have on company leverage when approved. Using the current WACC will also underestimate the shareholder value created by the project if additional (senior) funding is put in place.
However, in a similar case, the marginal approach to the project cost of capital would allocate all new (senior) funding disproportionately to the new project and thus overestimate the shareholder value to be created.
Another approach to this issue is to estimate the risk profile of an individual project and allocate equity accordingly. Depending on the magnitude and profile of projects in the portfolio, this might imply that a company could have a temporary or permanent equity surplus (or shortage). All projects should then compensate for this difference in order to satisfy stakeholders’ requirements.
A project cost of capital curve
The WACC will change over time as a result of market fluctuations and funding strategies. It is therefore not unreasonable to discount the first year cash flow at a different rate than that of the fourth or fifth year. The curve for the cost of capital for an individual project does not have to correlate to a risk-free yield curve.
The leverage strategy and change in the company’s risk profile will also affect this curve.
3. Identifying project risk
Each project will have a specific risk profile. The real option method tries to treat each risk component as a decision ‘option’ and estimates the value of each one using standard option calculation methods. The result of this approach to project risk is dependent on the predicted accuracy of the decisions, likelihood of each option available and timing of such occasions.
The more options involved in each decision, the more difficult it will be to verify the assumptions and thus validate the outcome.
Other simpler and widely used models will increase the discount factor with a risk premium. This approach will not favour projects with a high upfront investment and long impact horizon. Outsourcing projects that convert fixed investments into variable cost might also benefit disproportionately from this approach to project selection.
Risk is project specific and sometimes even option specific, i.e. two alternative approaches to the same project might have different risk profiles. The case for outsourcing a project to two different countries might have an identical cash flow; however, the market might see one as a higher risk than the other (e.g. as a result of additional country risk). Allocating additional equity to one project or adjusting the company WACC with a country specific outlook are alternative approaches for incorporation of such risk elements.
Individual projects can potentially affect the overall company risk profile. Acquisitions or major investments could affect the company beta and change the overall cost of capital. If these changes are not incorporated in the project NPV, the contribution to shareholder value can easily be misjudged. A marginal approach to allocating the cost (or benefit) of changing the company risk profile is tempting, especially when companies execute a diversification strategy. However, quite a few companies do feel the pressure of trying to capitalize on a break-up premium.
To address the element of risk, some methods will use a less complex approach by increasing the standard project discount factor. This risk factor might vary from project to project and this approach to risk favours projects with ‘quick wins’ early on in the project. This can be at the expense of projects with long-term structural impact because of the reduced NPV of cash flows over a long period of time. For the same reason, the method also favours projects with small upfront investments.
A Role for Treasury
In order to substantiate and motivate the value created by projects, companies need to ensure that cash flow projections and project risk are modelled in such a way that the outcome is comparable. Project support offices (if available) are hardly ever equipped for this task.
Treasury as the custodian of cash forecasting, risk management and fair value calculation, is ideal for this job. It would make perfect sense for treasury to develop useful models for project managers and evaluate the business case documents for executive management. In this way, treasury would be able to reinforce its role as an internal consultant on cash flow and risk management.
Conclusion
Many companies put a lot of effort into modeling the benefits of projects prior to approval. Allocating scarce resources in order to ensure a successful project is an important responsibility of management and they should understand how an adopted model is applied within a project.
Validating the motivation behind input and stress testing of cash flow projections is probably more important than the fact that, on paper, projects will return the value that makes them eligible for approval. Treasury can use its expertise to assist management and make sure the company chooses the best projects.
It is important to look beyond mere numbers and not focus on the difference of 1% or 2% in the NPV; remember there is always an element of art and ‘gut instinct’ in project selection. Management should therefore treat project analysis as a tool to support their strategic decision-making within the company.


