To Hedge or Not to Hedge: Navigating the Catch-22 of FRTB's PLA Test

FRTB PLA’s catch-22: hedging, used to reduce a portfolio’s risk, may actually increase the likelihood of failing the PLA test.
Profit and loss attribution (PLA) is a critical component of FRTB’s internal models approach (IMA), ensuring alignment between Front Office (FO) and Risk models. The consequences of a PLA test failure can be severe, with desks forced to use the more punitive standardised approach (SA), resulting in a considerable increase in capital charges. The introduction of the PLA test has sparked controversy as it appears to disincentivise the use of hedging. Well-hedged portfolios, which reduce risk and variability in a portfolio's P&L, often find it more challenging to pass the PLA test compared to riskier, unhedged portfolios.
In this article, we dig deeper into the issues surrounding hedging with the PLA test and provide solutions to help improve the chances of passing the test.
The problem with performing PLA on hedged portfolios
The PLA test measures the compatibility of the risk theoretical P&L (RTPL), produced by Risk, with the hypothetical P&L (HPL) produced by the FO. This is achieved by measuring the Spearman correlation and Kolmogorov–Smirnov (KS) test statistic on 250 days of historical RTPLs and HPLs for each trading desk. Based on the results of these tests, desks are assigned a traffic light test (TLT) zone categorisation, defined below. The final PLA result is the worst TLT zone of the two tests.
| TLT Zone | Spearman Correlation | KS Test |
| Green | > 0.80 | < 0.09 |
| Amber | < 0.80 | > 0.09 |
| Red | < 0.70 | > 0.12 |
The impact of TLT zones
The impact of a desk’s PLA results depends on which TLT zone it has been assigned:
- Green zone: Desks are free to calculate their capital requirements using the IMA.
- Amber zone: Desks are required to pay a capital surcharge, which can lead to a considerable increase in their capital requirements.
- Red zone: Desks must calculate their capital requirements using the SA, which can lead to a significant increase in their capital.
Red and Amber desks must also satisfy 12-month backtesting exception requirements before they can return to the green zone.
Why are hedged portfolios more susceptible to failing the PLA test?
Due to modeling and data differences, we typically expect there to exist a small difference (error) between RTPLs and HPLs. For unhedged portfolios, the total P&L is typically much larger than this error, resulting in a small relative error. When portfolios are hedged, the total P&L of the portfolio is reduced, leading to a larger relative error than that of an unhedged portfolio. This is illustrated in Figure 1, which shows how for the same modeling error, a significantly different relative error can be observed, depending on the degree of hedging of the portfolios.
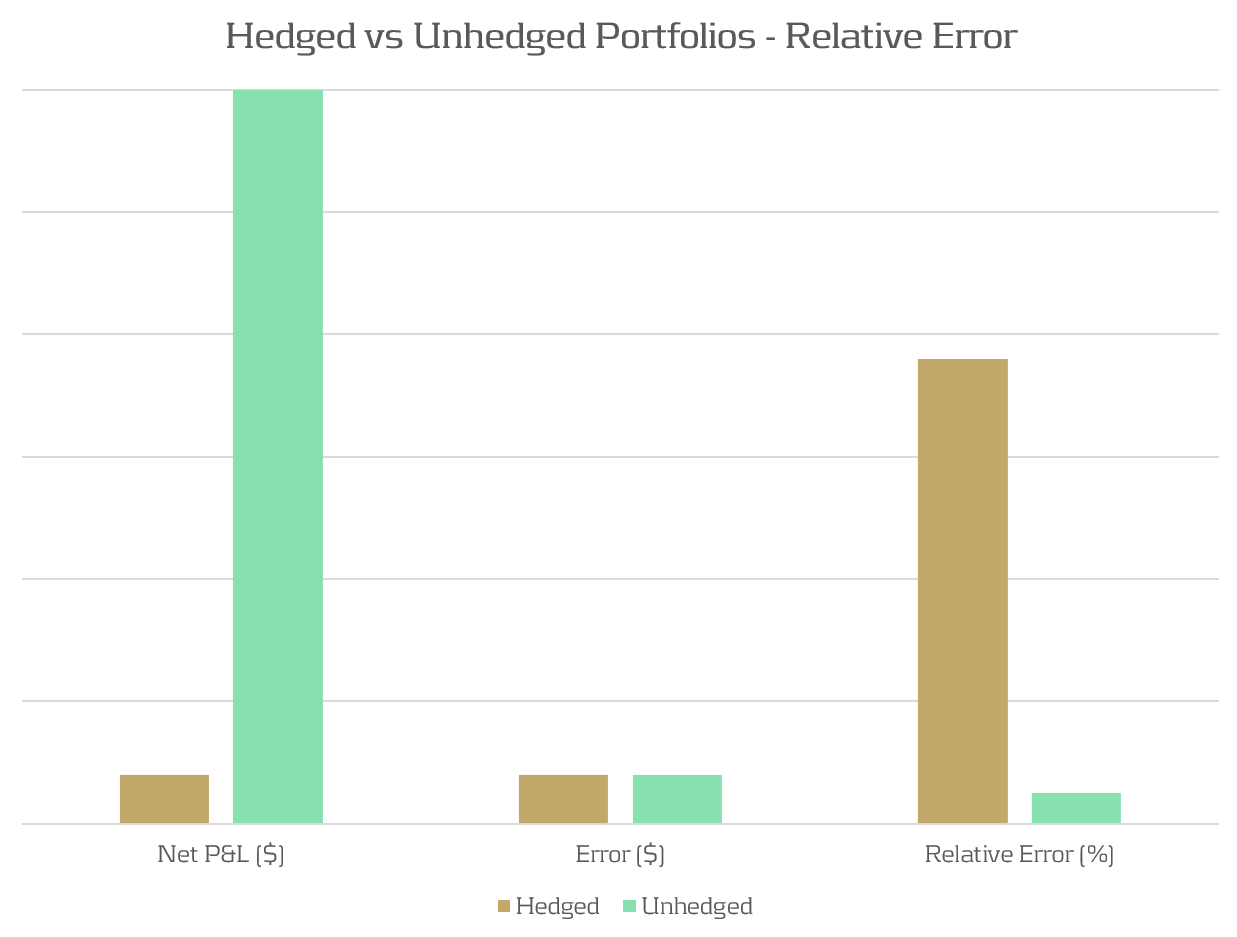
Figure 1: The relative P&L error can be significantly different between hedged and unhedged portfolios which have the same absolute error.
Demonstration: A delta-hedged option portfolio
Portfolio and simulation
To demonstrate the PLA hedging issue, we examine a simulated example of a desk with long put positions, hedged by a variable quantity of the underlying stock. In this example, the portfolio consists of 100 long puts and between 0 and 100 of the underlying stock as a hedge against the put positions.
To emulate the differences in pricing models between Risk and FO, a closed form solution is used to compute HPLs and a Monte Carlo pricing methodology is used for RTPLs. This produces a sufficiently small pricing error, such that the options and stock positions would comfortably pass the PLA test if they were held in separate portfolios. The P&Ls are obtained by repricing 250 scenarios of a Monte Carlo simulation of the underling risk factors.
The outcome
The results in Figure 2 show the PLA results for the two statistical tests against the total hedge ratio (the ratio between stock position delta and put position delta). The TLT zones are represented by the green, amber, and red shaded regions. This shows that the test statistics can vary quite considerably depending on the degree of hedging, with the KS test statistic entering the amber and red TLT zones for even a limited degree of hedging. The Spearman correlation is not as sensitive to the hedge ratio, but the statistic worsens as the hedging ratio approaches 100%.
Although the portfolio comfortably passes the PLA test when unhedged, it fails when hedged. Hence, quite surprisingly, hedging strategies used by banks to reduce risk may in fact be penalised by the regulator and increase capital requirements. Furthermore, failing desks would also need to satisfy 12-month PLA and backtesting requirements to return to the IMA.
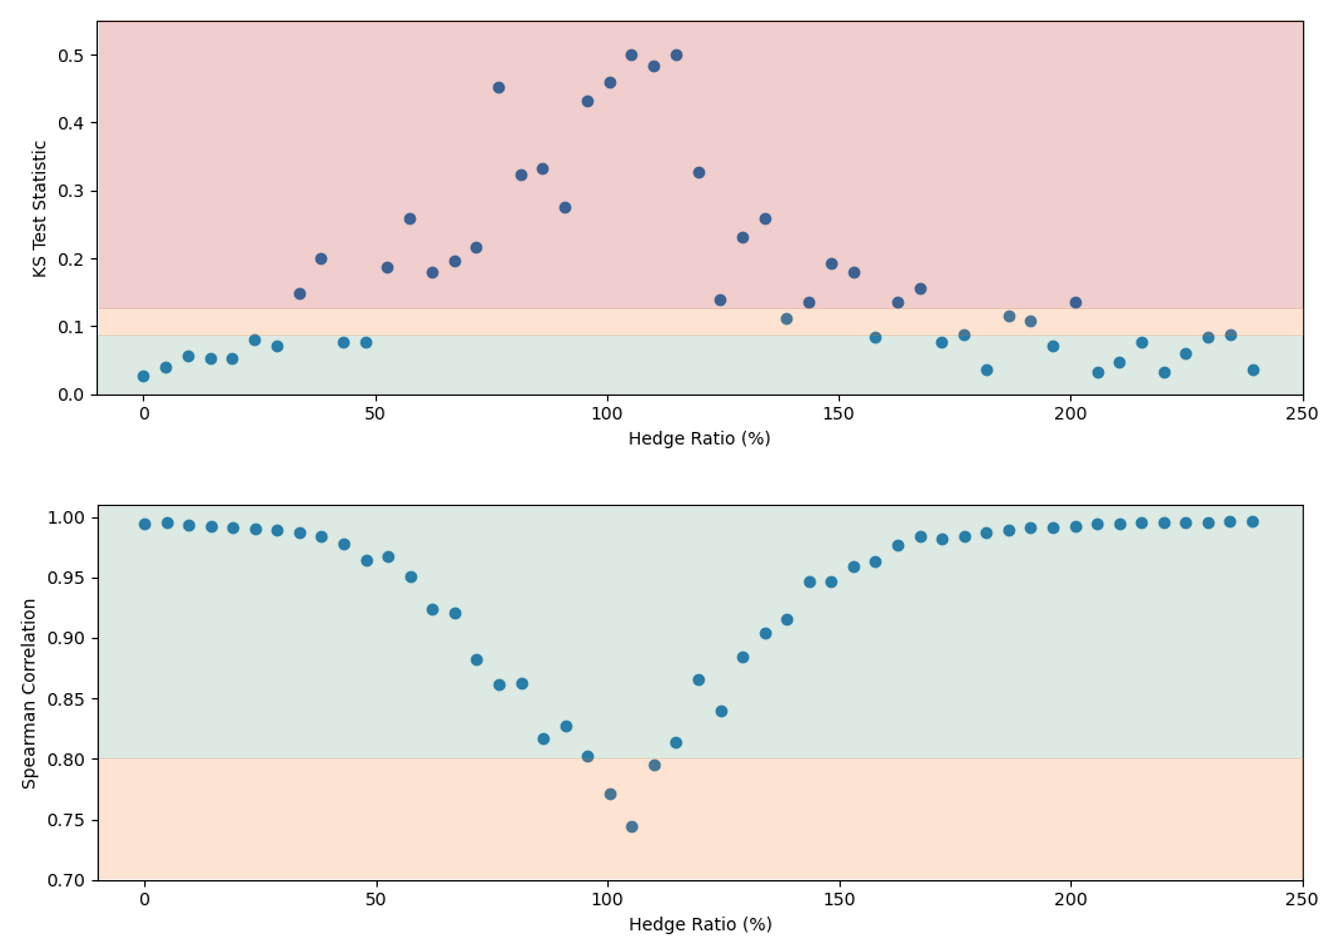
Figure 2: The KS (top) and Spearman correlation (bottom) statistics for an example portfolio of 100 long puts and between 0 and 100 shares of the underlying stock. The hedge ratio is defined as the ratio between stock position delta and put position delta. The green, amber, and red shading represent the TLT zones.
Solutions for Hedged Portfolios
Reducing the impact of hedged portfolios
As demonstrated, some trading desks with well-hedged positions may find themselves losing IMA eligibility due to poor performance in the PLA test. However, the following strategies can be used to reduce the possibility of failures:
- Model Alignment: Ensure the modeling methodologies of risk factors and instrument pricing are consistent between FO and Risk.
- Data Alignment: Ensure that the data sourced for FO and Risk are aligned and are of similar quality and granularity.
- Risk Enhancements: Improve the sophistication of Risk pricing models to better incorporate the subtilities of the FO pricer. This may require pricing optimisations and high-performance computing.
- Proactive Monitoring: Develop ongoing monitoring frameworks to identify and remediate P&L issues early. We provide more insights on the development of PLA analytics here.
Will regulatory policy change be required?
It is clear that the current PLA regulation does not correctly account for the effects of hedging on the PLA test statistics, resulting in hedged portfolios being penalised. As banks move towards implementing FRTB IMA, regulators should reflect on the impact of the current PLA implementation and consider providing exemptions for hedged portfolios or, alternatively, a fundamental modification of the PLA test.
Zanders’ services
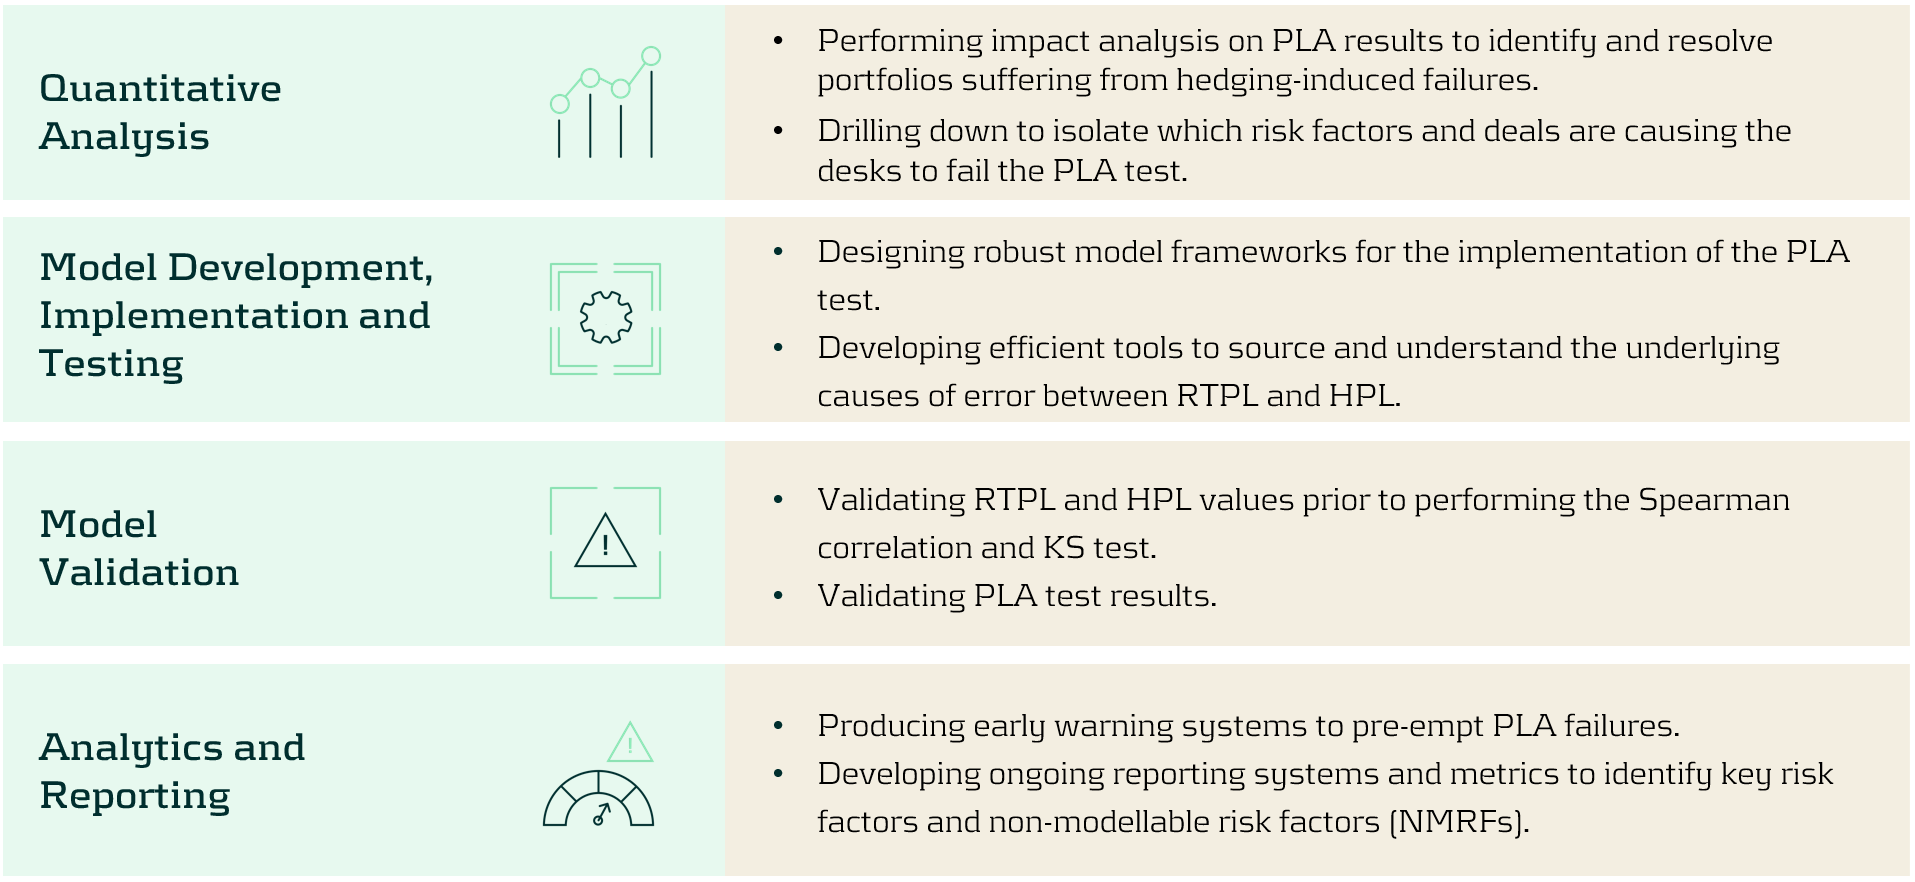
Zanders is ideally suited to helping clients develop models and implement FRTB workstreams. Below, we highlight a selection of the services we provide to implement, analyse, and improve PLA test results:
Conclusion
The PLA test under FRTB can disproportionately penalise well-hedged portfolios, forcing trading desks to adopt the more punitive SA. This effect is exacerbated by complex hedging strategies and non-linear instruments, which introduce additional model risks and potential discrepancies. To mitigate these issues, it is essential banks take steps to align their pricing models and data between FO and Risk. Implementing robust analytics frameworks to identify P&L misalignments is critical to quicky and proactively solve PLA problems. Zanders offers comprehensive services to help banks navigate the complexities of PLA and optimise their regulatory capital requirements.
For more information on this topic, contact Dilbagh Kalsi (Partner) or Hardial Kalsi (Manager).