VaR Backtesting in Turbulent Market Conditions: Enhancing the Historical Simulation Model with Volatility Scaling

In turbulent markets, enhancing VaR models with volatility scaling can improve their responsiveness to market changes and reduce capital charges due to backtesting failures.
Challenges with VaR models in a turbulent market
With recent periods of market stress, including COVID-19 and the Russia-Ukraine conflict, banks are finding their VaR models under strain. A failure to adhere to VaR backtesting requirements can lead to pressure on balance sheets through higher capital requirements and interventions from the regulator.
VaR backtesting
VaR is integral to the capital requirements calculation and in ensuring a sufficient capital buffer to cover losses from adverse market conditions. The accuracy of VaR models is therefore tested stringently with VaR backtesting, comparing the model VaR to the observed hypothetical P&Ls. A VaR model with poor backtesting performance is penalised with the application of a capital multiplier, ensuring a conservative capital charge. The capital multiplier increases with the number of exceptions during the preceding 250 business days, as described in Table 1 below.
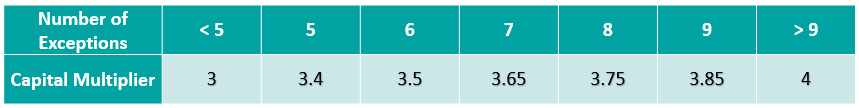
Table 1: Capital multipliers based on the number of backtesting exceptions.
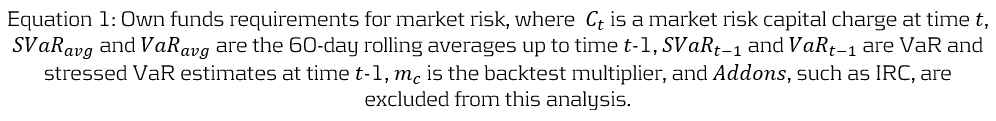
The capital multiplier is applied to both the VaR and stressed VaR, as shown in equation 1 below, which can result in a significant impact on the market risk capital requirement when failures in VaR backtesting occur.

Pro-cyclicality of the backtesting framework
A known issue of VaR backtesting is pro-cyclicality in market risk. This problem was underscored at the beginning of the COVID-19 outbreak when multiple banks registered several VaR backtesting exceptions. This had a double impact on market risk capital requirements, with higher capital multipliers and an increase in VaR from higher market volatility. Consequently, regulators intervened to remove additional pressure on banks’ capital positions that would only exacerbate market volatility. The Federal Reserve excluded all backtesting exceptions between 6th – 27th March 2020, while the PRA allowed a proportional reduction in risks-not-in-VaR (RNIV) capital charge to offset the VaR increase. More recent market volatility however has not been excluded, putting pressure on banks’ VaR models during backtesting.
Historical simulation VaR model challenges
Banks typically use a historical simulation approach (HS VaR) for modeling VaR, due to its computational simplicity, non-normality assumption of returns and enhanced interpretability. Despite these advantages, the HS VaR model can be slow to react to changing markets conditions and can be limited by the scenario breadth. This means that the HS VaR model can fail to adequately cover risk from black swan events or rapid shifts in market regimes. These issues were highlighted by recent market events, including COVID-19, the Russia-Ukraine conflict, and the global surge in inflation in 2022. Due to this, many banks are looking at enriching their VaR models to better model dramatic changes in the market.
Enriching HS VaR models
Alternative VaR modeling approaches can be used to enrich HS VaR models, improving their response to changes in market volatility. Volatility scaling is a computationally efficient methodology which can resolve many of the shortcomings of HS VaR model, reducing backtesting failures.
Enhancing HS VaR with volatility scaling
The Volatility Scaling methodology is an extension of the HS VaR model that addresses the issue of inertia to market moves. Volatility scaling adjusts the returns for each time t by the volatility ratio σT/σt, where σt is the return volatility at time t and σT is the return volatility at the VaR calculation date. Volatility is calculated using a 30-day window, which more rapidly reacts to market moves than a typical 1Y VaR window, as illustrated in Figure 1. As the cost of underestimation is higher than overestimating VaR, a lower bound to the volatility ratio of 1 is applied. Volatility scaling is simple to implement and can enrich existing models with minimal additional computational overhead.
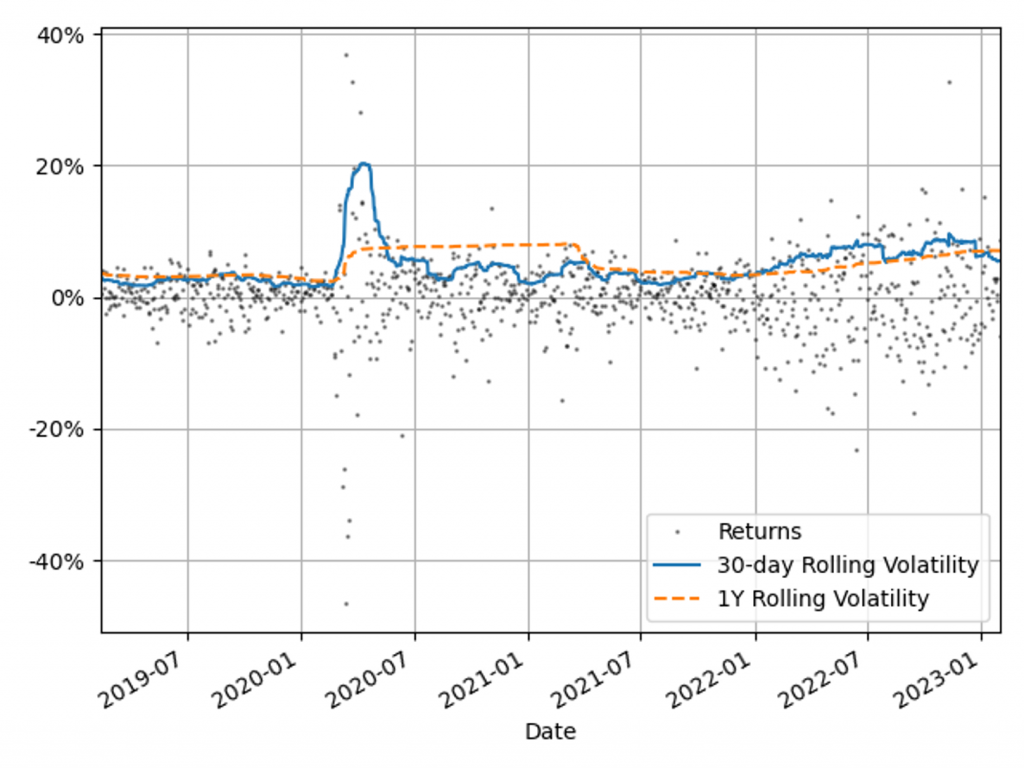
Figure 1: The 30-day and 1Y rolling volatilities of the 1-day scaled diversified portfolio returns. This illustrates recent market stresses, with short regions of extreme volatility (COVID-19) and longer systemic trends (Russia-Ukraine conflict and inflation).
Comparison with alternative VaR models
To benchmark the Volatility Scaling approach, we compare the VaR performance with the HS and the GARCH(1,1) parametric VaR models. The GARCH(1,1) model is configured for daily data and parameter calibration to increase sensitivity to market volatility. All models use the 99th percentile 1-day VaR scaled by a square root of 10. The effective calibration time horizon is one year, approximated by a VaR window of 260 business days. A one-week lag is included to account for operational issues that banks may have to load the most up-to-date market data into their risk models.
VaR benchmarking portfolios
To benchmark the VaR Models, their performance is evaluated on several portfolios that are sensitive to the equity, rates and credit asset classes. These portfolios include sensitivities to: S&P 500 (Equity), US Treasury Bonds (Treasury), USD Investment Grade Corporate Bonds (IG Bonds) and a diversified portfolio of all three asset classes (Diversified). This provides a measure of the VaR model performance for both diversified and a range of concentrated portfolios. The performance of the VaR models is measured on these portfolios in both periods of stability and periods of extreme market volatility. This test period includes COVID-19, the Russia-Ukraine conflict and the recent high inflationary period.
VaR model benchmarking
The performance of the models is evaluated with VaR backtesting. The results show that the volatility scaling provides significantly improved performance over both the HS and GARCH VaR models, providing a faster response to markets moves and a lower instance of VaR exceptions.
Model benchmarking with VaR backtesting
A key metric for measuring the performance of VaR models is a comparison of the frequency of VaR exceptions with the limits set by the Basel Committee’s Traffic Light Test (TLT). Excessive exceptions will incur an increased capital multiplier for an Amber result (5 – 9 exceptions) and an intervention from the regulator in the case of a Red result (ten or more exceptions). Exceptions often indicate a slow reaction to market moves or a lack of accuracy in modeling risk.
VaR measure coverage
The coverage and adaptability of the VaR models can be observed from the comparison of the realised returns and VaR time series shown in Figure 2. This shows that although the GARCH model is faster to react to market changes than HS VaR, it underestimates the tail risk in stable markets, resulting in a higher instance of exceptions. Volatility scaling retains the conservatism of the HS VaR model whilst improving its reactivity to turbulent market conditions. This results in a significant reduction in exceptions throughout 2022.
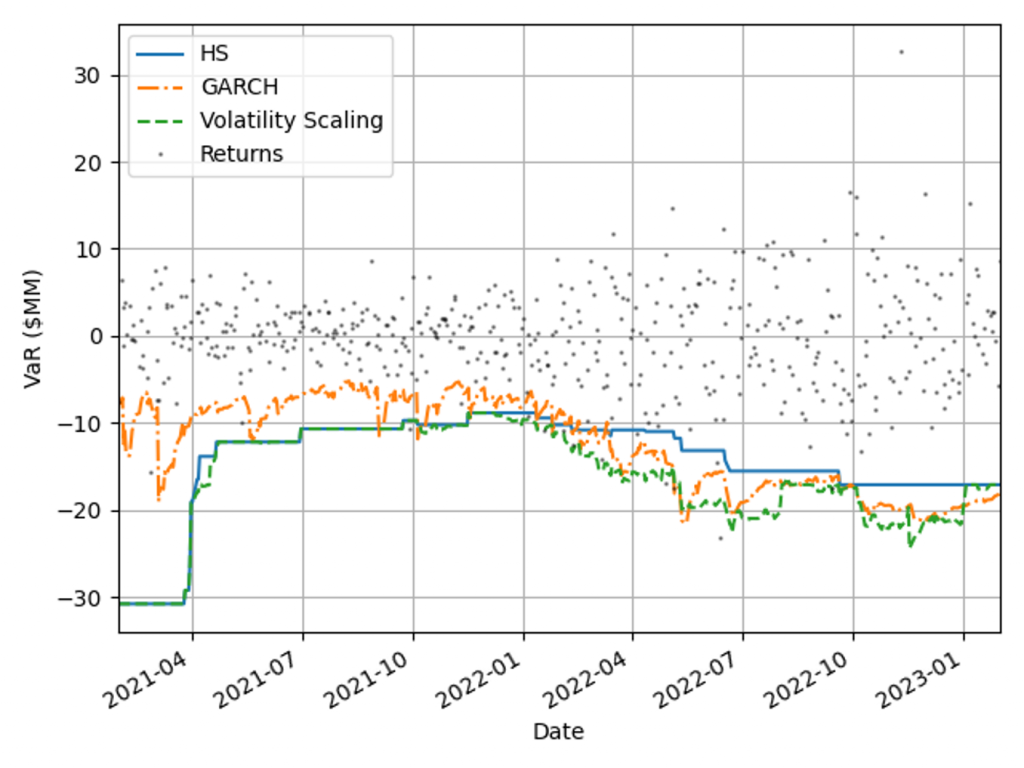
Figure 2: Comparison of realised returns with the model VaR measures for a diversified portfolio.
VaR backtesting results
The VaR model performance is illustrated by the percentage of backtest days with Red, Amber and Green TLT results in Figure 3. Over this period HS VaR shows a reasonable coverage of the hypothetical P&Ls, however there are instances of Red results due to the failure to adapt to changes in market conditions. The GARCH model shows a significant reduction in performance, with 32% of test dates falling in the Red zone as a consequence of VaR underestimation in calm markets. The adaptability of volatility scaling ensures it can adequately cover the tail risk, increasing the percentage of Green TLT results and completely eliminating Red results. In this benchmarking scenario, only volatility scaling would pass regulatory scrutiny, with HS VaR and GARCH being classified as flawed models, requiring remediation plans.
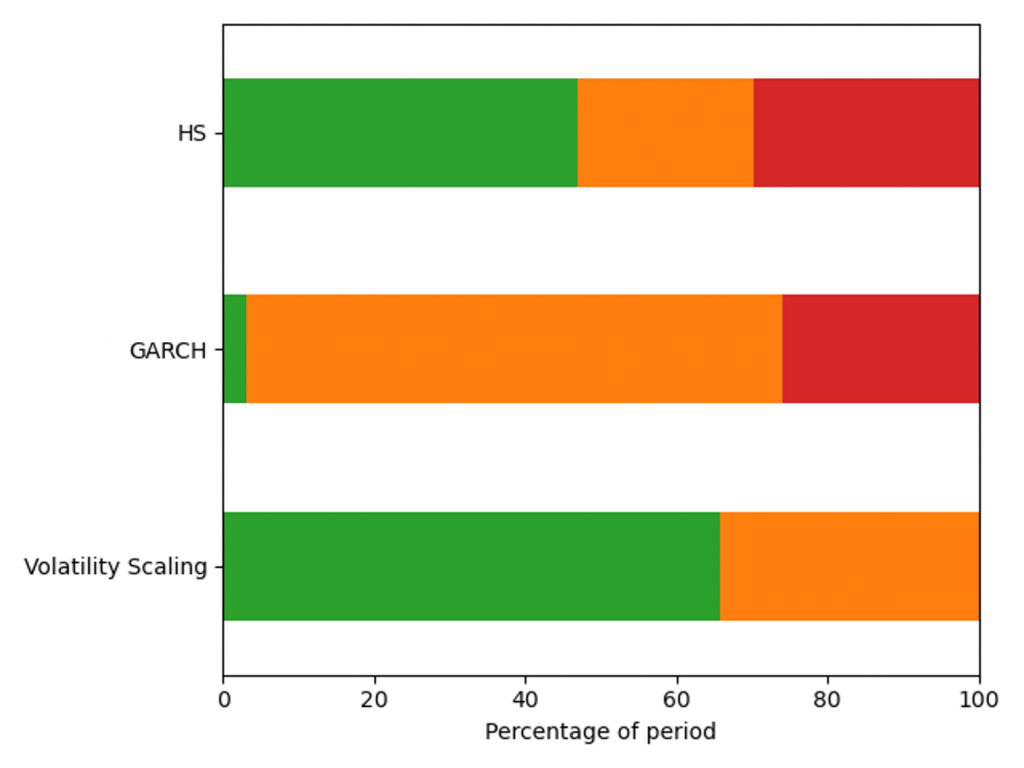
Figure 3: Percentage of days with a Red, Amber and Green Traffic Light Test result for a diversified portfolio over the window 29/01/21 - 31/01/23.
VaR model capital requirements
Capital requirements are an important determinant in banks’ ability to act as market intermediaries. The volatility scaling method can be used to increase the HS capital deployment efficiency without compromising VaR backtesting results.
Capital requirements minimisation
A robust VaR model produces risk measures that ensure an ample capital buffer to absorb portfolio losses. When selecting between robust VaR models, the preferred approach generates a smaller capital charge throughout the market cycle. Figure 4 shows capital requirements for the VaR models for a diversified portfolio calculated using Equation 1, with 𝐴𝑑𝑑𝑜𝑛𝑠 set to zero. Volatility scaling outperforms both models during extreme market volatility (the Russia-Ukraine conflict) and the HS model in period of stability (2021) as a result of setting the lower scaling constraint. The GARCH model underestimates capital requirements in 2021, which would have forced a bank to move to a standardised approach.
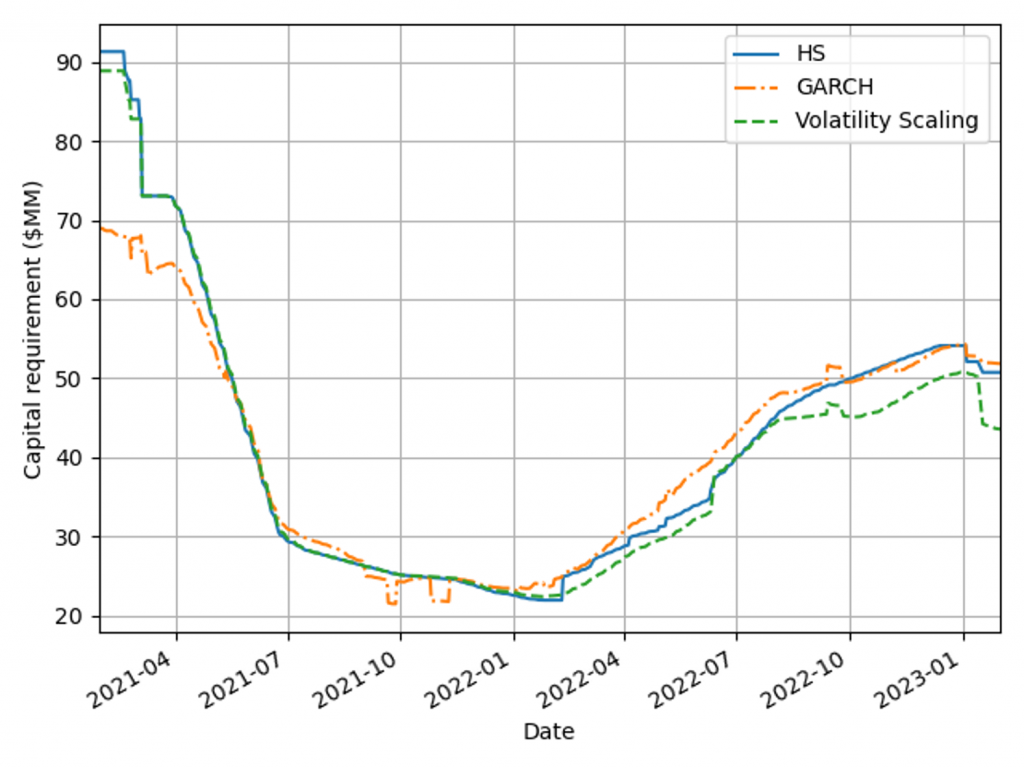
Figure 4: Capital charge for the VaR models measured on a diversified portfolio over the window 29/01/21 - 31/01/23.
Capital management efficiency
Pro-cyclicality of capital requirements is a common concern among regulators and practitioners. More stable requirements can improve banks’ capital management and planning. To measure models’ pro-cyclicality and efficiency, average capital charges and capital volatilities are compared for three concentrated asset class portfolios and a diversified market portfolio, as shown in Table 2. Volatility scaling results are better than the HS model across all portfolios, leading to lower capital charges, volatility and more efficient capital allocation. The GARCH model tends to underestimate high volatility and overestimate low volatility, as seen by the behaviour for the lowest volatility portfolio (Treasury).
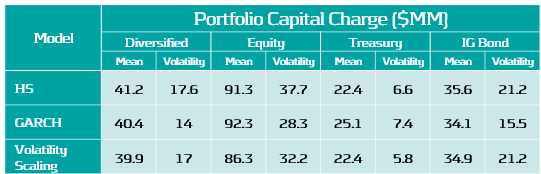
Table 2: Average capital requirement and capital volatility for each VaR model across a range of portfolios during the test period, 29/01/21 - 31/01/23.
Conclusions on VaR backtesting
Recent periods of market stress highlighted the need to challenge banks’ existing VaR models. Volatility scaling is an efficient method to enrich existing VaR methodologies, making them robust across a range of portfolios and volatility regimes.
VaR backtesting in a volatile market
Ensuring VaR models conform to VaR backtesting will be challenging with the recent period of stressed market conditions and rapid changes in market volatility. Banks will need to ensure that their VaR models are responsive to volatility clustering and tail events or enhance their existing methodology to cope. Failure to do so will result in additional overheads, with increased capital charges and excessive exceptions that can lead to additional regulatory scrutiny.
Enriching VaR Models with volatility scaling
Volatility scaling provides a simple extension of HS VaR that is robust and responsive to changes in market volatility. The model shows improved backtesting performance over both the HS and parametric (GARCH) VaR models. It is also robust for highly concentrated equity, treasury and bond portfolios, as seen in Table 3. Volatility scaling dampens pro-cyclicality of HS capital requirements, ensuring more efficient capital planning. The additional computational overhead is minimal and the implementation to enrich existing models is simple. Performance can be further improved with the use of hybrid models which incorporate volatility scaling approaches. These can utilise outlier detection to increase conservatism dynamically with increasingly volatile market conditions.
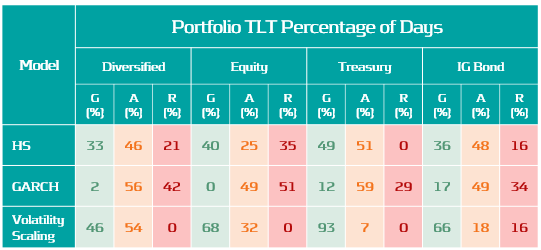
Table 3: Percentage of Green, Amber and Red traffic Lights test results for each VaR model across a range of portfolios for dates in the range: 13/02/19 - 31/01/23.
Zanders recommends
Banks should invest in making their VaR models more robust and reactive to ensure capital costs and the probability of exceptions are minimised. VaR models enriched with a volatility scaling approach should be considered among a suite of models to challenge existing VaR model methodologies. Methods similar to volatility scaling can also be applied to parametric and semi-parametric models. Outlier detection models can be used to identify changes in market regime as either feeder models or early warning signals for risk managers
-
Expanding the Utility of AI in Risk Management with AI Agents

-
Component VaR: Automating VaR Attribution

-
The Ridge Backtest Metric: Backtesting Expected Shortfall

-
FRTB: Harnessing Synergies Between Regulations

-
Targeted Review of Internal Models (TRIM): Review of observations and findings for Traded Risk

-
FRTB: Profit and Loss Attribution (PLA) Analytics

-
The usage of proxies under FRTB

-
FRTB: Improving the Modellability of Risk Factors

-
Regulatory exemptions during extreme market stresses: EBA publishes final RTS on extraordinary circumstances for continuing the use of internal models