Rating model calibration methodology

At Zanders we have developed several Credit Rating models. These models are already being used at over 400 companies and have been tested both in practice and against empirical data. Do you want to know more about our Credit Rating models, keep reading.
During the development of these models an important step is the calibration of the parameters to ensure a good model performance. In order to maintain these models a regular re-calibration is performed. For our Credit Rating models we strive to rely on a quantitative calibration approach that is combined and strengthened with expert option. This article explains the calibration process for one of our Credit Risk models, the Corporate Rating Model.
In short, the Corporate Rating Model assigns a credit rating to a company based on its performance on quantitative and qualitative variables. The quantitative part consists of 5 financial pillars; Operations, Liquidity, Capital Structure, Debt Service and Size. The qualitative part consist of 2 pillars; Business Analysis pillar and Behavioural Analysis pillar. See A comprehensive guide to Credit Rating Modeling for more details on the methodology behind this model.
The model calibration process for the Corporate Rating Model can be summarized as follows:
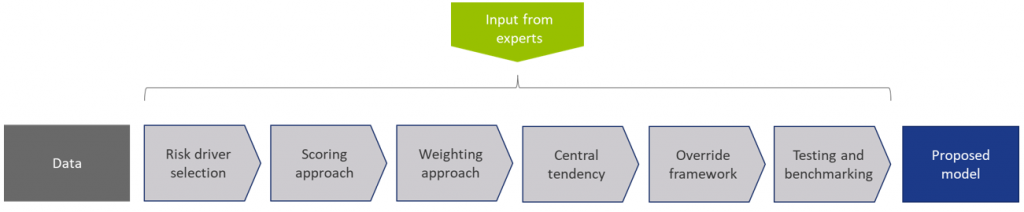
Figure 1: Overview of the model calibration process
In steps (2) through (7), input from the Zanders expert group is taken into consideration. This especially holds for input parameters that cannot be directly derived by a quantitative analysis. For these parameters, first an expert-based baseline value is determined and second a model performance optimization is performed to set the final model parameters.
In most steps the model performance is accessed by looking at the AUC (area under the ROC curve). The AUC metric is one of the most popular metrics to quantify the model fit (note this is not necessarily the same as the model quality, just as correlation does not equal causation). The AUC metric indicates, very simply put, the number of correct and incorrect predictions and plots them in a graph. The area under that graph then indicates the explanatory power of the model
DATA
The first step covers the selection of data from an extensive database containing the financial information and default history of millions of companies. Not all data points can be used in the calibration and/or during the performance testing of the model, therefore data filters are applied. Furthermore, the data set is categorized in 3 different size classes and 18 different industry sectors, each of which will be calibrated independently, using the same methodology.
This results in the master dataset, in addition data statistics are created that show the data availability, data relations and data quality. The master dataset also contains derived fields based on financials from the database, these fields are based on a long list of quantitative risk drivers (financial ratios). The long list of risk drivers is created based on expert option. As a last step, the master dataset is split into a calibration dataset (2/3 of the master dataset) and a test dataset (1/3 of the master dataset).
RISK DRIVER SELECTION
The risk driver selection for the qualitative variables is different from the risk driver selection for the quantitative variables. The final list of quantitative risk drivers is selected by means of different statistical analyses calculated for the long list of quantitative risk drivers. For the qualitative variables, a set of variables is selected based on expert opinion and industry practices.
SCORING APPROACH
Scoring functions are calibrated for the quantitative part of the model. These scoring function translate the value and trend value of each quantitative risk driver per size and industry to a (uniform) score between 0-100. For this exercise, different possible types of scoring functions are used. The best-performing scoring function for the value and trend of each risk driver is determined by performing a regression and comparing the performance. The coefficients in the scoring functions are estimated by fitting the function to the ratio values for companies in the calibration dataset. For the qualitative variables the translation from a value to a score is based on expert opinion.
WEIGHTING APPROACH
The overall score of the quantitative part of the model is combined by summing the value and trend scores by applying weights. As a starting point expert opinion-based weights are applied, after which the performance of the model is further optimized by iteratively adjusting the weights and arriving at an optimal set of weights. The weights of the qualitative variables are based on expert opinion.
MAPPING TO CENTRAL TENDENCY
To estimate the mapping from final scores to a rating class, a standardized methodology is created. The buckets are constructed from a scoring distribution perspective. This is done to ensure the eventual smooth distribution over the rating classes. As an input, the final scores (based on the quantitative risk drivers only) of each company in the calibration dataset is used together with expert opinion input parameters. The estimation is performed per size class. An optimization is performed towards a central tendency by adjusting the expert opinion input parameters. This is done by deriving a target average PD range per size class and on total level based on default data from the European Banking Authority (EBA).
The qualitative variables are included by performing an external benchmark on a selected set of companies, where proxies are used to derive the score on the qualitative variables.
The final input parameters for the mapping are set such that the average PD per size class from the Corporate Rating Model is in line with the target average PD ranges. And, a good performance on the external benchmark is achieved.
OVERRIDE FRAMEWORK
The override framework consists of two sections, Level A and Level B. Level A takes country, industry and company-specific risks into account. Level B considers the possibility of guarantor support and other (final) overriding factors. By applying Level A overrides, the Interim Credit Risk Rating (CRR) is obtained. By applying Level B overrides, the Final CRR is obtained. For the calibration only the country risk is taken into account, as this is the only override that is based on data and not a user input. The country risk is set based on OECD country risk classifications.
TESTING AND BENCHMARKING
For the testing and benchmarking the performance of the model is analysed based on the calibration and test dataset (excluding the qualitative assessment but including the country risk adjustment). For each dataset the discriminatory power is determined by looking at the AUC. The calibration quality is reviewed by performing a Binomial Test on Individual Rating Classes to check if the observed default rate lies within the boundaries of the PD rating class and a Traffic Lights Approach to compare the observed default rates with the PD of the rating class.
Concluding, the methodology applied for the (re-)calibration of the Corporate Rating Model is based on an extensive dataset with financial and default information and complemented with expert opinion. The methodology ensures that the final model performs in-line with the central tendency and an performs well on an external benchmark.
-
Revealing New Insights Through Machine Learning: An Application in Prepayment Modeling

-
Biodiversity Footprinting: How Financial Institutions Can Measure Their Impact

-
Redefining Credit Portfolio Strategies: Balancing Risk & Reward in a Volatile Economy

-
Insights into cracking model risk for prepayment models

-
Basel IV and External Credit Ratings

-
Regulatory exemptions during extreme market stresses: EBA publishes final RTS on extraordinary circumstances for continuing the use of internal models

-
The Ridge Backtest Metric: Backtesting Expected Shortfall

-
Exploring IFRS 9 Best Practices: Insights from Leading European Banks

-
Navigating SAP’s GROW and RISE Products: The Impact of Cloud Solutions on Treasury Operations

-
Unlocking the Hidden Gems of the SAP Credit Risk Analyzer