Mortgage valuation, a discounted cash flow method

With the advance of the current low interest rate environment and increased regulatory requirements, modeling mortgages for valuation purposes is more complex. Additionally, the applicable valuation method depends on the purpose of the valuation.
The most common valuation method for mortgage funds is known as the ‘fair value’ method, consisting of two building blocks: the cash flows and a discount curve. The first prerequisite to apply the fair value method is to determine future cash flows, based on the contractual components and behavioral modeling. The other prerequisite is to derive the appropriate rate for discounting via a top-down or bottom-up approach.
Two building blocks
The appropriate approach and level of complexity in the mortgage valuation depend on the underlying purpose. Examples of valuation purposes are: regulatory, accounting, risk or sales of the mortgage portfolio. For example BCBS, IRRBB, Solvency, IFRS and the EBA ask for (specific) valuation methods of mortgages. The two building blocks for a ‘fair value’ calculation of mortgages are expected cash flows and a discount curve.
The market value is the sum of the expected cash flows at the moment of valuation, which are derived by discounting future expected cash flows with an appropriate curve. For both building block models, choices have to be made resulting in a tradeoff between the accuracy level and the computational effort.
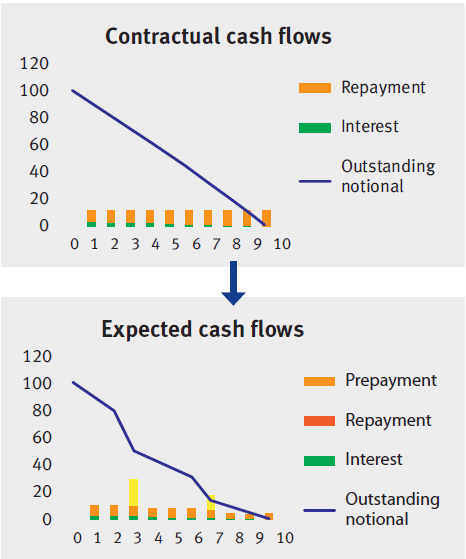
Figure 1: Constructing the expected cash flows from the contractual cash flows for a loan with an annuity repayment type.
Cash flow schedule
The contractual cash flows are projected cash flows, including repayments. These can be derived based on the contractually agreed loan components, such as the interest rate, the contractual maturity and the redemption type.
The three most commonly used redemption types in the mortgage market are:
- Bullet: interest only payments, no contractual repayment cash flows except at maturity
- Linear: interest (decreasing monthly) and constant contractual repayment cash flows
- Annuity: fixed cash flows, consisting of an interest and contractual repayment part
However, the expected cash flows will most likely differ from this contractually agreed pattern due to additional prepayments. Especially in the current low interest rate environment, borrowers frequently make prepayments on top of the scheduled repayments.
Figure 1 shows how to calculate an expected cash flow schedule by adding the prepayment cash flows to the contractual cash flow. There are two methods to derive : client behavior dependent on interest rates and client behavior independent of interest rates. The independent method uses an historical analysis, indicating a backward looking element. This historical analysis can include a dependency on certain contract characteristics.
On the other hand, the interest rate dependent behavior is forward looking and depends on the expected level of the interest rates. Monte Carlow simulations can model interest dependent behavior.
Another important factor in client behavior are penalties paid in case of a prepayment above a contractually agreed threshold. These costs are country and product specific. In Italy, for example, these extra costs do not exist, which could currently result in high prepayments rates.
Discount curve
The curve used for cash flow discounting is always a zero curve. The zero curve is constructed from observed interest rates which are mapped on zero-coupon bonds to maturities across time. There are three approaches to derive the rates of this discount curve: the top down-approach, the bottom-up approach or the negotiation approach. The first two methods are the most relevant and common.
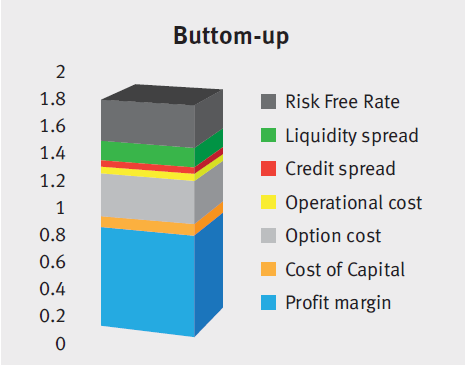
In theory, an all-in discount curve consists of a riskfree rate and several spread components. The ‘base’ interest curve concerns the risk-free interest rate term structure in the market at the valuation date with the applicable currency and interest fixing frequency (or use ccy- and basis-spreads). The spreads included depend on the purpose of the valuation. For a fair value calculation, the following spreads are added: liquidity spread, credit spread, operational cost, option cost, cost of capital and profit margin. An example of spreads included for other valuation purposes are offerings costs and origination fee.
Top-down versus Bottom-up
The chosen calculation approach depends on the available data, the ability to determine spread components, preferences and the purpose of the valuation.
A top-down method derives the applied rates of the discount curve from all-in mortgage rates on a portfolio level. Different rates should be used to construct a discount curve per mortgage type and LTV level, and should take into account the national guaranteed amount (NHG in the Netherlands). Subtract all-in mortgage rates spreads that should not part of the discount curve, such as the offering costs. Use this top-down approach when limited knowledge or tools are available to derive all the individual spread components. The all-in rates can be obtained from the following sources: mortgage rates in the market, own mortgage rates or by designing a mortgage pricing model.
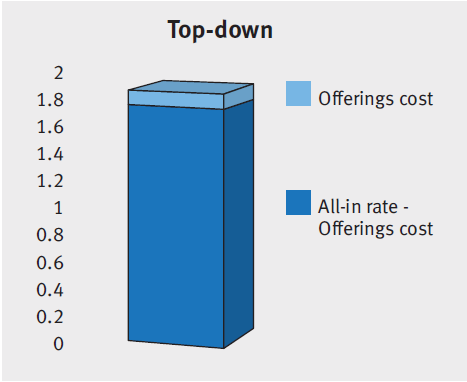
Figure 2
The bottom-up approach constructs the applied discount curve by adding all applicable spreads on top of the zero curve at a contract level. This method requires that several spread components can be calculated separately. The top-down approach is quicker, but less precise than the bottom-up approach, which is more accurate but also computationally heavy. Additionally, the bottom-up method is only possible if the appropriate spreads are known or can be derived. One example of a derivation of a spread component is credit spreads determined from expected losses based on an historical analysis and current market conditions.
In short
A fair value calculation performed by a discounted cash flow method consists of two building blocks: the expected cash flows and a discount curve. This requires several model choices before calculating a fair value of a mortgage (portfolio).
The expected cash flow model is based on the contractual cash flows and any additional prepayments. The mortgage prepayments can be modeled by assuming interest dependent or interest independent client behavior.
To construct the discount curve, the relevant spreads should be added to the risk-free curve. The decision for a top-down or bottom-up approach depends on the available data, the ability to determine spread components, preferences and the purpose of the valuation.
These important choices do not only apply for fair value calculations but are applicable for many other mortgage valuation purposes.
Zanders Valuation Desk
Independent, high quality, market practice and accounting standard proof are the main drivers of our Valuation Desk. For example, we ensure a high quality and professionalism with a strict, complete and automated check on the market data from our market data provider on a daily basis. Furthermore, we have increased our independence by implementing the F3 solution from FINCAD in our current valuation models. This permits us to value a larger range of financial instruments with a high level of quality, accuracy and wider complexity.
For more information or questions concerning valuation issues, please contact Pierre Wernert: [email protected].
-
CEO Statement: Delivering Financial Performance When It Counts

-
Optimizing the Valuation Processes in Modern Banking: A Strategic Approach to Efficiency, Consistency, and Cost Reduction

-
New challenges for banks’ ESG strategy and risk management

-
Debt Capacity Made Easy with our Latest Transfer Pricing Solution

-
Intra-Group Loan Transfer Pricing: What’s New in 2025?

-
Insights into XVA Calculations: How to Harness the Power of Neural Networks

-
Unlocking Value Through Foreign Exchange (FX) Risk Management: A Blueprint for Private Equity

-
PRA regulation changes in PS9/24

-
How BCBS 239’s RDARR Principles Can Strengthen Risk Data Aggregation and Reporting in Financial Institutions

-
Converging on resilience: Integrating CCR, XVA, and real-time risk management