

EBA publishes recommendations how to include E&S risks in the prudential framework for banks and insurers.
In October 2023, the European Banking Authority (EBA) published a report[1] with recommendations for enhancements to the Pillar 1 prudential framework to reflect environmental and social (E&S) risks, distinguishing between actions to be taken in the short term and in the medium to long term. The short-term actions are to be taken into account over the next three years as part of the implementation of the revised Capital Requirements Regulation and Capital Requirements Directive (CRR3/CRD6).
The EBA report follows a discussion paper on the same topic from May 2022[2], on which it solicited input from the financial industry. In this note, we provide an overview of the recommended actions by the EBA that relate to the prudential framework for banks. The EBA report also contains recommended actions for the prudential framework applying to investment firms, but these are not addressed here.
If the EBA’s recommendations are implemented in the prudential framework, in our view the most immediate implications for banks would be:
- When using external ratings to determine own fund requirements for credit risk under the standardized approach (SA) of Pillar 1, ensure that E&S risks are explicitly considered when evaluating the appropriateness of the external ratings as part of the due diligence requirements.
- When calculating own fund requirements for credit risk under the internal-ratings-based (IRB) approach, embed E&S risks in the rating assignment, risk quantification (for example through a margin of conservatism or the downturn component) and/or expert judgment and overrides.
- To assess E&S risks at a borrower level, establish a process to obtain and update material E&S-related information on the borrowers’ financial condition and credit facility characteristics, as part of due diligence during onboarding and ongoing monitoring of the borrowers’ risk profile.
- For IRB banks, embed E&S risks in the credit risk stress testing programs.
- Ensure that E&S risks are considered in the valuation of collateral, specifically for financial and real estate collateral.
- For market risk, embed environmental risks in trading book risk appetite, internal trading limits and the new product approval process. Furthermore, for banks aiming to use the internal model approach (IMA) of the Fundamental Review of the Trading Book (FRTB) regulation, environmental risks need to be considered in their stress testing program.
- For operational risk, identify whether E&S risks constitute triggers of operational risk losses.
We note that many of these implications align with the ECB’s expectations in the ECB Guide on climate-related and environmental risks[3].
Background
The EBA report considers both environmental and social risks, which the EBA characterizes as follows:
- As drivers of environmental risks, EBA distinguishes physical and transition (climate) risks. It does not explicitly refer in the report to other environmental risks, such as a loss of biodiversity or pollution, but in an earlier report the EBA considered these as part of chronic physical risks[4].
- EBA considers social factors to be related to the rights, well-being and interests of people and communities, including factors such as decent work, adequate living standards, inclusive and sustainable communities and societies, and human rights. As drivers of social risks, EBA distinguishes environmental factors (as materialization of physical and transition risks may change living standards and the labor market and increase social tensions, for example) as well as changes in policies and market sentiment. These may in part be driven by actions taken to meet the United Nation’s sustainable development goals (SDGs) in 2030.
In line with the ECB Guide on climate-related and environmental risks[5], the EBA does not view E&S risks as stand-alone risks, but as drivers of traditional banking risks. This is depicted in Figure 1. The report considers the impact on credit, market, operational, liquidity and concentration risks and reviews to what extent E&S risks can be reflected in capital buffers and the macro-prudential framework. It does not explicitly consider the securitization framework, although this will be implicitly affected by impacts on credit risk. The EBA does not see an impact of E&S risks on the (risk-insensitive) leverage ratio, and therefore does not consider it in the report.
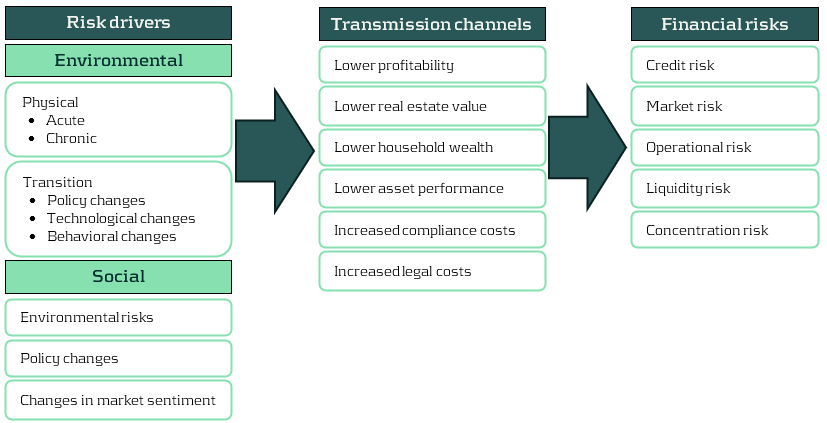
Figure 1: Examples of transmission channels for environmental and social risks (source: EBA).
The EBA notes that the Pillar 1 framework has been designed to capture the possible financial impact of cyclical economic fluctuations, but not to capture the manifestation of long-term environmental risks. It is therefore important to keep the main principles that form the basis of the prudential framework in mind when contemplating adjustments to reflect E&S risks in the prudential framework. The main principles as highlighted by the EBA are summarized below.
Main principles of the prudential framework and the relation to the horizon for E&S risks
With repect to the framework in general:
- Own fund requirements are intended to cover potential unexpected losses. In contrast, expected losses are directly deducted from own funds, and are generally captured in the accounting rules through provisions, impairments, write-downs and appropriate valuation of assets.
- The purpose of own fund requirements is to ensure resilience of an institution to unexpected adverse circumstances, before appropriate mitigating actions and strategy adjustments can be implemented. Therefore, environmental factors that can affect institutions in the short to medium term are expected to be reflected in the prudential framework. However, for those with an impact in the longer term, institutions are expected to take appropriate mitigating actions in their strategy.
- The high confidence level used in the Pillar 1 framework to protect institutions from risks over the short to medium horizon may no longer be achievable and appropriate if longer horizons would be considered.
- To the extent that institutions are exposed to E&S risks in relation to their specific strategy and business model, coverage of these risks in the Pillar 2 own-fund requirements instead of Pillar 1 could be appropriate. In addition, reflection of these risks in the Pillar 2 guidance for stress testing may be considered.
With respect to the internal-ratings-based (IRB) approach for credit risk:
- The Probability of Default (PD) represents a one-year default probability, which is required to be calibrated based on long-run average (‘through-the-cycle’) default rates. As such, longer-term risk characteristics of the obligor may be taken into account.
- The Credit Conversion Factor (CCF) as an estimate of potential additional drawdowns before default naturally relates to the one-year time horizon for the PD, but is expected to reflect the situation of an economic downturn.
- The time horizon for the Loss Given Default (LGD) extends to the full maturity of the exposure and/or the collection process and its calibration is also expected to reflect the situation of an economic downturn.
In the following sections we summarize the EBA recommendations by risk type.
Credit risk
The recommendations of the EBA largely put the burden on financial institutions to take E&S risks into account in the inputs for the existing Pillar 1 framework and/or to apply conservatism or overrides to the outputs. It does not recommend to include explicit E&S risk-related elements in the determination of risk weights for rated and unrated exposures in the SA or in the risk-weight formulas of the IRB. The main reasons for not doing so are that it is not clear what common and objective E&S-related factors should be used as input, what the proper functional form would be, a lack of evidence on which the size of an adjustment could be based so that it results in proper risk differentiation, and the risk of double counting with the reflection of E&S risks in the inputs to the existing own funds calculations under Pillar 1 (external ratings in the SA and PD, LGD and CCF in the case of IRB). However, the EBA will continue to evaluate this possibility in the medium to long term. The EBA also does not recommend introducing an environment-related adjustment factor to the risk weights resulting from the existing Pillar 1 framework[6].
Recommended actions for credit risk
| Short term |
- SA) The EBA encourages rating agencies to integrate environmental and social factors as drivers in the external credit risk assessments and to provide enhanced disclosures and transparency about the rating methodologies.
- (SA) Financial institutions to explicitly consider environmental factors in the due diligence that they are required to perform when using external credit risk assessments.
- (IRB) Financial institutions to reflect E&S risks in the rating assignment, risk quantification (for example through a margin of conservatism or the downturn component) and/or expert judgment and overrides, without affecting the overall performance of the rating system. In this context:
- Quantification of risks must be based on sufficient and reliable observations;
- Overrides should be for specific, individual cases where the institution believes there is material exposure to E&S risks but it has insufficient information to quantify it. Such overrides need to be regularly assessed and challenged;
- If an institution derives PDs for internal rating grades by a mapping to a scale from a credit rating institution, it needs to consider whether the default rates associated with the external scale reflect material E&S risks.
- To assess E&S risks at a borrower level, institutions need to have a process to obtain and update material E&S-related information on the borrowers’ financial condition and on credit facility characteristics, as part of the due diligence during onboarding and ongoing monitoring of borrowers’ risk profile.
- (IRB) Financial institutions to consider E&S risks in their stress testing programs.
- (SA, IRB) Financial institutions to ensure prudent valuation of immovable property collateral, considering climate-related physical and transition risks as well as other environmental risks. The prudent valuation should be considered at origination, re-valuation and during monitoring.
| Medium to long term |
- (SA) Financial institutions to monitor that environmental factors are reflected in financial collateral valuations through market values under Pillar 1 and valuation methodologies under Pillar 2.
- (SA) The EBA to consider whether benefits from the Infrastructure Supporting Factor (ISF) should only be applied to high-quality specialized lending corporate exposures that meet strong environmental standards.
- (SA) The EBA to consider adjusting risk weights, both in general and specifically for those assigned to real estate exposures.
- (IRB) As E&S risks materialize in defaults and loss rates over time, institutions need to redevelop or recalibrate their PD and LGD estimates.
(SA = standardized approach; IRB = Internal-rating-based approach)
Market risk
Within market risk, the EBA sees the main interaction of E&S risks with the equity, credit spread and commodity markets, in which E&S risks may cause additional volatility. In line with the existing regulatory guidance, the EBA expects E&S risks not to be treated as separate risk factors but as drivers of existing risk factors, with the exception of products for which cash flows depend specifically on ESG factors (‘ESG-linked products’).
The EBA does not recommend changes at this point to the standardized approach (SA) and the internal model approach (IMA) under the FRTB regulation, which will come into effect in the EU in 2025. The primary reason is the lack of sufficient evidence on the impact of E&S risks to enable a data driven approach, which forms the basis of the FRTB.
When calculating the expected shortfall (ES) measure under the IMA based on last 12 months' market data, the materialization of E&S risks will automatically be reflected in the market data that is used. When using market data from a stress period, either to calculate ES in the IMA or to calibrate risk factor shocks for the sensitivity-based measure (SbM) at a risk class level in the SA, the reflection of E&S risks will depend on the choice of stress period. To include E&S risks fully in the IMA but avoid overlap with the (partial) presence of E&S risks in historical data, the EBA views the consideration of E&S risks in a separate ‘risk not in the model engine’ (RNIME) add-on as most promising option for the medium to long term, leveraging the framework described in the ECB Guide to internal models[7].
Recommended actions for market risk
| Short term |
- (SA, IMA) Financial institutions to consider environmental risks in relation to their trading book risk appetite, internal trading limits and new product approval.
- (IMA) Financial institutions to consider environmental risk as part of their stress testing program that is required to get internal model approval.
| Medium to long term |
- (SA, IMA) Competent authorities to consider how to treat ESG-linked products for the residual risk add-on in the SA and in the IMA.(SA) The EBA to consider including a dimension for ESG risks in the existing equity and credit spread risk classes, or including a separate environmental risk class.
- (IMA) Financial institutions to consider ESG risks when monitoring risks that are not included in the model, for which the ECB’s RNIME framework could be used as a basis.
(SA = standardized approach; IRB = Internal-rating-based approach)
Operational risk
The EBA notes that various types of operational risks can increase as a result of E&S risks, including damage to physical assets, disruption of business processes and litigation. However, the new standardized approach (SA) for operational risk in the Basel III framework, which will come into effect in the EU in 2025, does not have a forward-looking component – it only considers historical loss experience (besides business indicators). Historical losses are unlikely to fully reflect the potential future impact of E&S risks, but there is as of yet insufficient evidence and data to quantify and consider this in an amendment of the SA.
Recommended actions for operational risk
| Short term |
- Financial institutions to identify whether E&S risks constitute triggers of operational risk losses.
| Medium to long term |
- Following evidence of E&S risk factors to trigger operational risk losses, the EBA to consider whether revisions to the BCBS SA methodology are warranted.
Liquidity risk
The EBA report describes three ways in which E&S risks may affect the liquidity coverage ratio (LCR) calculation. First, liquid assets that are specifically exposed to E&S risks may become less liquid and/or decrease in value. As a consequence, they may no longer satisfy the eligibility criteria for liquid assets. If they still do, then the decrease in market value would reflect the lower liquidity and reduce the LCR. Second, contingent liabilities arising from environmentally harmful investments would need to be included as outflows in the LCR calculation, thereby lowering the LCR. Third, a decrease in credit quality of receivables that are particularly exposed to E&S risks will decrease the inflows that can be taken into account in the LCR calculation. The EBA concludes that the existing LCR framework can capture the impact of E&S risks on the definition of liquid assets, outflows and inflows, so that no amendments are needed.
Regarding the existing framework for the net stable funding ratio (NSFR), the EBA notes that a reduction in the creditworthiness and/or liquidity of loans and securities exposed to E&S risks would lead to a higher requirement for stable funding and thereby negatively impact the NSFR. In this way, the existing NSFR framework can capture the impact of E&S risks on the definition of stable assets.
In summary, the EBA does not propose changes to the LCR and NSFR frameworks in relation to E&S risks. In case of excessive exposure to E&S risks for individual institutions, it notes that supervisors can set specific liquidity or funding requirements as part of the Pillar 2 framework for LCR and NSFR.
Concentration risk
The SA and IRB of the Pillar 1 framework for credit risk assume that a bank’s loan portfolio has full diversification of name-specific (idiosyncratic) risk and is well diversified across sectors and geographies. Because of these assumptions, the framework is not able to capture concentration risks, including those arising from E&S risks. In the current framework, single-name concentration risk is separately captured in Pillar 1 using the large exposure regime. Sector and geographic concentrations are considered in the SREP process under Pillar 2.
Recommended actions for concentration risk
| Short term |
- The EBA to develop a definition of environment-related concentration risk as well as exposure-based metrics for its quantification (e.g., ratio of exposures sensitive to a given environmental risk driver in a specific geographical area or in a specific industry sector over total exposures, total capital or RWA). These metrics will be part of supervisory reporting and, when relevant, external disclosure. In addition, they should be considered as part of Pillar 2 under SREP and/or supplement Pillar 3 disclosures on ESG risks.The EBA does not recommend to change the existing large exposure regime.
| Medium to long term |
- Based on the experience obtained with initial environment-related concentration risk metrics and quantification, the EBA may consider enhanced metrics and the appropriateness to introduce it in the Pillar 1 framework.
- This would entail the design and calibration of possible limits and thresholds, add-ons or buffers, as well as the specification of possible consequences if there are breaches.
Capital buffers and macroprudential framework
An alternative to amending the calculation of capital requirements to capture E&S risks in the prudential framework would be to increase the minimum required level of capital and/or to implement ‘borrower-based measures’ (BMM). Such BMMs aim to prevent a build-up of risk concentrations, for example by setting upper bounds on loan-to-value or loan-to-income for mortgage lending. Of the various possibilities, the EBA deems the use of a systemic risk capital buffer as the most suitable, although a double counting with the inclusion of E&S risks in the calculation of capital requirements under Pillar 1 and 2 needs to be avoided.
Recommended actions for capital buffers and macroprudential framework
| Short term |
- The EBA to asses changes to the guidelines on the appropriate subsets of sectoral exposures to which a systematic risk buffer may be applied.
| Medium to long term |
- The EBA to coordinate with other ongoing initiatives and assess the most appropriate adjustments.
Conclusion
The EBA considers E&S risks as a new source of systemic risk, which may not be adequately captured in the existing prudential framework. At the same time, the EBA recognizes the challenges in assessing the impact of these risks on regulatory metrics. The challenges range from a lack of granular and comparable data, varying definitions of what is environmentally and socially sustainable, historic data not being representative of what can be expected in the future, to the high uncertainty about the probability of future materialization of E&S risks. Moreover, the time horizon considered in the existing Pillar 1 framework is much shorter than the long horizon over which environmental risks are likely to fully materialize, with an exception of short-term acute physical and transition risks.
Against this background, the EBA does not recommend concrete quantitative adjustments to the existing Pillar 1 framework at this point. Nonetheless, it does expect financial institutions to take E&S risks into account in the inputs to the existing Pillar 1 framework or to apply overrides based on expert judgment. The EBA further proposes actions that should provide more clarity over time about the drivers and materiality of E&S risks. In due time, this can provide the basis for quantitative amendments to the Pillar 1 framework.
If you are interested to discuss this topic in more detail or would like support to embed E&S risks in your organization, please contact Pieter Klaassen at [email protected] or +41 78 652 5505.
[1]EBA (2023), Report on the role of environmental and social risks in the prudential framework (link), October.
[2] EBA (2022), Discussion paper on the role of environmental risks in the prudential framework (link), May. For a summary, see the article (link) on the Zanders website.
[3] ECB (2020), Guide on climate-related and environmental risks (link), November.
[4] See section 2.3.2 in EBA (2021), Report on management and supervision of ESG risks for credit institutions and investment firms (link), June.
[5] ECB (2020), Guide on climate-related and environmental risks (link), November.
[6] In the current EU Pillar 1 framework, adjustments are included that result in lower risk weights for small- and medium-sized enterprises (SME) and infrastructure lending. As the EBA notes, these adjustments are not risk-based but have been included in the EU to support lending to SMEs and for infrastructure projects.

The 2023 Global Risk Report by the World Economic Forum investigates the potential hazards for humanity in the next decade.
In this report, biodiversity loss ranks as the fourth most pressing concern after climate change adaptation, mitigation failure, and natural disasters. For financial institutions (FIs), it is therefore a relevant risk that should be taken into account. So, how should FIs implement biodiversity risk in their risk management framework?
Despite an increasing awareness of the importance of biodiversity, human activities continue to significantly alter the ecosystems we depend on. The present rate of species going extinct is 10 to 100 times higher than the average observed over the past 10 million years, according to Partnership for Biodiversity Accounting Financials[i]. The Intergovernmental Science-Policy Platform on Biodiversity and Ecosystem Services (IPBES) reports that 75% of ecosystems have been modified by human actions, with 20% of terrestrial biomass lost, 25% under threat, and a projection of 1 million species facing extinction unless immediate action is taken. Resilience theory and planetary boundaries state that once a certain critical threshold is surpassed, the rate of change enters an exponential trajectory, leading to irreversible changes, and, as noted in a report by the Nederlandsche Bank (DNB), we are already close to that threshold[ii].
We will now explain biodiversity as a concept, why it is a significant risk for financial institutions (FIs), and how to start thinking about implementing biodiversity risk in a financial institutions’ risk management framework.
What is biodiversity?
The Convention on Biological Diversity (CBD) defines biodiversity as “the variability among living organisms from all sources including, i.a., terrestrial, marine and other aquatic ecosystems and the ecological complexes of which they are part.”[iii] Humans rely on ecosystems directly and indirectly as they provide us with resources, protection and services such as cleaning our air and water.
Biodiversity both affects and is affected by climate change. For example, ecosystems such as tropical forests and peatlands consist of a diverse wildlife and act as carbon sinks that reduce the pace of climate change. At the same time, ecosystems are threatened by the accelerating change caused by human-induced global warming. The IPBES and Intergovernmental Panel on Climate Change (IPCC), in their first-ever collaboration, state that “biodiversity loss and climate change are both driven by human economic activities and mutually reinforce each other. Neither will be successfully resolved unless both are tackled together.”[iv]
Why is it relevant for financial institutions?
While financial institutions’ own operations do not materially impact biodiversity, they do have impact on biodiversity through their financing. ASN Bank, for instance, calculated that the net biodiversity impact of its financed exposure is equivalent to around 516 square kilometres of lost biodiversity – which is roughly equal to the size of the isle of Ibiza in Spain[v]. The FIs’ impact on biodiversity also leads to opportunities. The Institute Financing Nature (IFN) report estimates that the financing gap for biodiversity is close to $700 billion annually[vi]. This emphasizes the importance of directing substantial financial resources towards biodiversity-positive initiatives.
At the same time, biodiversity loss also poses risks to financial institutions.
The global economy highly depends on biodiversity as a result of the increasedglobalization and interconnectedness of the financial system. Due to these factors, the effects of biodiversity losses are magnified and exacerbated through the financial system, which can result in significant financial losses. For example, approximately USD 44 trillion of the global GDP is highly or moderately dependent on nature (World Economic Forum, 2020). Specifically for financial institutions, the DNB estimated that Dutch FIs alone have EUR 510 billionof exposure to companies that are highly or very highly dependent on one or more ecosystems services[vii]. Furthermore, in the 2010 World Economic Forum report worldwide economic damage from biodiversity loss is estimated to be around USD 2 to 4.5 trillion annually. This is remarkably high when compared to the negative global financial damage of USD 1.7 trillion per year from greenhouse gas emissions (based on 2008 data), which demonstrates that institutions should not focus their attention solely on the effects of climate change when assessing climate & environmental risks[viii].
Examples of financial impact
Similarly to climate risk, biodiversity risk is expected to materialize through the traditional risk types a financial institution faces. To illustrate how biodiversity loss can affect individual financial institutions, we provide an example of the potential impact of physical biodiversity risk on, respectively, the credit risk and market risk of an institution:
Credit risk:
Failing ecosystem services can lead to disruptions of production, reducing the profits of counterparties. As a result, there is an increase in credit risk of these counterparties. For example, these disruptions can materialize in the following ways:
- A total of 75% of the global food crop rely on animals for their pollination. For the agricultural sector, deterioration or loss of pollinating species may result in significant crop yield reduction.
- Marine ecosystems are a natural defence against natural hazards. Wetlands prevented USD 650 million worth of damages during the 2012 Superstorm Sandy [OECD, 2019), while the material damage of hurricane Katrina would have been USD 150 billion less if the wetlands had not been lost.
Market risk:
The market value of investments of a financial institution can suffer from the interconnectedness of the global economy and concentration of production when a climate event happens. For example:
- A 2011 flood in Thailand impacted an area where most of the world's hard drives are manufactured. This led to a 20%-40% rise in global prices of the product[ix]. The impact of the local ecosystems for these type of products expose the dependency for investors as well as society as a whole.
Core part of the European Green Deal
The examples above are physical biodiversity risk examples. In addition to physical risk, biodiversity loss can also lead to transition risk – changes in the regulatory environment could imply less viable business models and an increase in costs, which will potentially affect the profitability and risk profile of financial institutions. While physical risk can be argued to materialize in a more distant future, transition risk is a more pressing concern as new measures have been released, for example by the European Commission, to transition to more sustainable and biodiversity friendly practices. These measures are included in the EU biodiversity strategy for 2030 and the EU’s Nature restoration law.
The EU’s biodiversity strategy for 2030 is a core part of European Green Deal. It is a comprehensive, ambitious, and long-term plan that focuses on protecting valuable or vulnerable ecosystems, restoring damaged ecosystems, financing transformation projects, and introducing accountability for nature-damaging activities. The strategy aims to put Europe's biodiversity on a path to recovery by 2030, and contains specific actions and commitments. The EU biodiversity strategy covers various aspects such as:
- Legal protection of an additional 4% of land area (up to a total of 7%) and 19% of sea area (up to a total of 30%)
- Strict protection of 9% of sea and 7% of land area (up to a total of 10% for both)
- Reduction of fertilizer use by at least 20%
- Setting measures for sustainable harvesting of marine resources
A major step forwards towards enforcement of the strategy is the approval of the Nature restoration law by the EU in July 2023, which will become the first continent-wide comprehensive law on biodiversity and ecosystems. The law is likely to impact the agricultural sector, as the bill allows for 30% of all former peatlands that are currently exploited for agriculture to be restored or partially shifted to other uses by 2030. By 2050, this should be at least 70%. These regulatory actions are expected to have a positive impact on biodiversity in the EU. However, a swift implementation may increase transition risk for companies that are affected by the regulation.
The ECB Guide on climate-related and environmental risks explicitly states that biodiversity loss is one of the risk drivers for financial institutions[x]. Furthermore, the ECB Guide requires financial institutions to asses both physical and transition risks stemming from biodiversity loss. In addition, the EBA Report on the Management and Supervision of ESG Risk for Credit Institutions and Investment Firms repeatedly refers to biodiversity when discussing physical and transition risks[xi].
Moreover, the topic ‘biodiversity and ecosystems’ is also covered by the Corporate Sustainability Reporting Directive (CSRD), which requires companies within its scope to disclose on several sustainability related matters using a double materiality perspective.[1] Biodiversity and ecosystems is one of five environmental sustainability matters covered by CSRD. At a minimum, financial institutions in scope of CSRD must perform a materiality assessment of impacts, risks and opportunities stemming from biodiversity and ecosystems. Furthermore, when biodiversity is assessed to be material, either from financial or impact materiality perspective, the institution is subject to granular biodiversity-related disclosure requirements covering, among others, topics such as business strategy, policies, actions, targets, and metrics.
Where to start?
In line with regulatory requirements, financial institutions should already be integrating biodiversity into their risk management practices. Zanders recognizes the challenges associated with biodiversity-related risk management, such as data availability and multidimensionality. Therefore, Zanders suggests to initiate this process by starting with the following two steps. The complexity of the methodologies can increase over time as the institution’s, the regulator’s and the market’s knowledge on biodiversity-related risks becomes more mature.
- Perform materiality assessment using the double materiality concept. This means that financial institutions should measure and analyze biodiversity-related financial materiality through the identification of risks and opportunities. Institutions should also assess their impacts on biodiversity, for example, through calculation of their biodiversity footprint. This can start with classifying exposures’ impact and dependency on biodiversity based on a sector-level analysis.
- Integrate biodiversity-related risks considerations into their business strategy and risk management frameworks. From a business perspective, if material, financial institutions are expected to integrate biodiversity in their business strategy, and set policies and targets to manage the risks. Such actions could be engagement with clients to promote their sustainability practices, allocation of financing to ‘biodiversity-friendly’ projects, and/or development of biodiversity specific products. Moreover, institutions are expected to adjust their risk appetites to account for biodiversity-related risks and opportunities, establish KRIs along with limits and thresholds. Embedding material ESG risks in the risk appetite frameworks should include a description on how risk indicators and limits are allocated within the banking group, business lines and branches.
Considering the potential impact of biodiversity loss on financial institutions, it is crucial for them to extend their focus beyond climate change and also start assessing and managing biodiversity risks. Zanders can support financial institutions in measuring biodiversity-related risks and taking first steps in integrating these risks into risk frameworks. Curious to hear more on this? Please reach out to Marije Wiersma, Iryna Fedenko, or Jaap Gerrits.
[1] CSRD applies to large EU companies, including banks and insurance firms. The first companies subject to CSRD must disclose according to the requirements in the European Sustainability Reporting Standards (ESRS) from 2025 (over financial year 2024), and by the reporting year 2029, the majority of European companies will be subject to publishing the CSRD reports. The sustainability report should be a publicly available statement with information on the sustainability-matters that the company considers material. This statement needs to be audited with limited assurance.
[i] PBAF. (2023). Dependencies - Pertnership for Biodiversity Acccounting Financials (PBAF)
[ii] De Nederlandche Bank. (2020). Indepted to nature - Exploring biodiversity risks for the Dutch Financial Sector.
[iii] CBD. (2005). Handbook of the convention on biological diversity
[iv] IPBES. (2021). Tackling Biodiversity & Climate Crises Together & Their Combined Social Impacts
[v] ASN Bank (2022). ASN Bank Biodiversity Footprint
[vi] Paulson Institute. (2021). Financing nature: Closing the Global Biodiversity
[vii] De Nederlandche Bank. (2020). Indepted to nature - Exploring biodiversity risks for the Dutch Financial Sector
[viii] PwC for World Economic Forum. (2010). Biodiversity and business risk
[ix] All the examples related to credit and market risk are presented in the report by De Nederlandsche Bank. (2020). Biodiversity Opportunities and Risks for the Financial Sector
[x] ECB. (2020). Guide on climate-related and environmental risks.
[xi] EBA. (2021). EBA Report on Management and Supervision of ESG Risk for Credit Institutions and Investment Firms

Under FRTB, banks must pass the PLA test to ensure alignment between Front Office and Risk P&L, or face higher capital charges and potential use of the standardised approach.
Under FRTB regulation, PLA requires banks to assess the similarity between Front Office (FO) and Risk P&L (HPL and RTPL) on a quarterly basis. Desks which do not pass PLA incur capital surcharges or may, in more severe cases, be required to use the more conservative FRTB standardised approach (SA).
What is the purpose of PLA?
PLA ensures that the FO and Risk P&Ls are sufficiently aligned with one another at the desk level. The FO HPL is compared with the Risk RTPL using two statistical tests. The tests measure the materiality of any simplifications in a bank’s Risk model compared with the FO systems. In order to use the Internal Models Approach (IMA), FRTB requires each trading desk to pass the PLA statistical tests. Although the implementation of PLA begins on the date that the IMA capital requirement becomes effective, banks must provide a one-year PLA test report to confirm the quality of the model.
Which statistical measures are used?
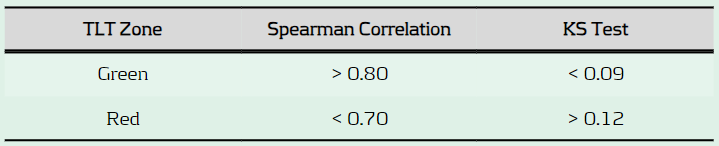
PLA is performed using the Spearman Correlation and the Kolmogorov-Smirnov (KS) test using the most recent 250 days of historical RTPL and HPL. Depending on the results, each desk is assigned a traffic light test (TLT) zone (see below), where amber desks are those which are allocated to neither red or green.
What are the consequences of failing PLA?
Capital increase: Desks in the red zone are not permitted to use the IMA and must instead use the more conservative SA, which has higher capital requirements. Amber desks can use the IMA but must pay a capital surcharge until the issues are remediated.
Difficulty with returning to IMA: Desks which are in the amber or red zone must satisfy statistical green zone requirements and 12-month backtesting requirements before they can be eligible to use the IMA again.
What are some of the key reasons for PLA failure?
Data issues: Data proxies are often used within Risk if there is a lack of data available for FO risk factors. Poor or outdated proxies can decrease the accuracy of RTPL produced by the Risk model. The source, timing and granularity also often differs between FO and Risk data.
Missing risk factors: Missing risk factors in the Risk model are a common cause of PLA failures. Inaccurate RTPL values caused by missing risk factors can cause discrepancies between FO and Risk P&Ls and lead to PLA failures.
Roadblocks to finding the sources of PLA failures
FO and Risk mapping: Many banks face difficulties due to a lack of accurate mapping between risk factors in FO and those in Risk. For example, multiple risk factors in the FO systems may map to a single risk factor in the Risk model. More simply, different naming conventions can also cause issues. The poor mapping can make it difficult to develop an efficient and rapid process to identify the sources of P&L differences.
Lack of existing processes: PLA is a new requirement which means there is a lack of existing infrastructure to identify causes of P&L failures. Although they may be monitored at the desk level, P&L differences are not commonly monitored at the risk factor level on an ongoing basis. A lack of ongoing monitoring of risk factors makes it difficult to pre-empt issues which may cause PLA failures and increase capital requirements.
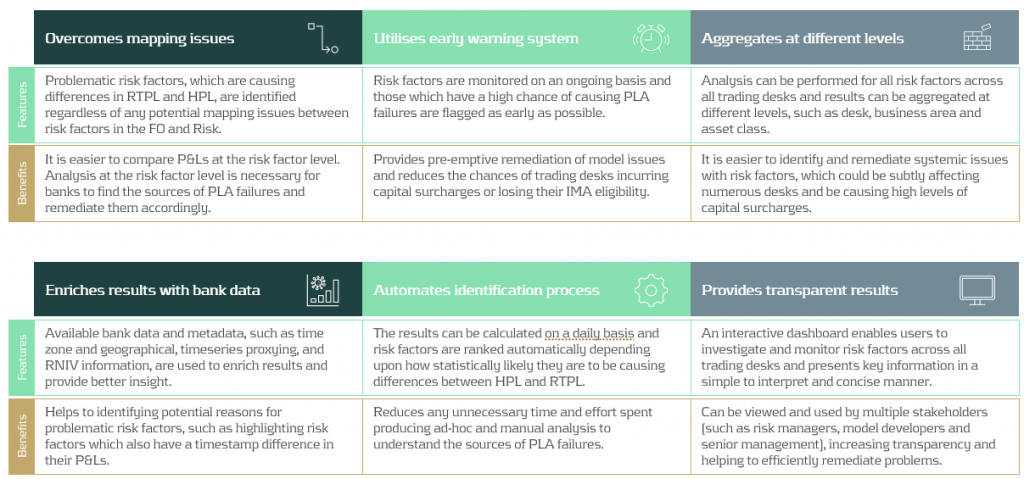
Our approach: Identifying risk factors that are causing PLA failures
Zanders’ approach overcomes the above issues by producing analytics despite any underlying mapping issues between FO and Risk P&L data. Using our algorithm, risk factors are ranked depending upon how statistically likely they are to be causing differences between HPL and RTPL. Our metric, known as risk factor ‘alpha’, can be tracked on an ongoing basis, helping banks to remediate underlying issues with risk factors before potential PLA failures.
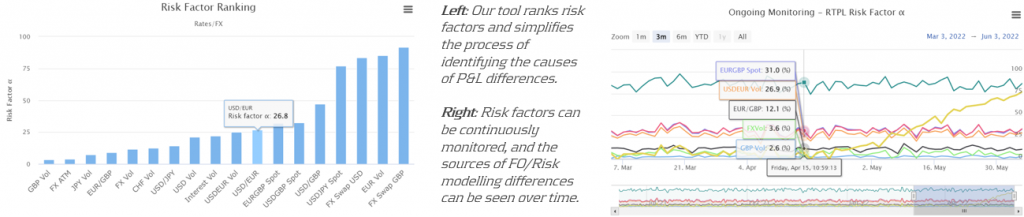
Zanders’ P&L attribution solution has been implemented at a Tier-1 bank, providing the necessary infrastructure to identify problematic risk factors and improve PLA desk statuses. The solution provided multiple benefits to increase efficiency and transparency of workstreams at the bank.
Conclusion
As it is a new regulatory requirement, passing the PLA test has been a key concern for many banks. Although the test itself is not considerably difficult to implement, identifying why a desk may be failing can be complicated. In this article, we present a PLA tool which has already been successfully implemented at one of our large clients. By helping banks to identify the underlying risk factors which are causing desks to fail, remediation becomes much more efficient. Efficient remediation of desks which are failing PLA, in turn, reduces the amount of capital charges which banks may incur.

In turbulent markets, enhancing VaR models with volatility scaling can improve their responsiveness to market changes and reduce capital charges due to backtesting failures.
Challenges with VaR models in a turbulent market
With recent periods of market stress, including COVID-19 and the Russia-Ukraine conflict, banks are finding their VaR models under strain. A failure to adhere to VaR backtesting requirements can lead to pressure on balance sheets through higher capital requirements and interventions from the regulator.
VaR backtesting
VaR is integral to the capital requirements calculation and in ensuring a sufficient capital buffer to cover losses from adverse market conditions. The accuracy of VaR models is therefore tested stringently with VaR backtesting, comparing the model VaR to the observed hypothetical P&Ls. A VaR model with poor backtesting performance is penalised with the application of a capital multiplier, ensuring a conservative capital charge. The capital multiplier increases with the number of exceptions during the preceding 250 business days, as described in Table 1 below.

Table 1: Capital multipliers based on the number of backtesting exceptions.
The capital multiplier is applied to both the VaR and stressed VaR, as shown in equation 1 below, which can result in a significant impact on the market risk capital requirement when failures in VaR backtesting occur.


Pro-cyclicality of the backtesting framework
A known issue of VaR backtesting is pro-cyclicality in market risk. This problem was underscored at the beginning of the COVID-19 outbreak when multiple banks registered several VaR backtesting exceptions. This had a double impact on market risk capital requirements, with higher capital multipliers and an increase in VaR from higher market volatility. Consequently, regulators intervened to remove additional pressure on banks’ capital positions that would only exacerbate market volatility. The Federal Reserve excluded all backtesting exceptions between 6th – 27th March 2020, while the PRA allowed a proportional reduction in risks-not-in-VaR (RNIV) capital charge to offset the VaR increase. More recent market volatility however has not been excluded, putting pressure on banks’ VaR models during backtesting.
Historical simulation VaR model challenges
Banks typically use a historical simulation approach (HS VaR) for modeling VaR, due to its computational simplicity, non-normality assumption of returns and enhanced interpretability. Despite these advantages, the HS VaR model can be slow to react to changing markets conditions and can be limited by the scenario breadth. This means that the HS VaR model can fail to adequately cover risk from black swan events or rapid shifts in market regimes. These issues were highlighted by recent market events, including COVID-19, the Russia-Ukraine conflict, and the global surge in inflation in 2022. Due to this, many banks are looking at enriching their VaR models to better model dramatic changes in the market.
Enriching HS VaR models
Alternative VaR modeling approaches can be used to enrich HS VaR models, improving their response to changes in market volatility. Volatility scaling is a computationally efficient methodology which can resolve many of the shortcomings of HS VaR model, reducing backtesting failures.
Enhancing HS VaR with volatility scaling
The Volatility Scaling methodology is an extension of the HS VaR model that addresses the issue of inertia to market moves. Volatility scaling adjusts the returns for each time t by the volatility ratio σT/σt, where σt is the return volatility at time t and σT is the return volatility at the VaR calculation date. Volatility is calculated using a 30-day window, which more rapidly reacts to market moves than a typical 1Y VaR window, as illustrated in Figure 1. As the cost of underestimation is higher than overestimating VaR, a lower bound to the volatility ratio of 1 is applied. Volatility scaling is simple to implement and can enrich existing models with minimal additional computational overhead.
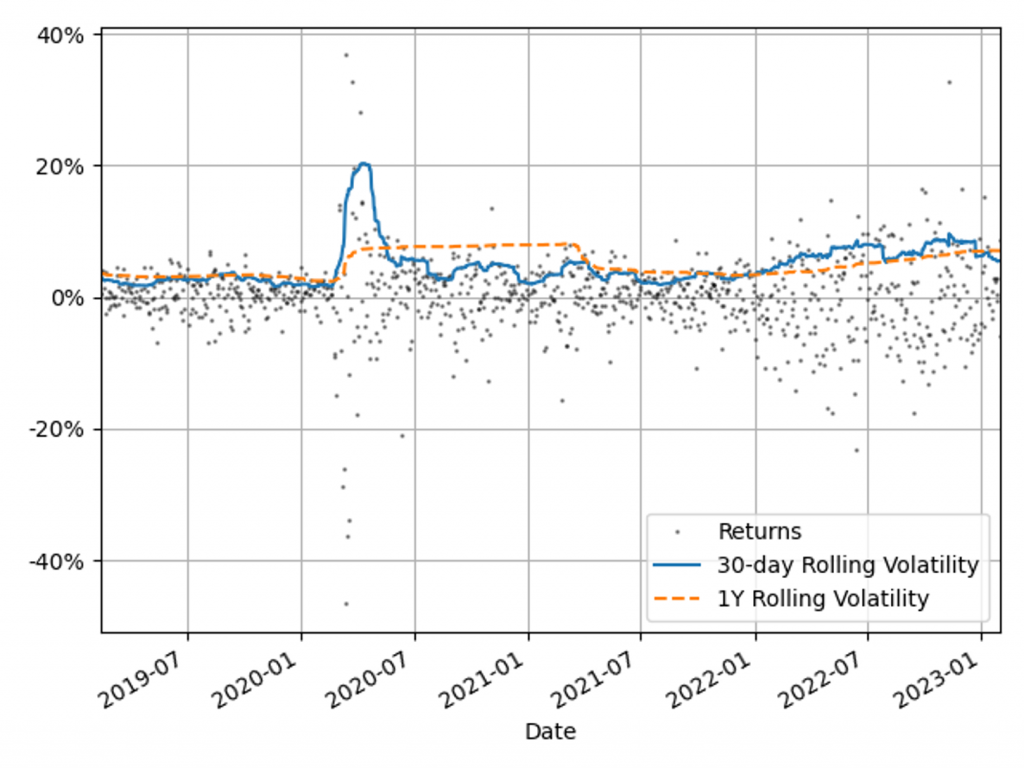
Figure 1: The 30-day and 1Y rolling volatilities of the 1-day scaled diversified portfolio returns. This illustrates recent market stresses, with short regions of extreme volatility (COVID-19) and longer systemic trends (Russia-Ukraine conflict and inflation).
Comparison with alternative VaR models
To benchmark the Volatility Scaling approach, we compare the VaR performance with the HS and the GARCH(1,1) parametric VaR models. The GARCH(1,1) model is configured for daily data and parameter calibration to increase sensitivity to market volatility. All models use the 99th percentile 1-day VaR scaled by a square root of 10. The effective calibration time horizon is one year, approximated by a VaR window of 260 business days. A one-week lag is included to account for operational issues that banks may have to load the most up-to-date market data into their risk models.
VaR benchmarking portfolios
To benchmark the VaR Models, their performance is evaluated on several portfolios that are sensitive to the equity, rates and credit asset classes. These portfolios include sensitivities to: S&P 500 (Equity), US Treasury Bonds (Treasury), USD Investment Grade Corporate Bonds (IG Bonds) and a diversified portfolio of all three asset classes (Diversified). This provides a measure of the VaR model performance for both diversified and a range of concentrated portfolios. The performance of the VaR models is measured on these portfolios in both periods of stability and periods of extreme market volatility. This test period includes COVID-19, the Russia-Ukraine conflict and the recent high inflationary period.
VaR model benchmarking
The performance of the models is evaluated with VaR backtesting. The results show that the volatility scaling provides significantly improved performance over both the HS and GARCH VaR models, providing a faster response to markets moves and a lower instance of VaR exceptions.
Model benchmarking with VaR backtesting
A key metric for measuring the performance of VaR models is a comparison of the frequency of VaR exceptions with the limits set by the Basel Committee’s Traffic Light Test (TLT). Excessive exceptions will incur an increased capital multiplier for an Amber result (5 – 9 exceptions) and an intervention from the regulator in the case of a Red result (ten or more exceptions). Exceptions often indicate a slow reaction to market moves or a lack of accuracy in modeling risk.
VaR measure coverage
The coverage and adaptability of the VaR models can be observed from the comparison of the realised returns and VaR time series shown in Figure 2. This shows that although the GARCH model is faster to react to market changes than HS VaR, it underestimates the tail risk in stable markets, resulting in a higher instance of exceptions. Volatility scaling retains the conservatism of the HS VaR model whilst improving its reactivity to turbulent market conditions. This results in a significant reduction in exceptions throughout 2022.
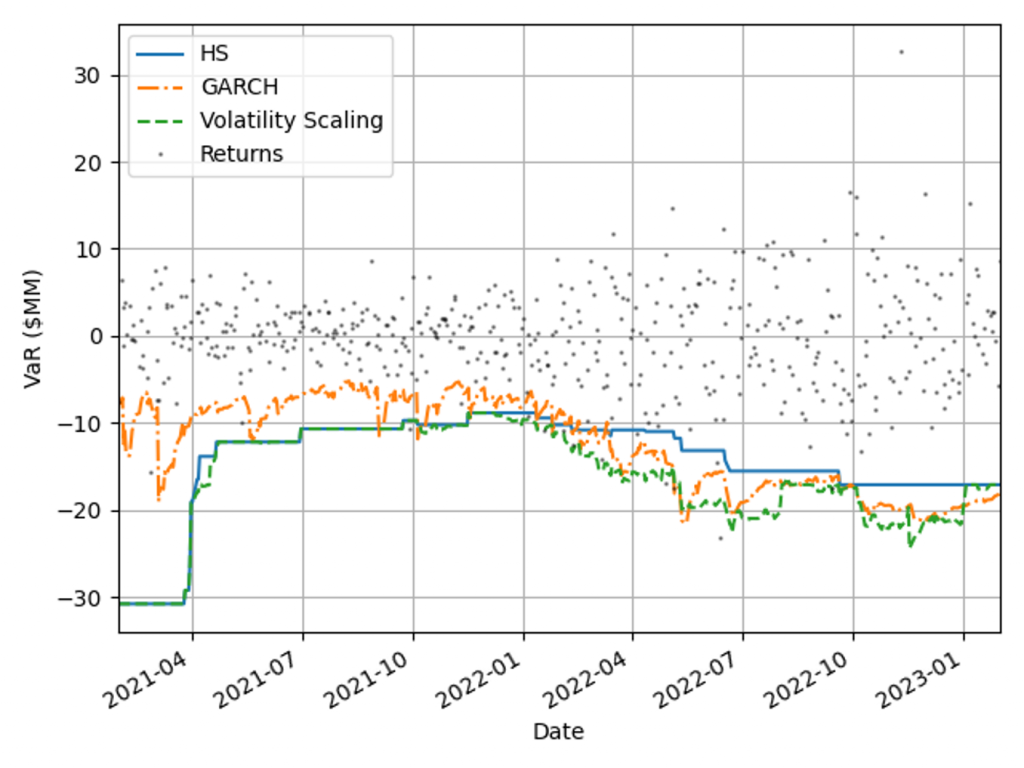
Figure 2: Comparison of realised returns with the model VaR measures for a diversified portfolio.
VaR backtesting results
The VaR model performance is illustrated by the percentage of backtest days with Red, Amber and Green TLT results in Figure 3. Over this period HS VaR shows a reasonable coverage of the hypothetical P&Ls, however there are instances of Red results due to the failure to adapt to changes in market conditions. The GARCH model shows a significant reduction in performance, with 32% of test dates falling in the Red zone as a consequence of VaR underestimation in calm markets. The adaptability of volatility scaling ensures it can adequately cover the tail risk, increasing the percentage of Green TLT results and completely eliminating Red results. In this benchmarking scenario, only volatility scaling would pass regulatory scrutiny, with HS VaR and GARCH being classified as flawed models, requiring remediation plans.
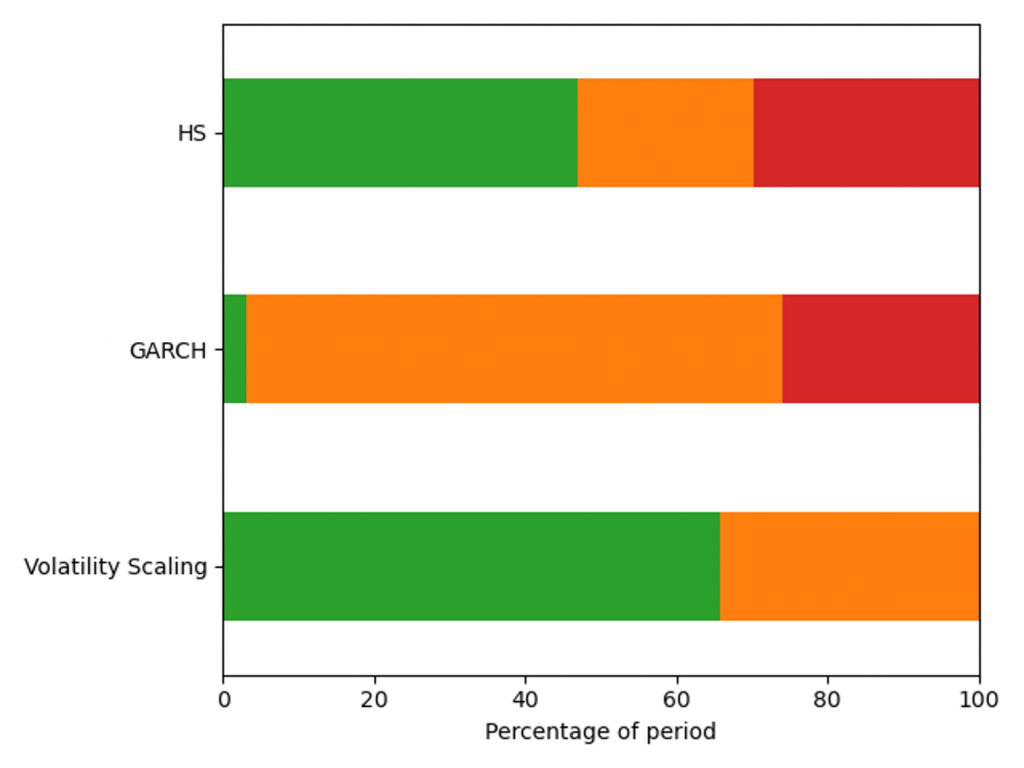
Figure 3: Percentage of days with a Red, Amber and Green Traffic Light Test result for a diversified portfolio over the window 29/01/21 - 31/01/23.
VaR model capital requirements
Capital requirements are an important determinant in banks’ ability to act as market intermediaries. The volatility scaling method can be used to increase the HS capital deployment efficiency without compromising VaR backtesting results.
Capital requirements minimisation
A robust VaR model produces risk measures that ensure an ample capital buffer to absorb portfolio losses. When selecting between robust VaR models, the preferred approach generates a smaller capital charge throughout the market cycle. Figure 4 shows capital requirements for the VaR models for a diversified portfolio calculated using Equation 1, with 𝐴𝑑𝑑𝑜𝑛𝑠 set to zero. Volatility scaling outperforms both models during extreme market volatility (the Russia-Ukraine conflict) and the HS model in period of stability (2021) as a result of setting the lower scaling constraint. The GARCH model underestimates capital requirements in 2021, which would have forced a bank to move to a standardised approach.
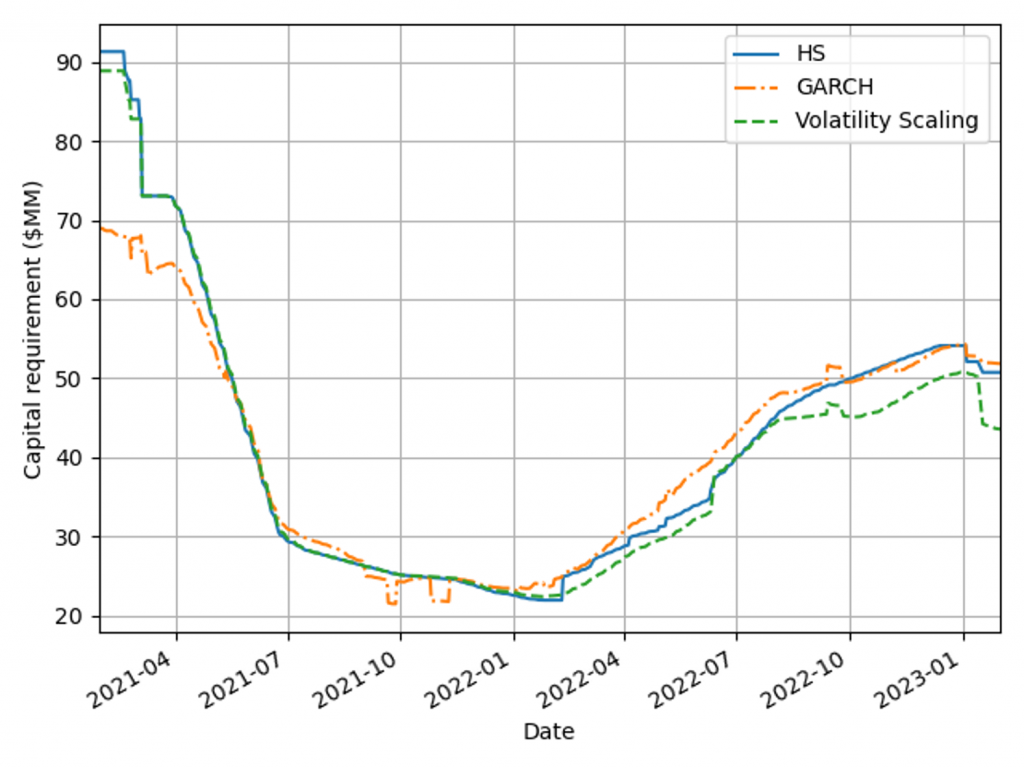
Figure 4: Capital charge for the VaR models measured on a diversified portfolio over the window 29/01/21 - 31/01/23.
Capital management efficiency
Pro-cyclicality of capital requirements is a common concern among regulators and practitioners. More stable requirements can improve banks’ capital management and planning. To measure models’ pro-cyclicality and efficiency, average capital charges and capital volatilities are compared for three concentrated asset class portfolios and a diversified market portfolio, as shown in Table 2. Volatility scaling results are better than the HS model across all portfolios, leading to lower capital charges, volatility and more efficient capital allocation. The GARCH model tends to underestimate high volatility and overestimate low volatility, as seen by the behaviour for the lowest volatility portfolio (Treasury).
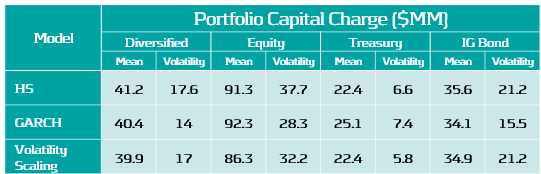
Table 2: Average capital requirement and capital volatility for each VaR model across a range of portfolios during the test period, 29/01/21 - 31/01/23.
Conclusions on VaR backtesting
Recent periods of market stress highlighted the need to challenge banks’ existing VaR models. Volatility scaling is an efficient method to enrich existing VaR methodologies, making them robust across a range of portfolios and volatility regimes.
VaR backtesting in a volatile market
Ensuring VaR models conform to VaR backtesting will be challenging with the recent period of stressed market conditions and rapid changes in market volatility. Banks will need to ensure that their VaR models are responsive to volatility clustering and tail events or enhance their existing methodology to cope. Failure to do so will result in additional overheads, with increased capital charges and excessive exceptions that can lead to additional regulatory scrutiny.
Enriching VaR Models with volatility scaling
Volatility scaling provides a simple extension of HS VaR that is robust and responsive to changes in market volatility. The model shows improved backtesting performance over both the HS and parametric (GARCH) VaR models. It is also robust for highly concentrated equity, treasury and bond portfolios, as seen in Table 3. Volatility scaling dampens pro-cyclicality of HS capital requirements, ensuring more efficient capital planning. The additional computational overhead is minimal and the implementation to enrich existing models is simple. Performance can be further improved with the use of hybrid models which incorporate volatility scaling approaches. These can utilise outlier detection to increase conservatism dynamically with increasingly volatile market conditions.
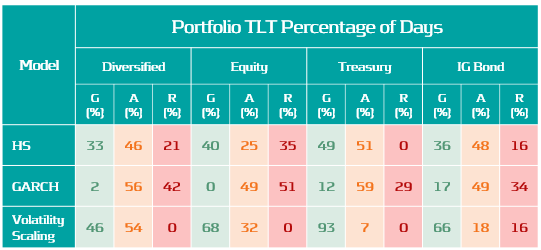
Table 3: Percentage of Green, Amber and Red traffic Lights test results for each VaR model across a range of portfolios for dates in the range: 13/02/19 - 31/01/23.
Zanders recommends
Banks should invest in making their VaR models more robust and reactive to ensure capital costs and the probability of exceptions are minimised. VaR models enriched with a volatility scaling approach should be considered among a suite of models to challenge existing VaR model methodologies. Methods similar to volatility scaling can also be applied to parametric and semi-parametric models. Outlier detection models can be used to identify changes in market regime as either feeder models or early warning signals for risk managers

Learn how banks can reduce capital charges under FRTB by using proxies, external data, and customized risk factor bucketing to minimize non-modellable risk factors (NMRFs).
Non-modellable risk factors (NMRFs) have been shown to be one of the largest contributors to capital charges under FRTB. The use of proxies is one of the methods that banks can employ to increase the modellability of risk factors and reduce the number of NMRFs. Other potential methods for improving the modellability of risk factors is using external data sources and modifying risk factor bucketing approaches.
Proxies and FRTB
A proxy is utilised when there is an insufficient historical data for a risk factor. A lack of historical data increases the likelihood of the risk factor failing the Risk Factor Eligibility Test (RFET). Consequently, using proxies ensures that the number of NMRFs is reduced and capital charges are kept to a minimum. Although the use of proxies is allowed, regulation states that their usage must be limited, and they must have sufficiently similar characteristics to the risk factors which they represent.
Banks must be ready to provide evidence to regulators that their chosen proxies are conceptually and empirically sound. Despite the potential reduction in capital, developing proxy methodologies can be time-consuming and require considerable ongoing monitoring. There are two main approaches which are used to develop proxies: rules-based and statistical.
Proxy decomposition
FRTB regulation allows NMRFs to be decomposed into modellable components and a residual basis, which must be capitalised as non-modellable. For example, credit spreads for small issuers which are not highly liquid can be decomposed into a liquid credit spread index component, which is classed as modellable, and a non-modellable basis or spread.
To test modellability using the RFET, 12-months of data is required for the proxy and basis components. If the basis between the proxy and the risk factor has not been identified and properly capitalised, only the proxy representation of the risk factor can be used in the Risk Theoretical P&L (RTPL). However, if the capital requirement for a basis is determined, either: (i) the proxy risk factor and the basis; or (ii) the original risk factor itself can be included in the RTPL.
Banks should aim to produce preliminary analysis on the cost benefits of proxy development – does the cost and effort of developing proxies outweigh the capital which could be saved by increasing risk factor modellability? For example, proxies which are highly volatile may also result in increasing NMRF capital charges.

Approaches for the development of proxies
Both rules-based and statistical approaches to developing proxies require considerable effort. Banks should aim to develop statistical approaches as they have been shown to be more accurate and also more efficient in reducing capital requirements for banks.
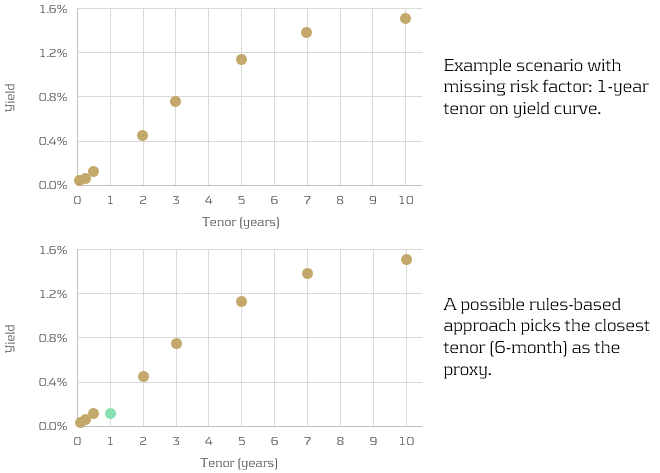
Rules-based approach
Rules-based approaches are more simplistic, however are less accurate than the statistical approaches. They find the “closest fit” modellable risk factor using somewhat more qualitative methods. For example, picking the closest tenor on a yield curve (see below), using relevant indices or ETFs, or limiting the search for proxies to the same sector as the underlying risk factor.
Similarly, longer tenor points (which may not be traded as frequently) can be decomposed into shorter-tenor points and cross-tenor basis spread.
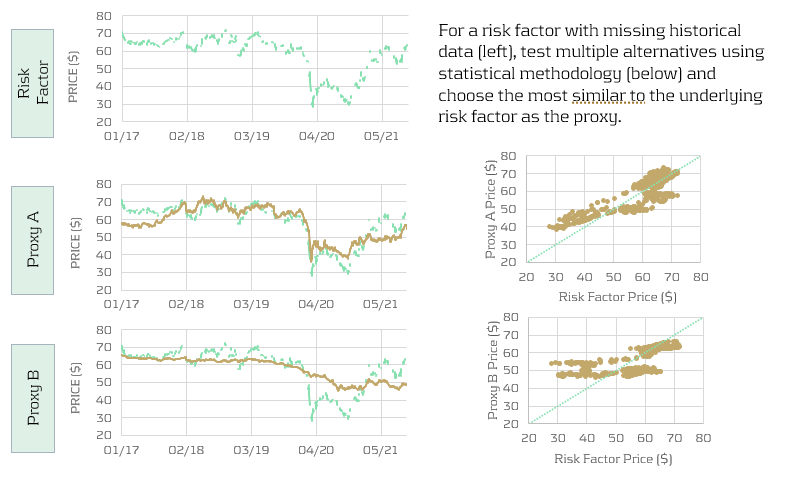
Statistical approach
Statistical approaches are more quantitate and more accurate than the rules-based approaches. However, this inevitably comes with computational expense. A large number of candidates are tested using the chosen statistical methodology and the closest is picked (see below).
For example, a regression approach could be used to identify which of the candidates are most correlated with the underlying risk factor. Studies have shown that statistical approaches not only produce the more accurate proxies, but can also reduce capital charges by almost twice as much as simpler rules-based approaches.
Conclusion
Risk factor modellability is a considerable concern for banks as it has a direct impact on the size of their capital charges. Inevitably, reducing the number of NMRFs is a key aim for all IMA banks. In this article, we show that developing proxies is one of the strategies that banks can use to minimise the amount of NMRFs in their models. Furthermore, we describe the two main approaches for developing proxies: rules-based and statistical. Although rules-based approaches are less complicated to develop, statistical approaches show much better accuracy and hence have the potential to better reduce capital charges.

Explore key strategies to minimize non-modellable risk factors (NMRFs) under FRTB’s internal models approach, including enhancing data, creating proxies, and customizing bucketing, to manage your bank’s capital requirements more effectively.
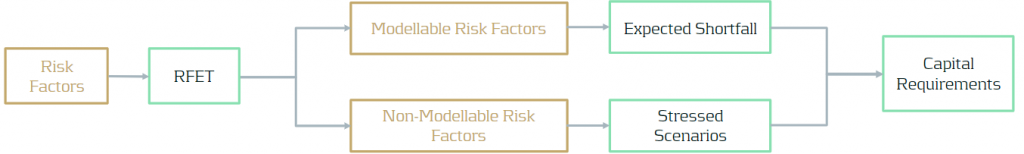
Under the FRTB internal models approach (IMA), the capital calculation of risk factors is dependent on whether the risk factor is modellable. Insufficient data will result in more non-modellable risk factors (NMRFs), significantly increasing associated capital charges.
NMRFs
Risk factor modellability and NMRFs
The modellability of risk factors is a new concept which was introduced under FRTB and is based on the liquidity of each risk factor. Modellability is measured using the number of ‘real prices’ which are available for each risk factor. Real prices are transaction prices from the institution itself, verifiable prices for transactions between arms-length parties, prices from committed quotes, and prices from third party vendors.
For a risk factor to be classed as modellable, it must have a minimum of 24 real prices per year, no 90-day period with less than four prices, and a minimum of 100 real prices in the last 12 months (with a maximum of one real price per day). The Risk Factor Eligibility Test (RFET), outlined in FRTB, is the process which determines modellability and is performed quarterly. The results of the RFET determine, for each risk factor, whether the capital requirements are calculated by expected shortfall or stressed scenarios.
Consequences of NMRFs for banks
Modellable risk factors are capitalised via expected shortfall calculations which allow for diversification benefits. Conversely, capital for NMRFs is calculated via stressed scenarios which result in larger capital charges. This is due to longer liquidity horizons and more prudent assumptions used for aggregation. Although it is expected that a low proportion of risk factors will be classified as non-modellable, research shows that they can account for over 30% of total capital requirements.
There are multiple techniques that banks can use to reduce the number and impact of NMRFs, including the use of external data, developing proxies, and modifying the parameterisation of risk factor curves and surfaces. As well as focusing on reducing the number of NMRFs, banks will also need to develop early warning systems and automated reporting infrastructures to monitor the modellability of risk factors. These tools help to track and predict modellability issues, reducing the likelihood that risk factors will fail the RFET and increase capital requirements.
Methods for reducing the number of NMRFs
Banks should focus on reducing their NMRFs as they are associated with significantly higher capital charges. There are multiple approaches which can be taken to increase the likelihood that a risk factor passes the RFET and is classed as modellable.
Enhancing internal data
The simplest way for banks to reduce NMRFs is by increasing the amount of data available to them. Augmenting internal data with external data increases the number of real prices available for the RFET and reduces the likelihood of NMRFs. Banks can purchase additional data from external data vendors and data pooling services to increase the size and quality of datasets.
It is important for banks to initially investigate their internal data and understand where the gaps are. As data providers vary in which services and information they provide, banks should not only focus on the types and quantity of data available. For example, they should also consider data integrity, user interfaces, governance, and security. Many data providers also offer FRTB-specific metadata, such as flags for RFET liquidity passes or fails.
Finally, once a data provider has been chosen, additional effort will be required to resolve discrepancies between internal and external data and ensure that the external data follows the same internal standards.
Creating risk factor proxies
Proxies can be developed to reduce the number or magnitude of NMRFs, however, regulation states that their use must be limited. Proxies are developed using either statistical or rules-based approaches.
Rules-based approaches are simplistic, yet generally less accurate. They find the “closest fit” modellable risk factor using more qualitative methods, e.g. using the closest tenor on the interest rate curve. Alternatively, more accurate approaches model the relationship between the NMRF and modellable risk factors using statistical methods. Once a proxy is determined, it is classified as modellable and only the basis between it and the NMRF is required to be capitalised using stressed scenarios.
Determining proxies can be time-consuming as it requires exploratory work with uncertain outcomes. Additional ongoing effort will also be required by validation and monitoring units to ensure the relationship holds and the regulator is satisfied.
Developing own bucketing approach
Instead of using the prescribed bucketing approach, banks can use their own approach to maximise the number of real price observations for each risk factor.
For example, if a risk model requires a volatility surface to price, there are multiple ways this can be parametrised. One method could be to split the surface into a 5x5 grid, creating 25 buckets that would each require sufficient real price observations to be classified as modellable. Conversely, the bank could instead split the surface into a 2x2 grid, resulting in only four buckets. The same number of real price observations would then need to be allocated between significantly less buckets, decreasing the chances of a risk factor being a NMRF.
It should be noted that the choice of bucketing approach affects other aspects of FRTB. Profit and Loss Attribution (PLA) uses the same buckets of risk factors as chosen for the RFET. Increasing the number of buckets may increase the chances of passing PLA, however, also increases the likelihood of risk factors failing the RFET and being classed as NMRFs.
Conclusion
In this article, we have described several potential methods for reducing the number of NMRFs. Although some of the suggested methods may be more cost effective or easier to implement than others, banks will most likely, in practice, need to implement a combination of these strategies in parallel. The modellability of risk factors is clearly an important part of the FRTB regulation for banks as it has a direct impact on required capital. Banks should begin to develop strategies for reducing the number of NMRFs as early as possible if they are to minimise the required capital when FRTB goes live.

Discover the significant deficiencies uncovered by the EBA’s TRIM on-site inspections and how banks must swiftly address these to ensure compliance and mitigate risk.
The EBA has recently published the findings and observations from their TRIM on-site inspections. A significant number of deficiencies were identified and are required to be remediated by institutions in a timely fashion.
Since the Global Financial Crisis 2007-09, concerns have been raised regarding the complexity and variability of the models used by institutions to calculate their regulatory capital requirements. The lack of transparency behind the modeling approaches made it increasingly difficult for regulators to assess whether all risks had been appropriately and consistently captured.
The TRIM project was a large-scale multi-year supervisory initiative launched by the ECB at the beginning of 2016. The project aimed to confirm the adequacy and appropriateness of approved Pillar I internal models used by Significant Institutions (SIs) in euro area countries. This ensured their compliance with regulatory requirements and aimed to harmonise supervisory practices relating to internal models.
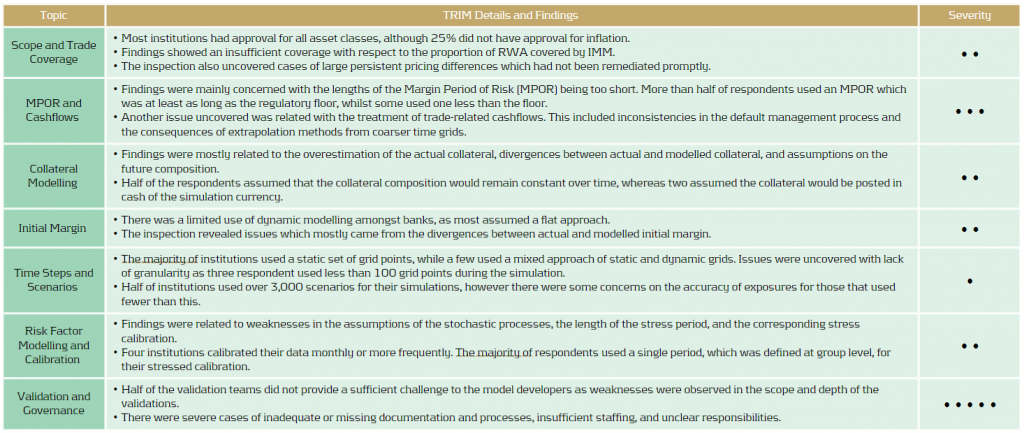
TRIM executed 200 on-site internal model investigations across 65 SIs from over 10 different countries. Over 5,800 deficiencies were identified. Findings were defined as deficiencies which required immediate supervisory attention. They were categorised depending on the actual or potential impact on the institution’s financial situation, the levels of own funds and own funds requirements, internal governance, risk control, and management.
The findings have been followed up with 253 binding supervisory decisions which request that the SIs mitigate these shortcomings within a timely fashion. Immediate action was required for findings that were deemed to take a significant time to address.
Assessment of Market Risk
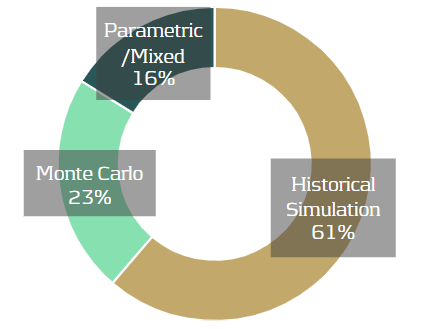
TRIM assessed the VaR/sVaR models of 31 institutions. The majority of severe findings concerned the general features of the VaR and sVaR modeling methodology, such as data quality and risk factor modeling.
19 out of 31 institutions used historical simulation, seven used Monte Carlo, and the remainder used either a parametric or mixed approach. 17 of the historical simulation institutions, and five using Monte Carlo, used full revaluation for most instruments. Most other institutions used a sensitivities-based pricing approach.
VaR/sVaR Methodology
Data: Issues with data cleansing, processing and validation were seen in many institutions and, on many occasions, data processes were poorly documented.
Risk Factors: In many cases, risk factors were missing or inadequately modelled. There was also insufficient justification or assessment of assumptions related to risk factor modeling.
Pricing: Institutions frequently had inadequate pricing methods for particular products, leading to a failure for the internal model to adequately capture all material price risks. In several cases, validation activities regarding the adequacy of pricing methods in the VaR model were insufficient or missing.
RNIME: Approximately two-thirds of the institutions had an identification process for risks not in model engines (RNIMEs). For ten of these institutions, this directly led to an RNIME add-on to the VaR or to the capital requirements.
Regulatory Backtesting
Period and Business Days: There was a lack of clear definitions of business and non-business days at most institutions. In many cases, this meant that institutions were trading on local holidays without adequate risk monitoring and without considering those days in the P&L and/or the VaR.
APL: Many institutions had no clear definition of fees, commissions or net interest income (NII), which must be excluded from the actual P&L (APL). Several institutions had issues with the treatment of fair value or other adjustments, which were either not documented, not determined correctly, or were not properly considered in the APL. Incorrect treatment of CVAs and DVAs and inconsistent treatment of the passage of time (theta) effect were also seen.
HPL: An insufficient alignment of pricing functions, market data, and parametrisation between the economic P&L (EPL) and the hypothetical P&L (HPL), as well as the inconsistent treatment of the theta effect in the HPL and the VaR, was seen in many institutions.
Internal Validation and Internal Backtesting
Methodology: In several cases, the internal backtesting methodology was considered inadequate or the levels of backtesting were not sufficient.
Hypothetical Backtesting: The required backtesting on hypothetical portfolios was either not carried or was only carried out to a very limited extent
IRC Methodology
TRIM assessed the IRC models of 17 institutions, reviewing a total of 19 IRC models. A total of 120 findings were identified and over 80% of institutions that used IRC models received at least one high-severity finding in relation to their IRC model. All institutions used a Monte Carlo simulation method, with 82% applying a weekly calculation. Most institutions obtained rates from external rating agency data. Others estimated rates from IRB models or directly from their front office function. As IRC lacks a prescriptive approach, the choice of modeling approaches between institutes exhibited a variety of modeling assumptions, as illustrated below.
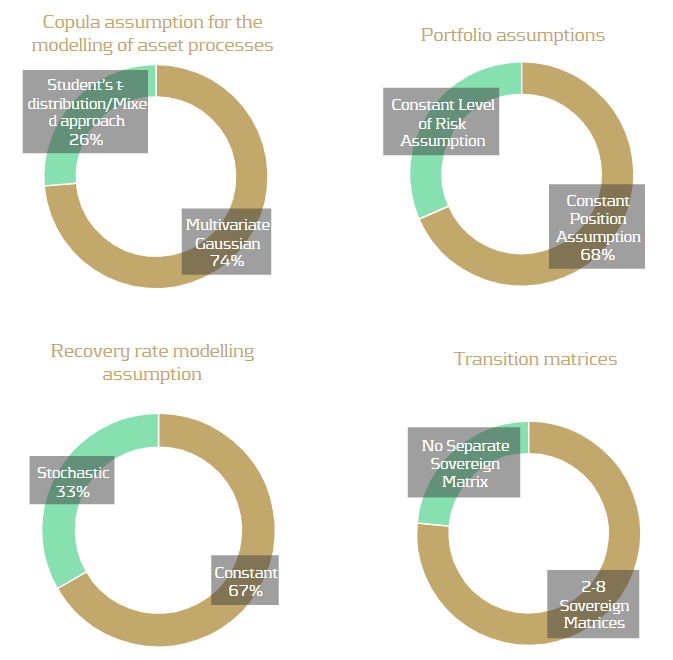
Recovery rates: The use of unjustified or inaccurate Recovery Rates (RR) and Probability of Defaults (PD) values were the cause of most findings. PDs close to or equal to zero without justification was a common issue, which typically arose for the modeling of sovereign obligors with high credit quality. 58% of models assumed PDs lower than one basis point, typically for sovereigns with very good ratings but sometimes also for corporates. The inconsistent assignment of PDs and RRs, or cases of manual assignment without a fully documented process, also contributed to common findings.
Modelingapproach: The lack of adequate modeling justifications presented many findings, including copula assumptions, risk factor choice, and correlation assumptions. Poor quality data and the lack of sufficient validation raised many findings for the correlation calibration.
Assessment of Counterparty Credit Risk
Eight banks faced on-site inspections under TRIM for counterparty credit risk. Whilst the majority of investigations resulted in findings of low materiality, there were severe weaknesses identified within validation units and overall governance frameworks.
Conclusion
Based on the findings and responses, it is clear that TRIM has successfully highlighted several shortcomings across the banks. As is often the case, many issues seem to be somewhat systemic problems which are seen in a large number of the institutions. The issues and findings have ranged from fundamental problems, such as missing risk factors, to more complicated problems related to inadequate modeling methodologies. As such, the remediation of these findings will also range from low to high effort. The SIs will need to mitigate the shortcomings in a timely fashion, with some more complicated or impactful findings potentially taking a considerable time to remediate.

Discover how leveraging synergies across key regulatory frameworks like SIMM, BCBS 239, SA-CVA, and the IBOR transition can streamline your compliance efforts and ease the burden of FRTB implementation.
Regulatory Landscape
Despite a delay of one year, many banks are struggling to be ready for FRTB in January 2023. Alongside the FRTB timeline, banks are also preparing for other important regulatory requirements and deadlines which share commonalities in implementation. We introduce several of these below.
SIMM
Initial Margin (IM) is the value of collateral required to open a position with a bank, exchange or broker. The Standard Initial Margin Model (SIMM), published by ISDA, sets a market standard for calculating IMs. SIMM provides margin requirements for financial firms when trading non-centrally cleared derivatives.
BCBS 239
BCBS 239, published by the Basel Committee on Banking Supervision, aims to enhance banks’ risk data aggregation capabilities and internal risk reporting practices. It focuses on areas such as data governance, accuracy, completeness and timeliness. The standard outlines 14 principles, although their high-level nature means that they are open to interpretation.
SA-CVA
Credit Valuation Adjustment (CVA) is a type of value adjustment and represents the market value of the counterparty credit risk for a transaction. FRTB splits CVA into two main approaches: BA-CVA, for smaller banks with less sophisticated trading activities, and SA-CVA, for larger banks with designated CVA risk management desks.
IBOR
Interbank Offered Rates (IBORs) are benchmark reference interest rates. As they have been subject to manipulation and due to a lack of liquidity, IBORs are being replaced by Alternative Reference Rates (ARRs). Unlike IBORs, ARRs are based on real transactions on liquid markets rather than subjective estimates.
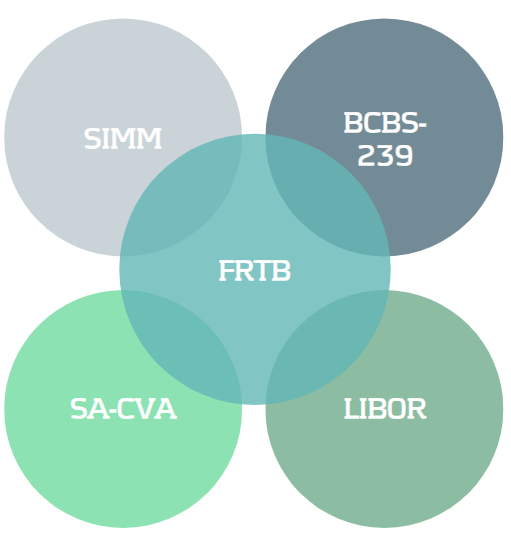
Synergies With Current Regulation
Existing SIMM and BCBS 239 frameworks and processes can be readily leveraged to reduce efforts in implementing FRTB frameworks.
SIMM
The overarching process of SIMM is very similar to the FRTB Sensitivities-based Method (SbM), including the identification of risk factors, calculation of sensitivities and aggregation of results. The outputs of SbM and SIMM are both based on delta, vega and curvature sensitivities. SIMM and FRTB both share four risk classes (IR, FX, EQ, and CM). However, in SIMM, credit is split across two risk classes (qualifying and non-qualifying), whereas it is split across three in FRTB (non-securitisation, securitisation and correlation trading). For both SbM and SIMM, banks should be able to decompose indices into their individual constituents.
We recommend that banks leverage the existing sensitivities infrastructure from SIMM for SbM calculations, use a shared risk factor mapping methodology between SIMM and FRTB when there is considerable alignment in risk classes, and utilise a common index look-through procedure for both SIMM and SbM index decompositions.
BCBS 239
BCBS 239 requires banks to review IT infrastructure, governance, data quality, aggregation policies and procedures. A similar review will be required in order to comply with the data standards of FRTB. The BCBS 239 principles are now in “Annex D” of the FRTB document, clearly showing the synergy between the two regulations. The quality, transparency, volume and consistency of data are important for both BCBS 239 and FRTB. Improving these factors allow banks to easily follow the BCBS 239 principles and decrease the capital charges of non-modellable risk factors. BCBS 239 principles, such as data completeness and timeliness, are also necessary for passing P&L attribution (PLA) under FRTB.
We recommend that banks use BCBS 239 principles when designing the necessary data frameworks for the FRTB Risk Factor Eligibility Test (RFET), support FRTB traceability requirements and supervisory approvals with existing BCBS 239 data lineage documentation, and produce market risk reporting for FRTB using the risk reporting infrastructure detailed in BCBS 239.
Synergies With Future Regulation
The IBOR transition and SA-CVA will become effective from 2023. Aligning the timelines and exploiting the similarities between FRTB, SA-CVA and the IBOR transition will support banks to be ready for all three regulatory deadlines.
SA-CVA
Four of the six risk classes in SA-CVA (IR, FX, EQ, and CM) are identical to those in SbM. SA-CVA, however, uses a reduced granularity for risk factors compared to SbM. The SA-CVA capital calculation uses a similar methodology to SbM by combining sensitivities with risk weights. SA-CVA also incorporates the same trade population and metadata as SbM. SA-CVA capital requirements must be calculated and reported to the supervisor at the same monthly frequency as for the market risk standardised approach.
We recommend that banks combine SA-CVA and SbM risk factor bucketing tasks in a common methodology to reduce overall effort, isolate common components of both models as a feeder model, allowing a single stream for model development and validation, and develop a single system architecture which can be configured for either SbM or SA-CVA.
IBOR Transition
Although not a direct synergy, the transition from IBORs will have a direct impact to the Internal Models Approach (IMA) for FRTB and eligibility of risk factors. As the use of IBORs are discontinued, banks may observe a reduction in the number of real-price observations for associated risk factors due to a reduction in market liquidity. It is not certain if these liquidity issues fall under the RFET exemptions for systemic circumstances, which apply to modellable risk factors which can no longer pass the test. It may be difficult for banks to obtain stress-period data for ARRs, which could lead to substantial efforts to produce and justify proxies. The transition may cause modifications to trading desk structure, the integration of external data providers, and enhanced operational requirements, which can all affect FRTB.
We recommend that banks investigate how much data is available for ARRs, for both stress-period calculations and real-price observations, develop any necessary proxies which will be needed to overcome data availability issues, as soon as possible, and Calculate IBOR capital consequences through the existing FRTB engine.
Conclusion
FRTB implementation is proving to be a considerable workload for banks, especially those considering opting for the IMA. Several FRTB requirements, such as PLA and RFET, are completely new requirements for banks. As we have shown in this article, there are several other important regulatory requirements which banks are currently working towards. As such, we recommend that banks should leverage the synergies which are seen across this regulatory landscape to reduce the complexity and workload of FRTB.
Treasury transformation refers to the definition and implementation of the future state of a treasury department. This includes treasury organization & strategy, the banking landscape, system infrastructure and treasury workflows & processes.
Treasury transformation refers to the definition and implementation of the future state of a treasury department. This includes treasury organization & strategy, the banking landscape, system infrastructure and treasury workflows & processes.
Introduction
Zanders has witnessed first-hand a treasury transformation trend sweeping global corporate treasuries in recent years and has seen an elite group of multinationals pursue increased efficiency, enhanced visibility and reduced cost on a grand scale in their respective finance and treasury organizations.
Triggers for treasury transformations
Why does a treasury need to transform? There comes a point in an organization’s life when it is necessary to take stock of where it is coming from, how it has grown and especially where it wants to be in the future.
Corporates grow in various ways: through the launch of new products, by entering new markets, through acquisitions or by developing strong pipelines. However, to sustain further growth they need to reinforce their foundations and transform themselves into stronger, leaner, better organizations.
What triggers a treasury organization to transform? Before defining the treasury transformation process, it is interesting to look at the drivers behind a treasury transformation. Zanders has identified five main triggers:
1. Organic growth of the organization Growth can lead to new requirements.
As a result of successive growth the as-is treasury infrastructure might simply not suffice anymore, requiring changes in policies, systems and controls.
2. Desire to be innovative and best-in-class
A common driver behind treasury transformation projects is the basic human desire to be best-in-class and continuously improve treasury processes. This is especially the case with the development of new technology and/or treasury concepts.
3. Event-driven
Examples of corporate events triggering the need for a redesign of the treasury organization include mergers, acquisitions, spin-off s and restructurings. For example, in the case of a divestiture, a new treasury organization may need to be established. After a merger, two completely different treasury units, each with their own systems, processes and people, will need to find a new shape as a combined entity.
4. External factors
The changing regulatory environment and increased volatility in financial markets have been major drivers behind treasury transformation in recent years. Corporate treasurers need to have a tighter grasp on enterprise risks and quicker access to information.
5. The changing role of corporate treasury
Finally the changing role of corporate treasury itself is a driver of transformation projects. The scope of the treasury organization is expanding into the fi nancial supply chain and as a result the relationship between the CFO and the corporate treasurer is growing stronger. This raises new expectations and demands of treasury technology and organization.
Treasury transformation – strategic opportunities for simplification
A typical treasury transformation program focuses on treasury organization, the banking landscape, system infrastructure and treasury workflows & processes. The table below highlights typical trends seen by Zanders as our clients strive for simplified and effective treasury organizations. From these trends we can see many state of the art treasuries strive to:
- be centralized
- outsource routine tasks and activities to a financial shared service centre (FSSC)
- have a clear bank relationship management strategy and have a balanced banking wallet
- maintain simple and transparent bank account structures with automatic cash concentration mechanisms
- be bank agnostic as regards bank connectivity and formats
- operate a fully integrated system landscape
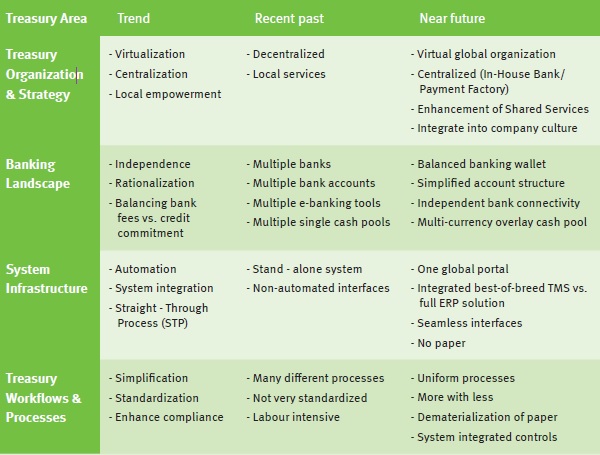
Figure 1: Strategic opportunities for simplification
The seven steps
Zanders has developed a structured seven-step approach towards treasury transformation programs. These seven steps are shown in Figure 2 below

Figure 2: Zanders seven steps to treasury transformation projects
Step 1: Review & Assessment
Review & assessment, as in any business transformation exercise, provides an in-depth understanding of a treasury’s current state. It is important for the company to understand their existing processes, identify disconnects and potential process improvements.
The review & assessment phase focusses on the key treasury activities of treasury management, risk management and corporate finance. The first objective is to gain an in-depth understanding of the following areas:
- organizational structure
- governance and strategy policies
- banking infrastructure and cash management
- financial risk management
- treasury systems infrastructure
- treasury workflows and processes
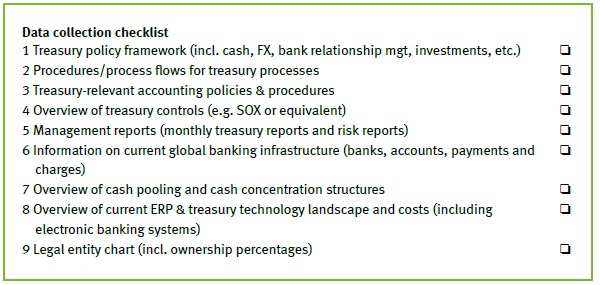
Figure 3: Example of data collection checklist for review & assessment
Based on the review and assessment, existing short-falls can be identified as well as where the treasury organization wants to go in the future, both operationally and strategically.
Figure 4 shows Zanders’ approach towards the review and assessment step.

Figure 4: Review & assessment break-down
Typical findings
Based on Zanders’ experience, common findings of a review and assessment are listed below:
Treasury organization & strategy:
- Disjointed sets of policies and procedures
- Organizational structure not sufficiently aligned with required segregation of duties
- Activities being done locally which could be centralized (e.g. into a FSSC), thereby realizing economies of scale
- Treasury resources spending the majority of their time on operational tasks that don’t add value and that could be automated. This prevents treasury from being able to focus sufficiently on strategic tasks, projects and fulfilling its internal consulting role towards the business.
Banking landscape:
- Mismatch between wallet share of core banking partners and credit commitment provided
- No overview of all bank accounts of the company nor of the balances on these bank accounts
- While cash management and control of bank accounts is often highly centralized, local balances can be significant due to missing cash concentration structures
- Lack of standardization of payment types and payment processes and different payment fi le formats per bank
System infrastructure:
- Considerable amount of time spent on manual bank statement reconciliation and manual entry of payments
- The current treasury systems landscape is characterized by extensive use of MS Excel, manual interventions, low level of STP and many different electronic banking systems
- Difficulty in reporting on treasury data due to a scattered system landscape
- Manual up and downloads instead of automated interfaces
- Corporate-to-bank communication (payments and bank statements processes) shows significant weaknesses and risks with regard to security and efficiency
Treasury workflows & processes:
- Monitoring and controls framework (especially of funds/payments) are relatively light
- Paper-based account opening processes
- Lack of standardization and simplification in processes
The outcome of the review & assessment step will be the input for step two: Solution Design.
Step 2: Solution Design
The key objective of this step is to establish the high-level design of the future state of treasury organization. During the solution design phase, Zanders will clearly outline the strategic and operational options available, and will make recommendations on how to achieve optimal efficiency, effectiveness and control, in the areas of treasury organization & strategy, banking landscape, system infrastructure and treasury workflows & processes.
Using the review & assessment report and findings as a starting point, Zanders highlights why certain findings exist and outlines how improvements can be implemented, based on best market practices. The forum for these discussions is a set of workshops. The first workshop focuses on “brainstorming” the various options, while the second workshop is aimed at decision-making on choosing and defining the most suitable and appropriate alternatives and choices.
The outcome of these workshops is the solution design document, a blueprint document which will be the basis for any functional and/or technical requirements document required at a later stage of the project when implementing, for example, a new banking landscape or treasury management system.
Step 3: Roadmap
The solution design will include several sub-projects, each with a different priority, some more material than others and all with their own risk profile. It is important therefore for the overall success of the transformation that all sub-projects are logically sequenced, incorporating all inter-relationships, and are managed as one coherent program.
The treasury roadmap organizes the solution design into these sub-projects and prioritizes each area appropriately. The roadmap portrays the timeframe, which is typically two to five years, to fully complete the transformation, estimating individually the duration to fully complete each component of the treasury transformation program.
“A Program is a group of related projects managed in a coordinated manner to obtain benefits and control not available from managing them individually”.
Zanders

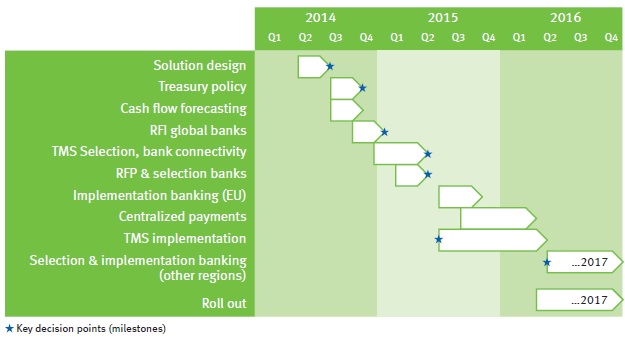
Figure 5: Sample treasury roadmap
Step 4: Business Case
The next step in the treasury transformation program is to establish a business case.
Depending on the individual organization, some transformation programs will require only a very high-level business case, while others require multiple business cases; a high level business case for the entire program and subsequent more detailed business cases for each of the sub-projects.
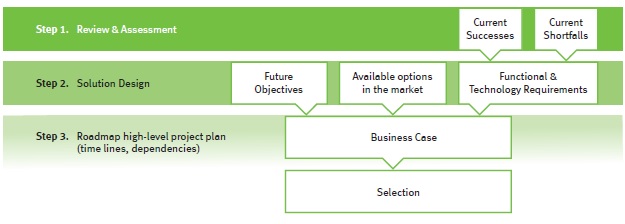
Figure 6: Building a business case
The business case for a treasury transformation program will include the following three parts:
- The strategic context identifies the business needs, scope and desired outcomes, resulting from the previous steps
- The analysis and recommendation section forms the significant part of the business case and concerns itself with understanding all of the options available, aligning them with the business requirements, weighing the costs against the benefits and providing a complete risk assessment of the project
- The management and controlling section includes the planning and project governance, interdependencies and overall project management elements
Notwithstanding the financial benefits, there are many common qualitative benefits in transforming the treasury. These intangibles are often more important to the CFO and group treasurer than the financial benefits. Tight control and full compliance are significant features of world-class treasuries and, to this end, they are typically top of the list of reasons for embarking on a treasury transformation program. As companies grow in size and complexity, efficiency is difficult to maintain. After a period of time there may need to be a total overhaul to streamline processes and decrease the level of manual effort throughout the treasury organization. One of the main costs in such multi-year, multi-discipline transformation programs is the change management required over extended periods.
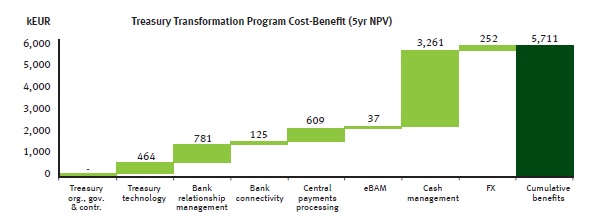
Figure 7: Sample cost-benefit
Figure 7 shows an example of how several sub-projects might contribute to the overall net present value of a treasury transformation program, providing senior management with a tool to assess the priority and resource allocation requirements of each sub-project.
Step 5: Selection(s)
Based on Zanders’ experience gained during previous treasury transformation programs, key evaluation & selection decisions are commonly required for choosing:
- bank partners
- bank connectivity channels
- treasury systems
- organizational structure
Zanders has assisted treasury departments with selection processes for all these components and has developed standardized selection processes and tools.
Selection process for bank partners
Common objectives for including the selection of banking partners in a treasury transformation program include the following:
- to align banks that provide cash and risk management solutions with credit providing banks
- to reduce the number of banks and bank accounts
- to create new banking architecture and cash pooling structures
- to reduce direct and indirect bank charges
- to streamline cash management systems and connectivity
- to meet the service requirements of the business; and
- to provide a robust, scalable electronic platform for future growth/expansion.
Zanders’ approach to bank partner selection is shown in Figure 8 below.

Figure 8: Bank partner selection process
Selection process for bank connectivity providers or treasury systems (treasury management systems, in-house banks, payment factories)
The selection of new treasury technology or a bank connectivity provider will follow the selection process depicted in Figure 9.

Figure 9: Treasury technology selection process
Organizational structure
If change in the organizational structure is part of the solution design, the need for an evaluation and selection of the optimal organizational structure becomes relevant. An example of this would be selecting a location for a FSSC or selecting an outsourcing partner. Based on the high-level direction defined in the solution design and based on Zanders’ extensive experience, we can advise on the best organization structure to be selected, on a functional, strategic and geographical level.
Step 6: Execution
The sixth step of treasury transformation is execution. In this step, the future-state treasury design will be realized. The execution typically consists of various sub-projects either being run in parallel or sequentially.
Zanders’ implementation approach follows the following steps during execution of the various treasury transformation sub-projects. Since treasury transformation entails various types of projects, in the areas of treasury organization, system infrastructure, treasury processes and banking landscape, not all of these steps apply to all projects to the same extent.
For several aspects of a treasury transformation program, such as the implementation of a payment factory, a common and tested approach is to go live with a number of pilot countries or companies first before rolling out the solution across the globe.

Figure 10: Zanders’ execution approach
Step 7: Post-Execution
The post-execution step of a treasury transformation is an important part of the program and includes the following activities:
6-12 months after the execution step:
– project review and lessons learned
– post implementation review focussing on actual benefits realized compared to the initial business case
On an ongoing basis:
– periodic benchmark and continuous improvement review
– ongoing systems maintenance and support
– periodic upgrade of systems
– periodic training of treasury resources
– periodic bank relationship reviews
Zanders offers a wide range of services covering the post-execution step.
Importance of a structured approach
There are many internal and external factors that require treasury organizations to increase efficiency, effectiveness and control. In order to achieve these goals for each of the treasury activities of treasury management, risk management and corporate finance, it is important to take a holistic approach, covering the organizational structure and strategy, the banking landscape, the systems infrastructure and the treasury workflows and processes. Zanders’ seven steps to treasury transformation provides such an approach, by working from a detailed as-is analysis to the implementation of the new treasury organization.
Why Zanders?
Zanders is a completely independent treasury consultancy f rm founded in 1994 by Mr. Chris J. Zanders. Our objective is to create added value for our clients by using our expertise in the areas of treasury management, risk management and corporate finance. Zanders employs over 130 specialist treasury consultants who are the key drivers of our success. At Zanders, our advisory team consists of professionals with different areas of expertise and professional experience in various treasury and finance roles.
Due to our successful growth, Zanders is a leading consulting firm and market leader in independent consulting services in the area of treasury and risk management. Our clients are multinationals, financial institutions and international organizations, all with a global footprint.
Independent advice
Zanders is an independent firm and has no shareholder or ownership relationships with any third party, for example banks, accountancy firms or system vendors. However, we do have good working relationships with the major treasury and risk management system vendors. Due to our strong knowledge of the treasury workstations we have been awarded implementation partnerships by several treasury management system vendors. Next to these partnerships, Zanders is very proud to have been the first consultancy firm to be a certified SWIFTNet management consultant globally.
Thought leader in treasury and finance
Tomorrow’s developments in the areas of treasury and risk management should also have attention focused on them today. Therefore Zanders aims to remain a leading consultant and market leader in this field. We continuously publish articles on topics related to development in treasury strategy and organization, treasury systems and processes, risk management and corporate finance. Furthermore, we organize workshops and seminars for our clients and our consultants speak regularly at treasury conferences organized by the Association of Financial Professionals (AFP), EuroFinance Conferences, International Payments Summit, Economist Intelligence Unit, Association of Corporate Treasurers (UK) and other national treasury associations.
From ideas to implementation
Zanders is supporting its clients in developing ‘best in class’ ideas and solutions on treasury and risk management, but is also committed to implement these solutions. Zanders always strives to deliver, within budget and on time. Our reputation is based on our commitment to the quality of work and client satisfaction. Our goal is to ensure that clients get the optimum benefit of our collective experience.

Compared with only a few years ago, today’s corporate treasurers are exposed to a much greater variety of counterparty risks within both their supply chains and financial institutions. This article provides guidance on how these counterparty risks can be effectively monitored and managed.
In recent years, the counterparty risks that corporates are exposed to have dramatically changed. Besides the traditional default risk that corporates hold on their customers, there has been an increase in counterparty risk regarding the exposures to financial institutions (FIs), the total supply chain, and also to sovereign risk. Market volatility remains high and counterparty risk is one of the top risks that need to be managed. Any failure in managing counterparty risk effectively can result in a direct adverse cash flow effect.
There are two important factors that have resulted in greater attention being paid to counterparty risk related to FIs in treasury. Firstly, FIs are no longer considered ‘immune’ to default. Secondly, the larger and better-rated corporates are now hoarding a day’s more cash compared to their pre-2008 crisis practice, due to restricted investment opportunities in the current economic environment, limited debt redemption and share buy-back possibilities and the desire to have financial flexibility.
Several trends can be identified regarding counterparty risk in the corporate landscape. In a corporate-to-bank relationship, counterparty risk is being increasingly assessed bilaterally. For example, the days are over when counterparty risk mitigating arrangements, such as the credit support annex (CSA) of an International Swaps and Derivative Association (ISDA) agreement, were only in favor of FIs. Nowadays, CSAs are more based on equivalence between the corporate and FI.
Measuring and Quantifying of Counterparty Risks
The magnitude of counterparty risk can be estimated according to the expected loss (EL), which is a combination of the following elements:
- Probability of default (PD): The probability that the counterparty will default.
- Exposure at default (EAD): The total amount of exposure on the counterparty at default. Besides the actual exposure the potential future exposure can also be taken into account. This is the maximum exposure expected to occur in the future at a certain confidence level, based on a credit-at-risk model.
- Loss given default (LGD): Magnitude of actual loss on the exposure at default.
This methodology is also typically applied by FIs to assess counterparty risk and associated EL. The probability of default is an indicator of the credit standing of the counterparty, whereas the latter two are an indicator of the actual size of the exposure. Maximum exposure limits on the combination of the two will have to be defined in a counterparty risk management policy.
Another form of counterparty risk is settlement risk, or the risk that one party of the agreement does not deliver a security, or its value in cash, as per the agreement after the other party has already delivered the security or cash value. Whereas EAD and LGD are calculated on a net market value for derivatives, settlement risk entails risk to the entire face value of the exposure. Settlement risk can be mitigated, for example by the joining multicurrency cash settlement system Continuous Link Settlement (CLS), which settles gross transactions of both legs of trades simultaneously with immediate finality.
Counterparty Exposures
In order to be able to manage and mitigate counterparty risk effectively, treasurers require visibility over the counterparty risk. They must ensure that they measure and manage the full counterparty exposure, which means not only managing the risk on cash balances and bank deposits but also the effect of lending (the failure to lend), actual market values on outstanding derivatives and also indirect exposures.
Any counterparty risk mitigation via collateralisation of exposures, such as that negotiated in a CSA as part of the ISDA agreement and also legally enforceable netting arrangements, also has to be taken into account. Such arrangements will not change the EAD, but can reduce the LGD (note that collateralisation can reduce credit risk, but it can also give rise to an increased exposure to liquidity risk).
Also, clearing of derivative transactions through a clearing house – as is imposed for certain counterparties by the European Market Infrastructure Regulation (EMIR) – will alter counterparty risk exposure. Those cleared transactions are also typically margined. Most corporates will be exempted from central clearing because they will stay below the EMIR-defined thresholds.
It will be important to take a holistic view on counterparty risk exposures and assess the exposures on an aggregated basis across a company’s subsidiaries and treasury activities.
Assessing Probability of Default
A good starting point for monitoring the financial stability of a counterparty has traditionally been to assess the credit rating of the institutions as published by ratings agencies. Recent history has proved however that such ratings lag somewhat behind other indicators and that they do not move quickly enough in periods of significant market volatility. Since the credit rating is perceived to be somewhat more reactive they will have to be treated carefully. Market driven indicators, such as credit default swap (CDS)* spreads, are more sensitive to changes in the markets. Any changes in the perceived credit worthiness are instantly reflected in the CDS pricing. Tracking CDS spreads on FIs can give a good proxy of their credit standing.
How to use CDS spreads effectively and incorporate them into a counterparty risk management policy is, however, sometimes still unclear. Setting fixed limits on CDS values is not flexible enough when the market changes as a whole. Instead, a more dynamic approach that is based on the relative standing of an FI in the form of a ranking compared to its peers will add more value, or the trend in the CDS of a FI compared against that of its peers can give a good indication.
A combination of the credit rating and ‘normalised’ CDS spreads will give a proxy of the FI’s financial stability and the probability of default.
Counterparty Risk Management Policy
It is important to implement a clear policy to manage and monitor counterparty risk and it should, at the very least, address the following items:
- Eligible counterparties for treasury transactions, plus acceptance criteria for new counterparties – for example, to ensure consistent ISDA and credit support agreements are in place. This will also be linked to the credit commitment. Banks which provide credit support to the company will probably also demand ancillary business, so there should be a balanced relationship. While the pre-crisis trend was to rationalise the number of bank relationships, since 2008 it has moved to one of diversification. This is a trade-off between cost optimisation and risk mitigation that corporates should make.
- Eligible instruments and transactions (which can be credit standing dependent).
- Term and duration of transactions (which can be credit standing dependent).
- Variable maximum credit exposure limits based on credit standing.
- Exposure measurement – how is counterparty risk identified and quantified?
- Responsibility and accountability – at what level/who should have ultimate responsibility for managing the counterparty risk.
- Decision making to provide an overall framework for decision making by staff, including treatment of breaches etc.
- Key Performance Indicators (KPIs) – Selection of KPIs to measure and monitor performance.
- Reporting – Definition of reporting requirements and format.
- Continuous improvement – What procedures are required to keep the policy up to date?
Conclusion
To set up an effective counterparty risk management process, there are five steps to be taken as shown below; from identifying, quantifying, setting a policy to process and execute the set policy regarding counterparty risk.

Treasurers should avoid this becoming an administrative process; instead it should really be a risk management process. It will be important that counterparty risk can be monitored and reported on a continuous basis. Having real-time access to exposure and market data will be a prerequisite in order to be able to recalculate the exposures on a frequent basis. Market volatility can change exposure values rapidly.
* A credit default swap protects against default. In the event of a default the buyer will receive compensation. The spread (CDS spread) is the (insurance) premium paid for the swap.


