Blog
EBA’s Revised Definition of Default
On July 2nd, the European Banking Authority (EBA) published a Consultation Paper proposing amendments to its 2016 Guidelines on the application of the definition of default (DoD). As part of the
Find out more
On 2 December 2021, the European Banking Authority (EBA) published three consultation papers related to its ‘Guidelines on the management of interest rate risk arising from non-trading book activities’ (in short, the IRRBB Guidelines).
The current version of the IRRBB Guidelines, published in 2018, came into force on 30 June 2019. At that time, the IRRBB Guidelines were aligned with the Standards on interest rate risk in the banking book, published by the Basel Committee on Banking Supervision (in short, the BCBS Standards) in April 2016.
The new updates are triggered by the revised Capital Requirements Regulation (CRR2) and Capital Requirements Directive (CRD5). Both documents were adopted by the Council of the EU and the European Parliament in 2019 as part of the Risk Reduction Measures package. The CRR2 and CRD5 included numerous mandates for the EBA to come up with new or adjusted technical standards and guidelines. These are now covered in three separate consultation papers:
Please note that we recently also published an article about the new disclosure requirements for IRRBB which is closely related to this topic.
Banks have been subject to an SOT already since the 2006 IRRBB Guidelines. The SOT is an important tool for supervisors to perform peer reviews and to compare IRRBB exposures between banks. The SOT measures how the EVE responds to an instantaneous parallel (up and down) yield curve shift of 200 basis points. Changes in EVE that exceed 20% of the institution’s own funds will trigger supervisory discussions and may lead to additional capital requirements.
Some changes to the SOT were included in the 2018 update of the IRRBB Guidelines. Next to further guidance on its calculation, the existing SOT was complemented with an additional SOT. The additional SOT was based on the same metric and guidelines, but the scenarios applied were the six standard interest rate scenarios introduced in the BCBS Standards. Also, a threshold of 15% compared to Tier 1 capital was applied. In the 2018 IRRBB Guidelines, the additional SOT was considered an ‘early warning signal’ only.
The new update of the IRRBB Guidelines includes two important SOT-related changes, which are incorporated through amendments to Article 98 (5) of the CRD: the replacement of the 20% SOT for EVE and the introduction of the SOT for NII. Both changes are discussed in more detail below.
The first part of the amended Article 98 (5) concerns the replacement of the original 20% SOT by the 15% SOT. While many banks are probably already targeting levels below 15%, we expect that this change will limit the maneuvering capabilities of banks as they will likely choose to implement a management buffer. Note that not only the threshold is lower (15% instead of 20%), but also the denominator (Tier 1 capital instead of own funds). Furthermore, the worst outcome of all six supervisory scenarios should be used, as opposed to worst outcome of just the two parallel ones. Combined, this leads to a significant reduction in the EVE risk to which a bank may be exposed.
Some other noteworthy updates to the SOT for EVE that are not directly related to the CRD amendment are listed below:
The second part of the amended Article 98 (5) concerns the introduction of an entirely new SOT. It is aimed at measuring the potential decline in NII for two standard interest rate shock scenarios. Compared to the SOT for EVE, the SOT for NII requires many more modeling assumptions, in particular to determine the expected balance sheet development. The consultation paper provides clarity on the approach the EBA wants to take but two decisions are explicitly consulted.
The SOT for NII compares the NII for a baseline scenario with the NII in a shocked scenario over a one-year horizon. The two shocks that need to be applied are the two instantaneous parallel shocks that are also used in the SOT for EVE. Furthermore, the same requirements that are specified for the SOT for EVE apply, for example the use of the floor and the aggregation approach. The two exceptions are the requirements to use a constant balance sheet assumption (as opposed to a run-off balance sheet) and to include commercial margins and other spread components in the calculations. The commercial margins of new instruments should equal the prevailing levels (as opposed to historical ones).
The two decisions for which the EBA is seeking input are:
The scope/definition of NII
In its narrowest definition, the SOT will focus on the difference between interest income and interest expenses. The EBA, however, also considers using a broader definition where the effect of market value changes of instruments accounted for at Fair Value (∆FV) is added, and possibly also interest rate sensitive fees and commissions.
The definition of the SOT’s threshold
Article 98 (5) requires the EBA to specify what is considered a ‘large decline’ in NII, in which case the competent authorities are entitled to exercise their supervisory powers. This first requires a metric. The EBA is consulting two:


The pros of the narrow definition of NII are improved comparability and ease of computation, where the main pro of the broader definition is that it achieves a more comprehensive picture, which is also more in line with the EBA IRRBB Guidelines. With respect to the metrics, the first (capital-based) metric is the simplest and it is comparable to the approach taken for the SOT for EVE. The second metric is close to a P&L-based metric and the EBA argues that its main advantage is that “it takes into account both the business model and cost structure of a bank in the assessment of the continuity of the business operations”. It does involve, however, the application of some assumptions on determining the α parameter.
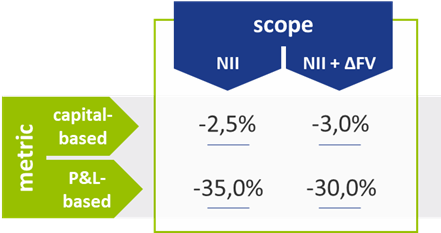
For each of the four possible combinations (definition of NII and specification of the metric), the EBA has determined, using data from the December 2020 Quantitative Impact Study (QIS), what the corresponding thresholds should be. Their starting point has been to make the SOT for NII as stringent as the SOT for EVE. Effectively, they reverse engineered the threshold to achieve a similar number of outliers under both measures. We expect that the proposed threshold for any of the four possible combinations will not be constraining for the majority of banks. The resulting proposed thresholds are included in the table below:

Table 1 – Comparison of the proposed thresholds for each combination of metric and scope
The impact of including Fair Value changes seems arbitrary as it increases the threshold for the capital-based metric and decreases the threshold for the P&L-based metric. Also, from a comparability and computational perspective, the narrow definition of NII may be preferred. Furthermore, the capital-based metric is less intuitive for NII than it is for EVE, and consequently, the P&L-based one may be preferred. It is also noted in the consultation paper that if the shocked NII after the correction for administrative expenses (the numerator) is negative, it will also be considered an outlier.
In the past years, many banks have invested heavily in their IRRBB framework following the 2018 update of the IRRBB Guidelines. Once again, an investment is required. Even though there are not many surprises in the proposed updates related to the SOTs, small and large banks alike will need to carefully assess how the changes to the existing SOT and the introduction of the new SOT will impact their interest rate risk management. Banks still have the opportunity to respond to all three consultation papers until 4 April 2022.
On July 2nd, the European Banking Authority (EBA) published a Consultation Paper proposing amendments to its 2016 Guidelines on the application of the definition of default (DoD). As part of the
Find out moreIn an industry where growth is often measured in multiples, and value creation is expected to be both scalable and repeatable, operational excellence is no longer a supporting function—it’s
Find out moreWith extreme weather events becoming more frequent and climate policy tightening across jurisdictions, banks are under increasing pressure to understand how climate change will impact their
Find out moreWith the introduction of CRR3, effective from January 1, 2025, the ‘extra’ guarantee on Dutch mortgages – known as the Dutch National Mortgage Guarantee (NHG) – will no longer be
Find out moreAccording to the IFRS 9 standards, financial institutions are required to model probability of default (PD) using a Point-in-Time (PiT) measurement approach — a reflection of present
Find out moreInflows from open reverse repos In May 2024 the EBA stated1 that inflows from open reverse repos cannot be recognised in LCR calculations unless the call option has already been
Find out moreThis article is intended for finance, risk, and compliance professionals with business and system integration knowledge of SAP, but also includes contextual guidance for broader audiences. 1.
Find out moreOur team at Zanders has been at the forefront of implementing BACS AUDDIS (Automated Direct Debit Instruction Service) with SAP S/4HANA, helping clients to streamline their direct debit
Find out moreThailand's e-Withholding Tax (e-WHT) system officially launched on October 27, 2020, in collaboration with 11 banks, marking a significant digital transformation with far-reaching benefits for
Find out moreIn today’s rapidly evolving financial landscape, fortifying the Financial Risk Management (FRM) function remains a top priority for CFOs. Zanders has identified a growing trend among
Find out moreEmergence of Artificial Intelligence and Machine Learning The rise of ChatGPT has brought generative artificial intelligence (GenAI) into the mainstream, accelerating adoption across
Find out moreIntroduction In December 2024, FINMA published a new circular on nature-related financial (NRF) risks. Our main take-aways: NRF risks not only comprise climate-related risks,
Find out moreAs mid-sized corporations expand, enhancing their Treasury function becomes essential. International growth, exposure to multiple currencies, evolving regulatory requirements, and increased
Find out moreIndustry surveys show that FRTB may lead to a 60% increase in regulatory market risk capital requirements, placing significant pressure on banks. As regulatory market risk capital requirements
Find out moreFirst, these regions were analyzed independently such that common trends and differences could be noted within. These results were aggregated for each region such that these regions could be
Find out moreThe EU instant payments regulation1 comes into force on the 5th October this year. Importantly from a corporate perspective, it includes a VoP (verification of payee) regulation that requires
Find out moreHuman activities such as deforestation, pollution, and resource over-extraction have caused a dramatic decline in biodiversity, with approximately 1 million species at risk of extinction,
Find out moreThe evolution of the payments industry over the past 20 years has been significant, both in terms of the number of available settlement methods and how transactions can now be made. At a
Find out moreIn the ongoing efforts to enhance tax transparency for multinational corporations, tax authorities have progressively increased scrutiny on intercompany financial transactions. While the
Find out moreWith recent volatility in financial markets, firms need increasingly faster pre-trade and risk calculations to react swiftly to changing markets. Traditional computing methods for these
Find out more
In a continued effort to ensure we offer our customers the very best in knowledge and skills, Zanders has acquired Fintegral.

In a continued effort to ensure we offer our customers the very best in knowledge and skills, Zanders has acquired RiskQuest.

In a continued effort to ensure we offer our customers the very best in knowledge and skills, Zanders has acquired Optimum Prime.
You need to load content from reCAPTCHA to submit the form. Please note that doing so will share data with third-party providers.
More Information