IFRS 9 Study 2026: Steady Coverage, Diverging Signals




European banks faced more geopolitical uncertainty in 2026 than in years prior, yet their expected credit loss coverage kept declining, our fourth annual IFRS 9 study explains why.
This article analyzes different regions in Europe, namely DACH1, the Nordics2, the UK3 and the Netherlands4. It continues the annual review of how banks apply IFRS 9, building on our studies of 2023, 2024 and 2025. As in the previous studies, the expected credit loss (ECL) coverage ratios are considered, where the focus primarily lies on the Netherlands, compared with the other regions. The sample covers the largest banks that report IFRS 9 metrics in each region; this year's Dutch sample additionally includes Argenta. This year's study shows that ECL coverage ratios did not rise; if anything, they continued their slowly decreasing trend, while one could speak of considerable geopolitical turbulence. This raises the question of whether the apparent stability in coverage ratios tells the full story. If geopolitical uncertainty increased during the year, one would expect this to be reflected somewhere within the IFRS 9 framework. This article therefore examines whether signs of increased caution can still be found in macroeconomic assumptions, scenario weightings, and management overlays.
This article outlines observed practices in the annual reports; it does not assess whether current provision levels are adequate. IFRS 9 provides a common framework for expected credit losses but leaves banks with considerable room in how they apply it to their own portfolios. This year's results illustrate that variation clearly.
Coverage ratios: a soft continuation of the downward trend
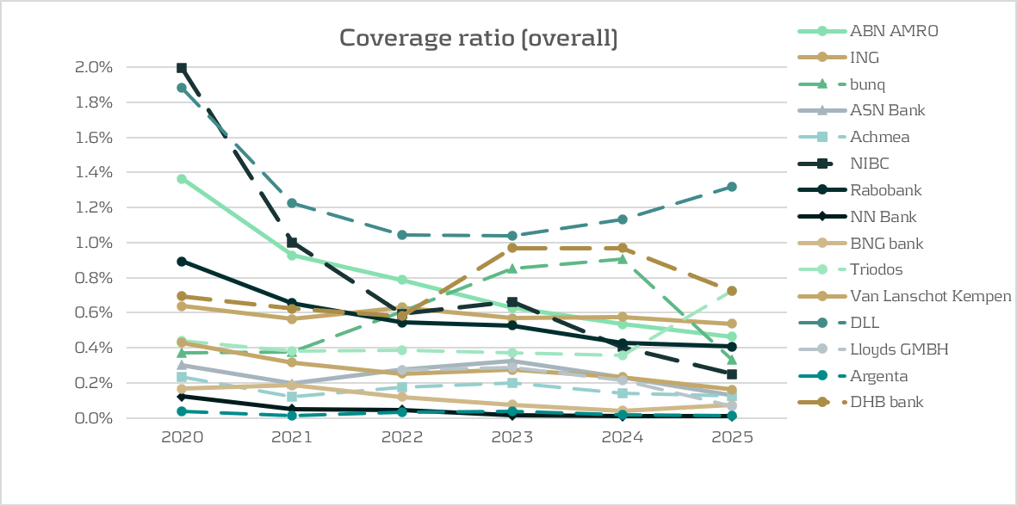
The mean coverage ratio across all four regions declined slightly in 2025. In the Netherlands, this year's decrease was smaller than in the previous year, whereas in the other regions the decline was broadly similar or somewhat larger. The clearest driver of the decrease is the continued strength of Dutch house prices which lowers the modeled loss given default (LGD) on mortgages. The macroeconomic outlook plays a role too, but as the next section shows, its direction is now mixed across banks. Unlike the previous year, management overlays were not widely reduced in 2025.
| Region | Mean coverage ratio 2023 | Mean coverage ratio 2024 | Mean coverage ratio 2025 |
|---|---|---|---|
| Netherlands | 0.647% | 0.532% | 0.497% |
| UK | 2.119% | 2.011% | 1.858% |
| DACH | 0.829% | 0.822% | 0.794% |
| Nordics | 0.434% | 0.543% | 0.436% |
Table 1: Mean ECL coverage ratio (total allowance / gross carrying amount) across banks per region.
A lower coverage ratio reflects a smaller allowance relative to the size of the loan book, that is, a lower expected loss per unit of exposure. This contrasts with the wider environment: the past year was marked by old and new conflicts in the Middle East, the continuing war in Ukraine and a wave of trade tensions, yet this was not reflected in higher aggregate coverage ratios. Where the geopolitical turbulence did come through was in some individual banks' overlays, discussed below, rather than in figures across the whole sector.
Macroeconomic scenarios: mixed outlooks, stable weights
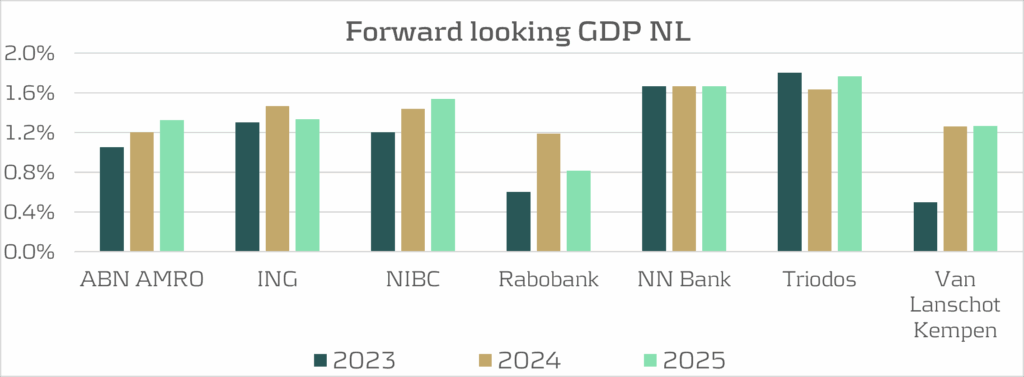
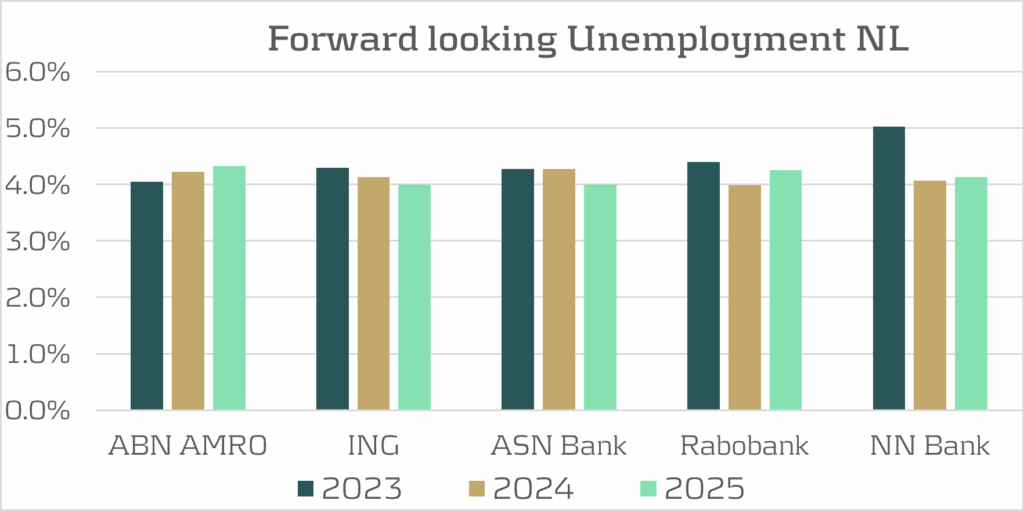
Last year, the Annual IFRS 9 Study saw an improvement of the macroeconomic projections for most banks. The results of the macroeconomic variables that are used the most in the Netherlands are shown in this article. This year, the picture is mixed among the banks that disclose comparable forward-looking macroeconomic assumptions, as GDP rose at ABN AMRO, NIBC and Triodos, held flat at Van Lanschot Kempen and was lowered at ING and Rabobank. Projected unemployment indicates divergence as well: lower at ING and ASN, but higher at ABN AMRO, Rabobank and NN Bank. This year the divergence is therefore more pronounced as projections no longer move in broadly the same direction across banks. Rabobank is the clearest example, combining a lower growth assumption with a higher projected unemployment rate. Taken together, the picture is largely one of stability rather than a clear directional shift. The reported macroeconomic assumptions no longer move broadly in the same direction across banks, resulting in greater divergence than observed in previous years.
The expected credit loss (ECL) is a probability-weighted estimate across several macroeconomic scenarios, typically an upside, a base case and a downside.. One way in which banks reflect forward-looking uncertainty in this framework is through the weighting assigned to these scenarios. The table below shows that the net downside tilt (weight on the downside scenario minus the weight on the upside), measured based on the same banks for both years, changed only modestly between 2024 and 2025. The Netherlands and DACH became slightly less downside-oriented, while the UK and the Nordics saw small increases. These movements were driven by only a small number of banks, as most institutions left their scenario weights unchanged. Banks generally do not disclose the reasoning behind year-on-year changes in scenario weightings. Overall, the movements were limited, suggesting that banks largely kept their scenario weightings unchanged despite the uncertain geopolitical environment.
| Region | Downside tilt 2024 | Downside tilt 2025 | Change (in percentage points) |
|---|---|---|---|
| Netherlands | 13.33% | 12.08% | -1.25pp |
| UK | 17.33% | 17.53% | +0.20 pp |
| DACH | 23.33% | 20.83% | -2.50 pp |
| Nordics | 1.88% | 3.13% | +1.25 pp |
Table 2: Net downside tilt across banks reporting in both years, per region.
Management overlays: selective caution outside the model
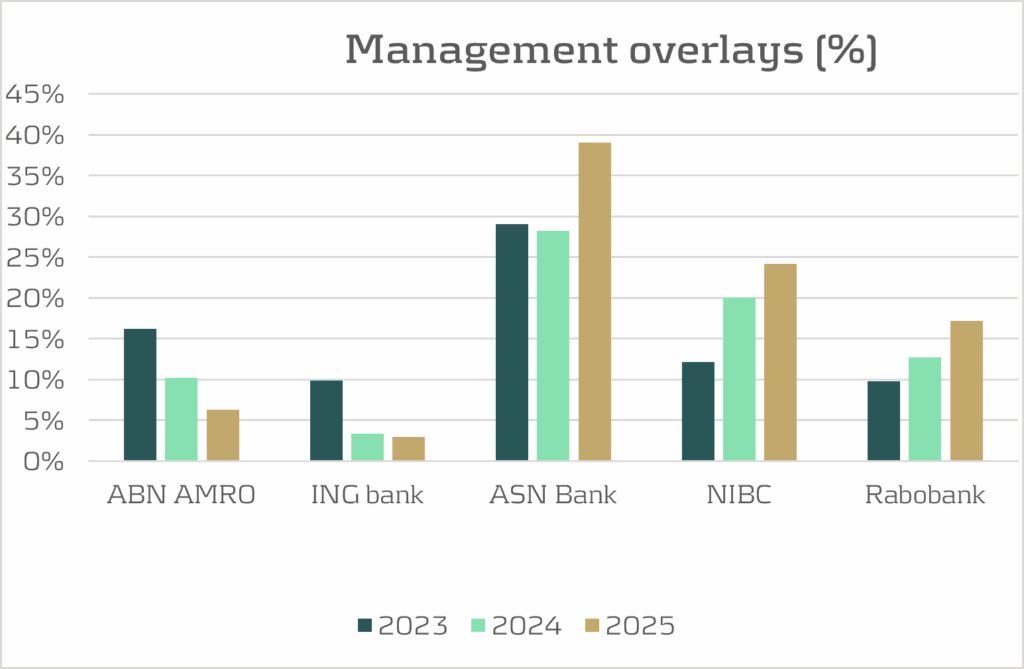
While scenario weights remained broadly stable in 2025, management overlays tell a more mixed story. Coverage ratios continued to decline, but among Dutch banks that carry an overlay, the movement was not one-directional: ABN AMRO and ING reduced their overlays further while Rabobank, ASN Bank and NIBC increased theirs. Two of them disclose this out explicitly as a geopolitical buffer. Rabobank reports a management adjustment for geopolitical risk of EUR 128 million at the end of 2025, up from EUR 76 million a year earlier, while ASN holds EUR 5 million for geopolitical risks not captured in its models, out of a total management overlay of EUR 34 million. ABN AMRO, ING and NIBC instead capture such risks through their downside scenarios rather than through a separately labeled adjustment. NIBC's own overlay for instance is allocated to the Dutch housing market, climate and interest-only mortgages, not geopolitics.
Conclusion
The main observation of this year's study is that the uncertainty concerning macroeconomic tensions around the world only surfaced selectively. Coverage ratios continued their decline at a slower rate, supported in part by lower expected mortgage losses as Dutch house prices increased. At the same time, scenario weights showed little evidence of greater caution, while management overlays moved in different directions across banks. Some institutions, most notably Rabobank and ASN Bank, explicitly reported geopolitical risk within their management overlays, whereas others emphasized different risk drivers or reduced overlays altogether. The result is a picture in which caution remained present but was expressed unevenly and did not translate into higher aggregate coverage ratios.
What can Zanders offer?
The 2025 results show that approaches and outcomes still differ markedly between banks and regions. These differences stem from how models are applied, such as portfolio composition, SICR frameworks, the design and weighting of macroeconomic scenarios, and overlay practice, rather than from the standard itself. For any bank, it is worthwhile to assess whether its current IFRS 9 framework remains aligned with its expectations of future credit losses.
With a focus on the Dutch market and an active presence in the UK, DACH and Nordic regions, Zanders is in regular contact with many of the banks in this study, which positions us well to help benchmark results and support the validation or (re)development of IFRS 9 models.
-
Benefits of AI in Preventing Financial Crime: Model Validation with GenAI

-
Kongsberg Automotive’s road map to a transformed treasury

-
Revealing New Insights Through Machine Learning: An Application in Prepayment Modeling

-
Citi & Zanders - Getting Started with GenAI in Treasury: Practitioners Guide

-
Autonomy Unlocked - A Blueprint for Agentic AI in Financial Services

-
The Case for AI-Enhanced Testing in Treasury

-
Expanding the Utility of AI in Risk Management with AI Agents


Ready to benchmark your IFRS 9 framework against these findings?
Talk to our IFRS 9 expertsFootnotes
- The DACH banks used for this analysis are Deutsche Bank, Commerzbank, DekaBank, KfW, DZ Bank, Helaba, LBBW, NordLB, Hamburg Commercial Bank (HCOB), UBS, Julius Bär, Erste Group and Raiffeisen Bank International (RBI). ↩︎
- The Nordic banks used for this analysis are Swedbank, SEB, Handelsbanken, Länsförsäkringar Bank, SBAB, Danske Bank, Jyske Bank, Nykredit, Saxo Bank, Nordea, OP Financial Group, DNB and SpareBank 1. ↩︎
- The UK banks used for this analysis are HSBC, Barclays, Santander UK, NatWest, Lloyds Banking Group, Standard Chartered, Monzo, Nationwide, TSB and Metro Bank. ↩︎
- The Dutch banks used for this analysis are ABN AMRO, ING, bunq, DHB Bank, ASN Bank, Achmea, NIBC, FMO, Rabobank, NN Bank, BNG Bank, Triodos Bank, Van Lanschot Kempen, DLL, Lloyds Bank GmbH and Argenta. Note that Mizuho and Yapi Kredi are not included in this year's study since they did not publish the 2025 annual report yet. ↩︎