Annual IFRS 9 Study 2025: Key Developments in the Dutch Banking Sector

Zanders has conducted the annual report study for IFRS 9 results across the Dutch banking sector.
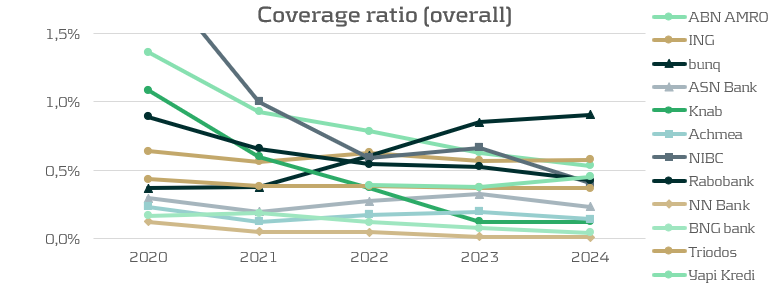
This article first analyzes trends in coverage ratios among 13 Dutch banks1, and puts the results of the largest Dutch banks in international context. Furthermore, this article builds on previous annual studies (2023 and 2024). For this purpose, coverage ratios and stage exposures from the four largest Dutch banks are compared with the five largest UK2 and DACH3 banks as benchmarks. Next, macroeconomic outlooks from a group of Dutch banks are discussed. Finally, the application of management overlays by all Dutch banks is discussed as well.
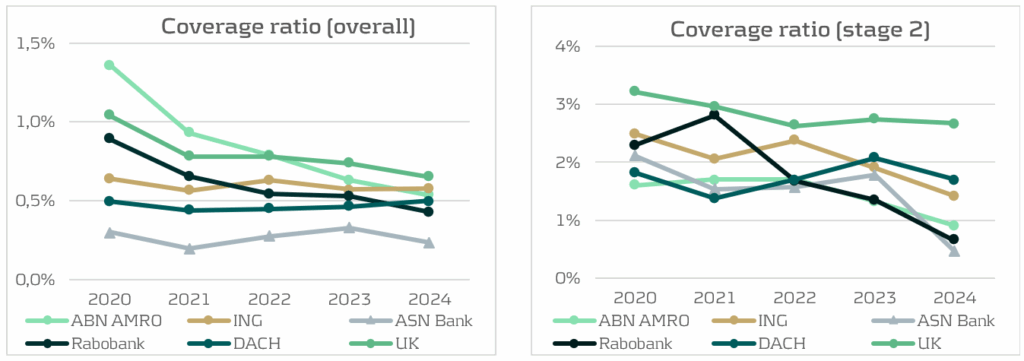
In general, the results show continuation of a decreasing trend in the coverage ratio for Dutch banks, which is a persistent trend since 2020. From a bank’s perspective, this is a positive development: lower coverage ratios are driven by improved macroeconomic conditions, reduced manual overlays and healthier portfolios, and therefore leading to lower Expected Credit Losses (ECL). Especially Stage 2 coverage ratios are lower in 2024, as changes in macroeconomic outlooks have a stronger effect on these loans because ECL for Stage 2 are determined over the lifetime of the loans. The transfer of loans from Stage 1 to Stage 2 also happened persistently over the last couple of years. This could be seen together with the EBA monitoring report (IFRS 9 implementation by EU institutions) which called for a more conservative and broader definition of Stage 2. The increase in Stage 2 ratios is a counterintuitive finding when paired with the decrease in coverage ratios. As Stage 2 reflects a Significant Increase in Credit Risk (SICR), credit loss provisions are expected to be higher. However, it follows that the effects driving the coverage ratios down outweigh the increase in Stage 2 exposure.
Coverage Ratios: a Decreasing Trend
The Dutch banks are expecting lower credit losses compared to previous years, resulting in lower coverage ratios. There are three main drivers for this. Firstly, several banks (e.g. ASN Bank) mention a significantly more positive macroeconomic outlook. The second driver is not forward-looking but is a realization of higher-than-expected increases in house prices in 2024. As mentioned by ABN Amro and Rabobank, the Dutch house price index (HPI) was expected to rise around 2% in 2024, while this turned out to be 9%. Higher house prices improve collateral values and therefore lower the future Loss Given Default (LGD) in case of a mortgage default in the IFRS 9 models. The third driver behind lower ECL is that many banks decreased the management overlays to the model outcomes in 2024 compared to 2023. Combining these three drivers pushes coverage ratios down.
In international context, the largest Dutch banks are well positioned compared to banks in the UK and DACH regions. The coverage ratio of UK banks is relatively high but is decreasing due to improvements in economic outlooks and a decrease in inflation. The coverage ratios of DACH banks are comparable to those of the Dutch banks. However, the coverage ratio of the DACH banks did increase slightly compared to 2023, driven by a weak German economy and the increased geopolitical risk of US trading wars. Although the expectation of a trading war has worldwide implications, there are several reasons why the German economy would suffer more from this than the Dutch or English economies. Firstly, Germany is the most reliant on export out of these three countries, with over 50% of its GDP allocated to exports. Secondly, German banks lend heavily to autos, machinery, and chemicals, exactly the industries most exposed to US tarrifs. In contrast, Dutch banks rely more on agriculture, mortgages and domestic real estate. UK banks are more globally diversified, giving them a smaller exposure to US trade wars. For these reasons, the effect of potential US trade wars is weighed more heavily into the macroeconomic IFRS 9 scenarios for German banks.
Stage Ratios: Counterintuitive Movements
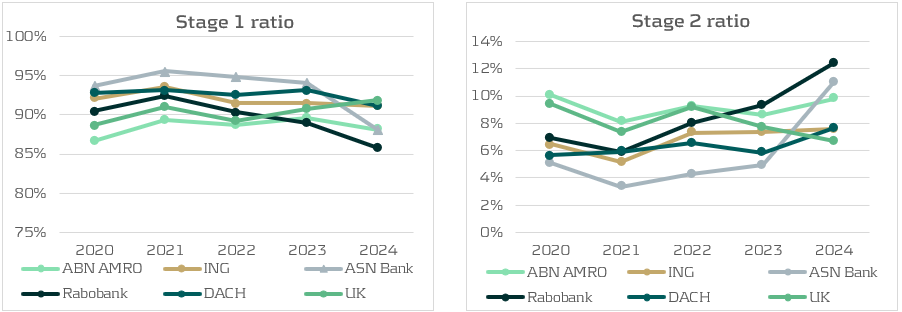
Another development in 2024 is the increase in Stage 2 exposures at Dutch banks. Rabobank, ASN Bank, and ABN Amro all reported more Stage 2 loans, largely the result of framework updates and stricter Significant Increase in Credit Risk (SICR) definitions. At Rabobank, an ECB regulation and Risk Based Strategy approach was implemented in the Stage 2 framework for residential mortgages, raising the allowances for ECL. The increase is predominantly related to mortgage clients who have not voluntarily provided updated financial income information. Hence, the increase in Stage 2 ratio is not caused by an increase in the risk of default but because the framework required a risk-based treatment of missing data. Combined with a decrease in Stage 1 exposures, it is concluded that these loans transferred from Stage 1 to Stage 2. ASN Bank also confirms this trend by a large transfer of interest-only mortgages from Stage 1 to Stage 2.
Even though more loans are classified as having a SICR, there is no negative impact on coverage ratios. The overall coverage ratios decrease and the Stage 2 coverage ratios decrease sharply. When macroeconomic outlooks improve, this has a significantly larger impact on Stage 2 coverage ratios than on Stage 1 coverages due to the lifetime ECL estimation of Stage 2 loans. The more conservative design of the Stage 2 framework has been noted by the ECB, who reported an increase in the share of Stage 2 loans without a significant increase in default rates (Same but different: credit risk provisioning under IFRS 9). This trend is empowered by the EBA, who encouraged banks in their previously mentioned report to be more conservative and shift more assets to Stage 2.
Outside of the Netherlands, the trend of increasing Stage 2 exposures at the expense of Stage 1 is also visible in the DACH region, where for the five largest banks the Stage 2 ratio increased from 6% to 8%. This increase is also paired with a decrease in the Stage 2 coverage ratio. Conversely, the UK banks do not show this trend and even report decreasing Stage 2 ratios paired with increasing Stage 1 ratios. As the UK banks do not fall under ECB supervision or EBA authority, they are not subject to the same trends observed for EU banks.
Improved macroeconomic outlooks
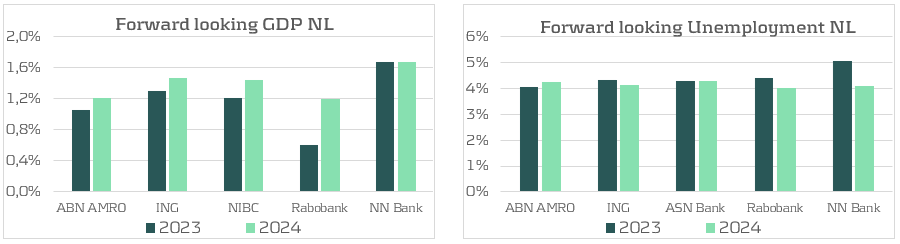
For the analysis of macroeconomic outlooks, the focus is on the Dutch banks as these outlooks are often for the national economy and thus not comparable between countries. In practice, most Dutch banks define three scenarios (base, up, down) and the average allocation is 50% to the base scenario, with the remaining 50% skewed to the downside (32%) rather than the upside (18%). Although the probabilities have not been skewed positively, the outlook of all scenarios has improved compared to 2023. The five Dutch banks reporting their forward looking GDP figures all show improvements, with only NN Bank holding the prediction from last year. At the same time, the predicted unemployment has decreased for most banks reporting this figure. Both of these signal the improved macroeconomic conditions that lead to lower ECL.
Reduction in Management Overlays
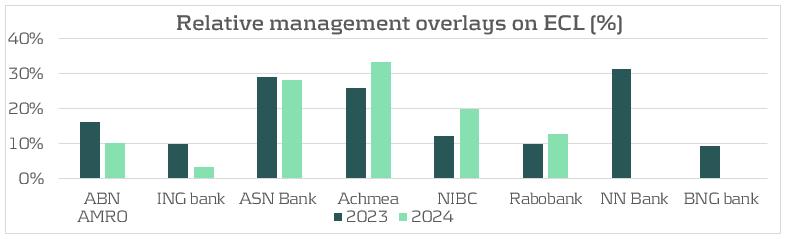
The second driver behind the lower coverage ratios is the decrease in management overlays, which most banks reduced in 2024 compared to 2023. Overlays remain an important tool to capture risks not covered by the models, as also highlighted by the ECB in 2024 (IFRS 9 overlays and model improvements for novel risks). While the ECB welcomes the use of overlays to capture novel risks, it also warns for misuse. Specifically, the ECB would like to see overlays applied at the parameter level, and not at the total ECL level, as most Dutch banks do. According to the report there is still room for a lot of improvements in the use of overlays in IFRS 9 modeling. Amongst the Dutch banks, the average overlay decreased from 11% in 2023 to 8% in 2024. ABN Amro discontinued the overlay for geopolitical risk and decreased the overlay for nitrogen reducing measures on livestock farming business. ING decided to fully abandon the management overlays in place for the Covid-19 support program, which had been in place for several years. Other overlays like those for climate transition risk, mortgage portfolio adjustments and inflation and interest rate increases were reduced but are still in place. Some other banks, like BNG and NN Bank completely discontinued all management overlays. For NN Bank, the previous overlay was in place related to rising interest rates and high inflation. As for BNG, the overlay was meant to account for an increased risk for the healthcare sector. After a thorough evaluation of the sector, BNG has concluded that the models now correctly reflect the risks in the healthcare sector and the overlay is no longer required.
Most management overlays are applied to cover macroeconomic risks, such as interest rate risk, inflation risk and geopolitical risk. After the EBA concluded in the previously mentioned report that climate and environmental risks were covered insufficiently, some banks have also started applying more overlays regarding this area. Other banks, like BNG, have started improving the modeling to account for climate-related matters in ECL calculations. These model improvements have not been completed yet. Additionally, some banks do recognize and investigate climate and environmental (C&E) risks but do not quantify these risks in their IFRS 9 frameworks, such as NN Bank.
What can Zanders offer?
The results from the annual report study of 2024 show that approaches and results between banks for the IFRS 9 framework still differ greatly and there remain many modeling improvements to be made. These differences do not stem from the model itself, but rather from how models are applied. Key drivers include the composition of loan portfolios, the SICR frameworks, and the design and weighing of macroeconomic scenarios. It is worthwhile to investigate how Dutch banks can learn from each other in modeling ECL. For any bank, it is useful to assess their current IFRS 9 framework and critically evaluate whether it is line with the actual expectations on future credit losses.
As Zanders has a focus on the Dutch market but also has a presence in the UK and DACH regions, we are in constant contact with many of the active banks in these regions. This makes us the best strategic partner to help you with improving your IFRS 9 modeling.
If you need help with your IFRS 9 models or want to learn more about these IFRS 9 results to see how your results fit in, please contact Kasper Wijshoff.
-
Margin of Conservatism Explained: Reducing Capital Inflation in IRB Models

-
Cash Is King Again: Why real-time liquidity is the new strategic advantage

-
Risk Mitigation Accounting (RMA) Exposure Draft amending IFRS9: Key Impacts and Practical Challenges

-
Optimizing the Valuation Processes in Modern Banking: A Strategic Approach to Efficiency, Consistency, and Cost Reduction

-
A Roadmap for Banks to Geopolitical Risk Taxonomy

-
Geopolitical Risk and the ECB 2026 Reverse Stress Test: Mapping Failure Pathways Before It’s Too Late

-
ECB’s 2026 Geopolitical Reverse Stress Test: Why Channels Matter More Than Numbers

-
New challenges for banks’ ESG strategy and risk management

-
IFRS 9 Amendments: Settlement-Date Accounting and the End of Distorted Liquidity Positions

-
SupTech in AML: When Supervisors Shift, Banks Must Move

Citations
- The Dutch banks used for this analysis are ABN Amro, ING, ASN Bank, Rabobank, Bunq, Knab, Achmea Bank, NIBC, NN Bank, BNG Bank, Triodos, and Yapi Kredi. . ↩︎
- The UK banks used for this analysis are HSBC, Barclays, Natwest, Lloyds, and Standard Chartered. ↩︎
- The DACH banks used for this analysis are Deutsche Bank, Commerzbank, KfW, DZ Bank, and UBS. ↩︎


