

The 2025 Swiss Climate Scenarios provide updated estimates of consequences for Switzerland of various global warming scenarios. They cover the likelihood and severity of extreme heat, heavy precipitation, droughts, forest fires, flash floods and thawing permafrost. We summarize the main estimates, highlight the potential economic consequences and discuss ways in which financial institutions can make use of the updated scenarios.
On November 4, MeteoSwiss published updated climate scenarios for Switzerland. The scenarios describe the expected changes in the climate in Switzerland under an increase in global warming by 1.5, 2 and 3 degrees respectively (Global Warming Level (GWL)) compared to the reference period 1991-2020. The timing if and when these GWLs are reached depends on the specific climate scenario considered.
The climate scenarios for Switzerland are anchored in the global climate scenarios that have been included in the sixth and last assessment report of the Intergovernmental Panel on Climate Change (IPCC) from 2022. The three main global scenarios considered are a combination of a Shared Socio-Economic Pathway (SSP) and a Representative Concentration Pathway (RCP):
- “SSP1-2.6” represents a combination of SSP1 and RCP2.6 ("2-degree path with net-zero target achieved by 2050")
- “SSP2-4.5” represents a combination of SSP2 and RCP4.5 (“’Middle ground’ scenario following current and planned measures“)
- “SSP5-8.5” represents a combination of SSP5 and RCP8.5 (“Fossil fuel path without climate protection“)
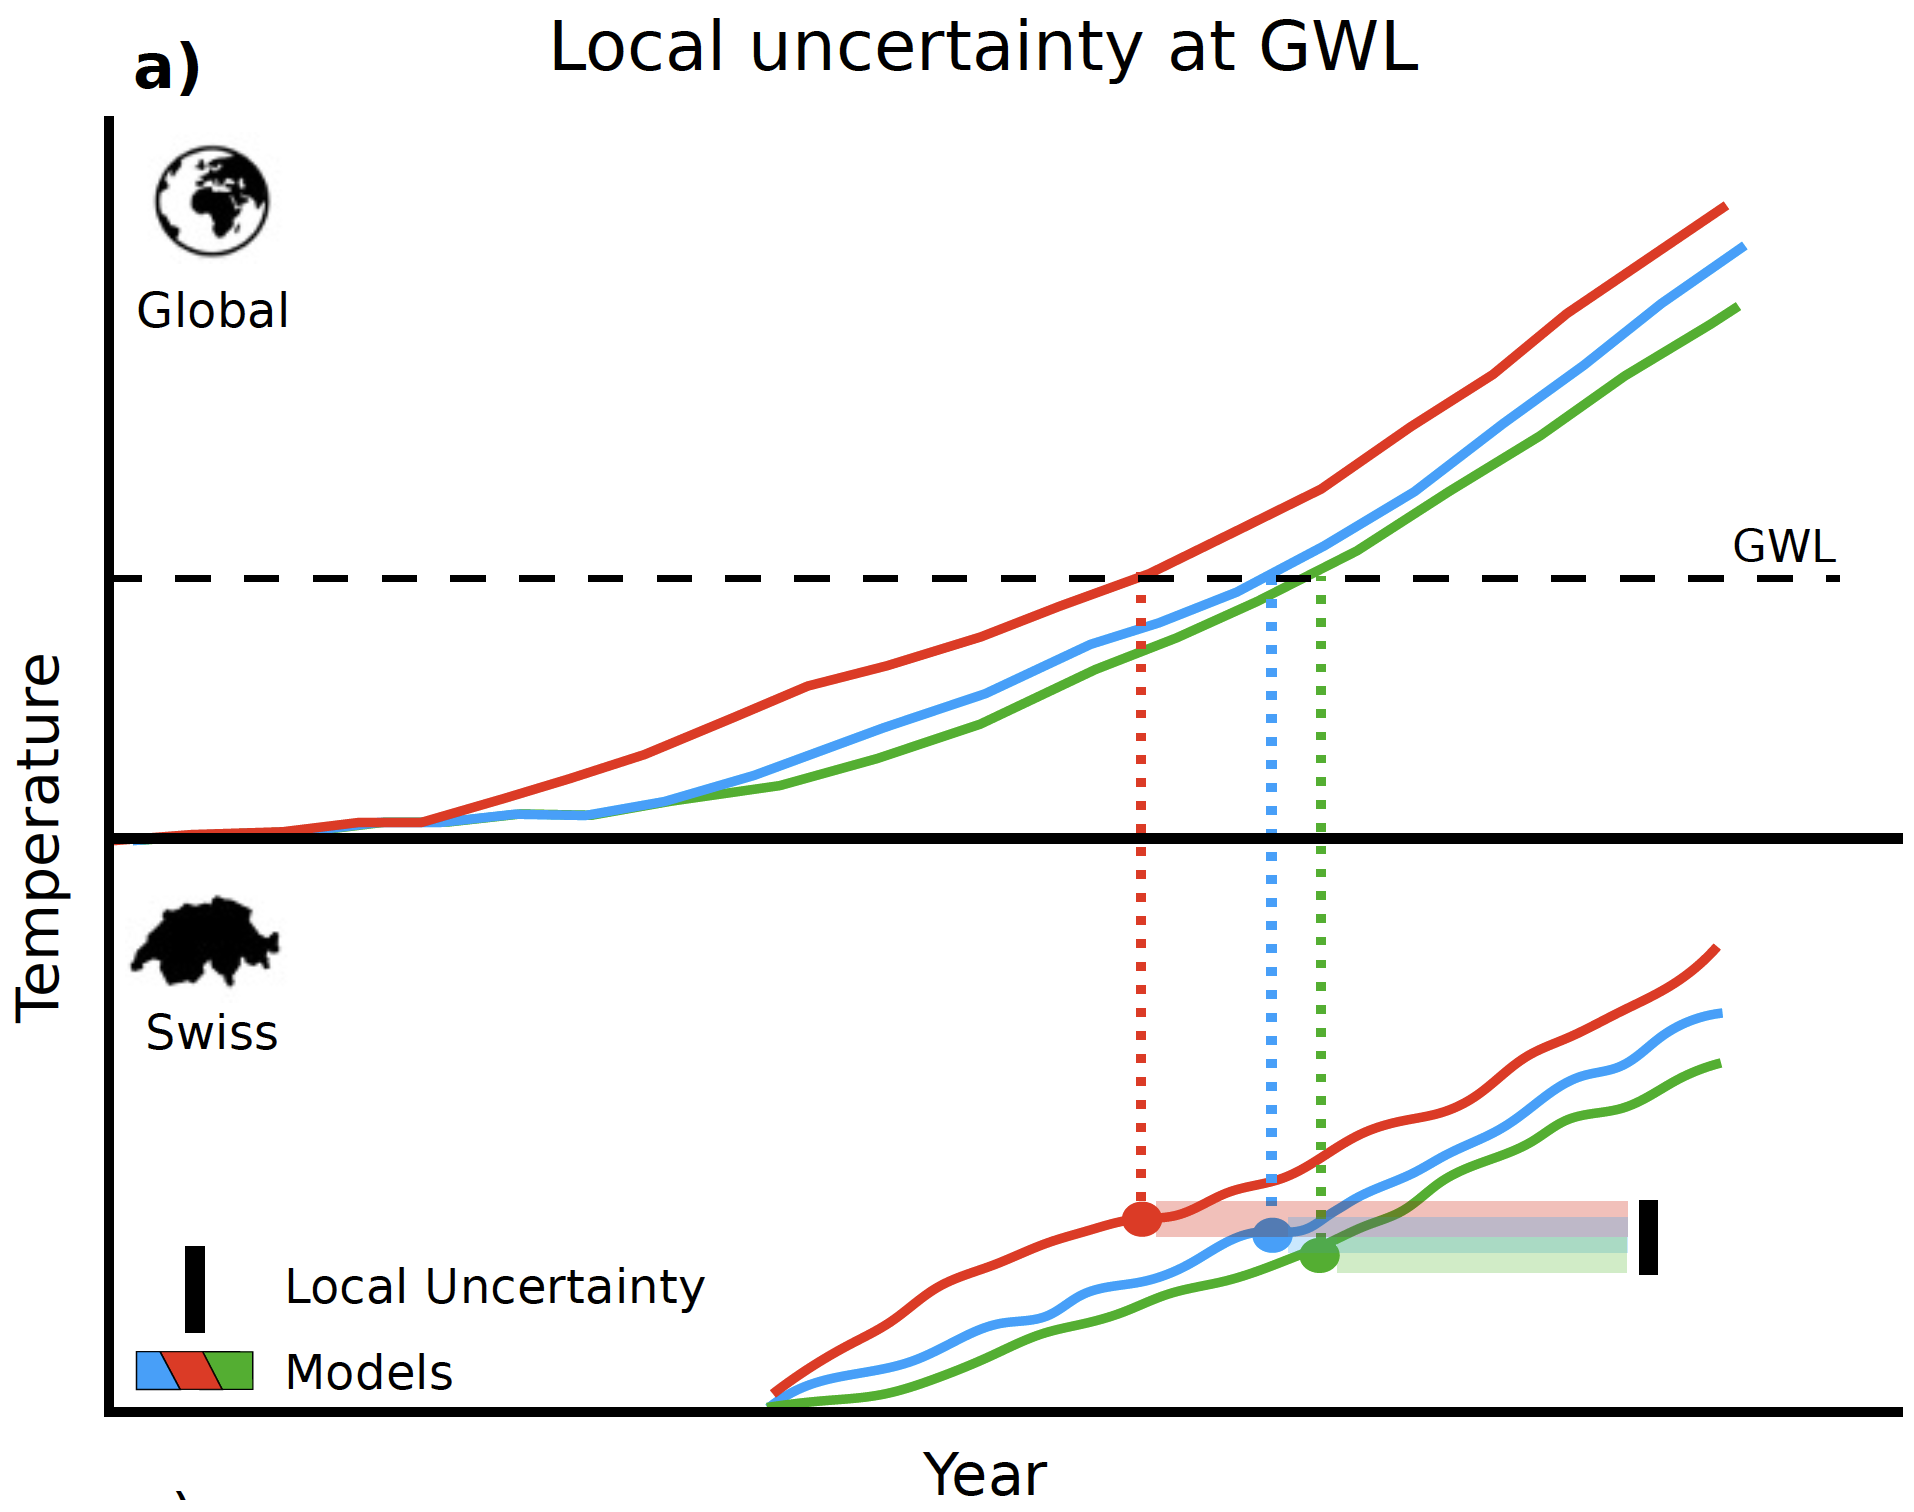
The Figure above depicts the approach taken by MeteoSwiss to assess the consequences for Switzerland at specific GWLs:
- The top part of the Figure (“Global”) shows three global climate scenarios, each of which achieves the depicted GWL at a different point in time.
- MeteoSwiss has translated each of the global scenarios to specific scenarios for Switzerland (more than three in fact, but the picture only shows three). These scenarios are shown in the bottom part of the Figure (“Swiss”). It can be seen that the same GWL in the global scenarios corresponds to different warming levels for Switzerland. This leads to a range of possible warming levels in Switzerland for each GWL.
In the next sections, the main expected changes in temperature and precipitation in Switzerland under the different GWLs are considered. Subsequently, the steps needed to use the information about the climate scenarios for a materiality assessment of climate risk are outlined. In addition, an overview is provided of the data that has been made available for the Swiss climate scenarios by MeteoSwiss, which can be used for such a materiality assessment.
1. Changes in temperature

MeteoSwiss estimates that by 2024, the average temperature in Switzerland already increased by 2.9°C compared to pre-industrial times (1871-1900). This is more than double the rise of 1.4°C in average global temperature. The larger rise in Switzerland is partially due to the fact that the temperature above land increases more quickly than above sea.
With rising global warming, the number of hot days (>30°C) in Switzerland is expected to roughly triple in a 3-degree world (GWL3.0). The largest impact will be in urban areas, as depicted in the Figure on the right.
In line with this, the average summer temperature as well as extreme temperatures (warmest day and night) will increase.
Potential economic consequences:
- Extreme heat during the day and a lack of cooling at night put strain on the body and affect health. In addition, physical and mental work is made more difficult during heatwaves, with dense urban development exacerbating this. This will affect productivity, lower economic output and may increase costs for cooling work environments.
2. Changes in precipitation
Yearly precipitation is not expected to change in Switzerland with global warming, but summers are expected to get drier and winters are expected to get wetter. Moreover, extreme precipitation (heavy rainfall, hail) is expected to increase in both frequency and intensity, as depicted in the Figure below.

Source: Climate CH2025 – Brochure, MeteoSwiss (link)
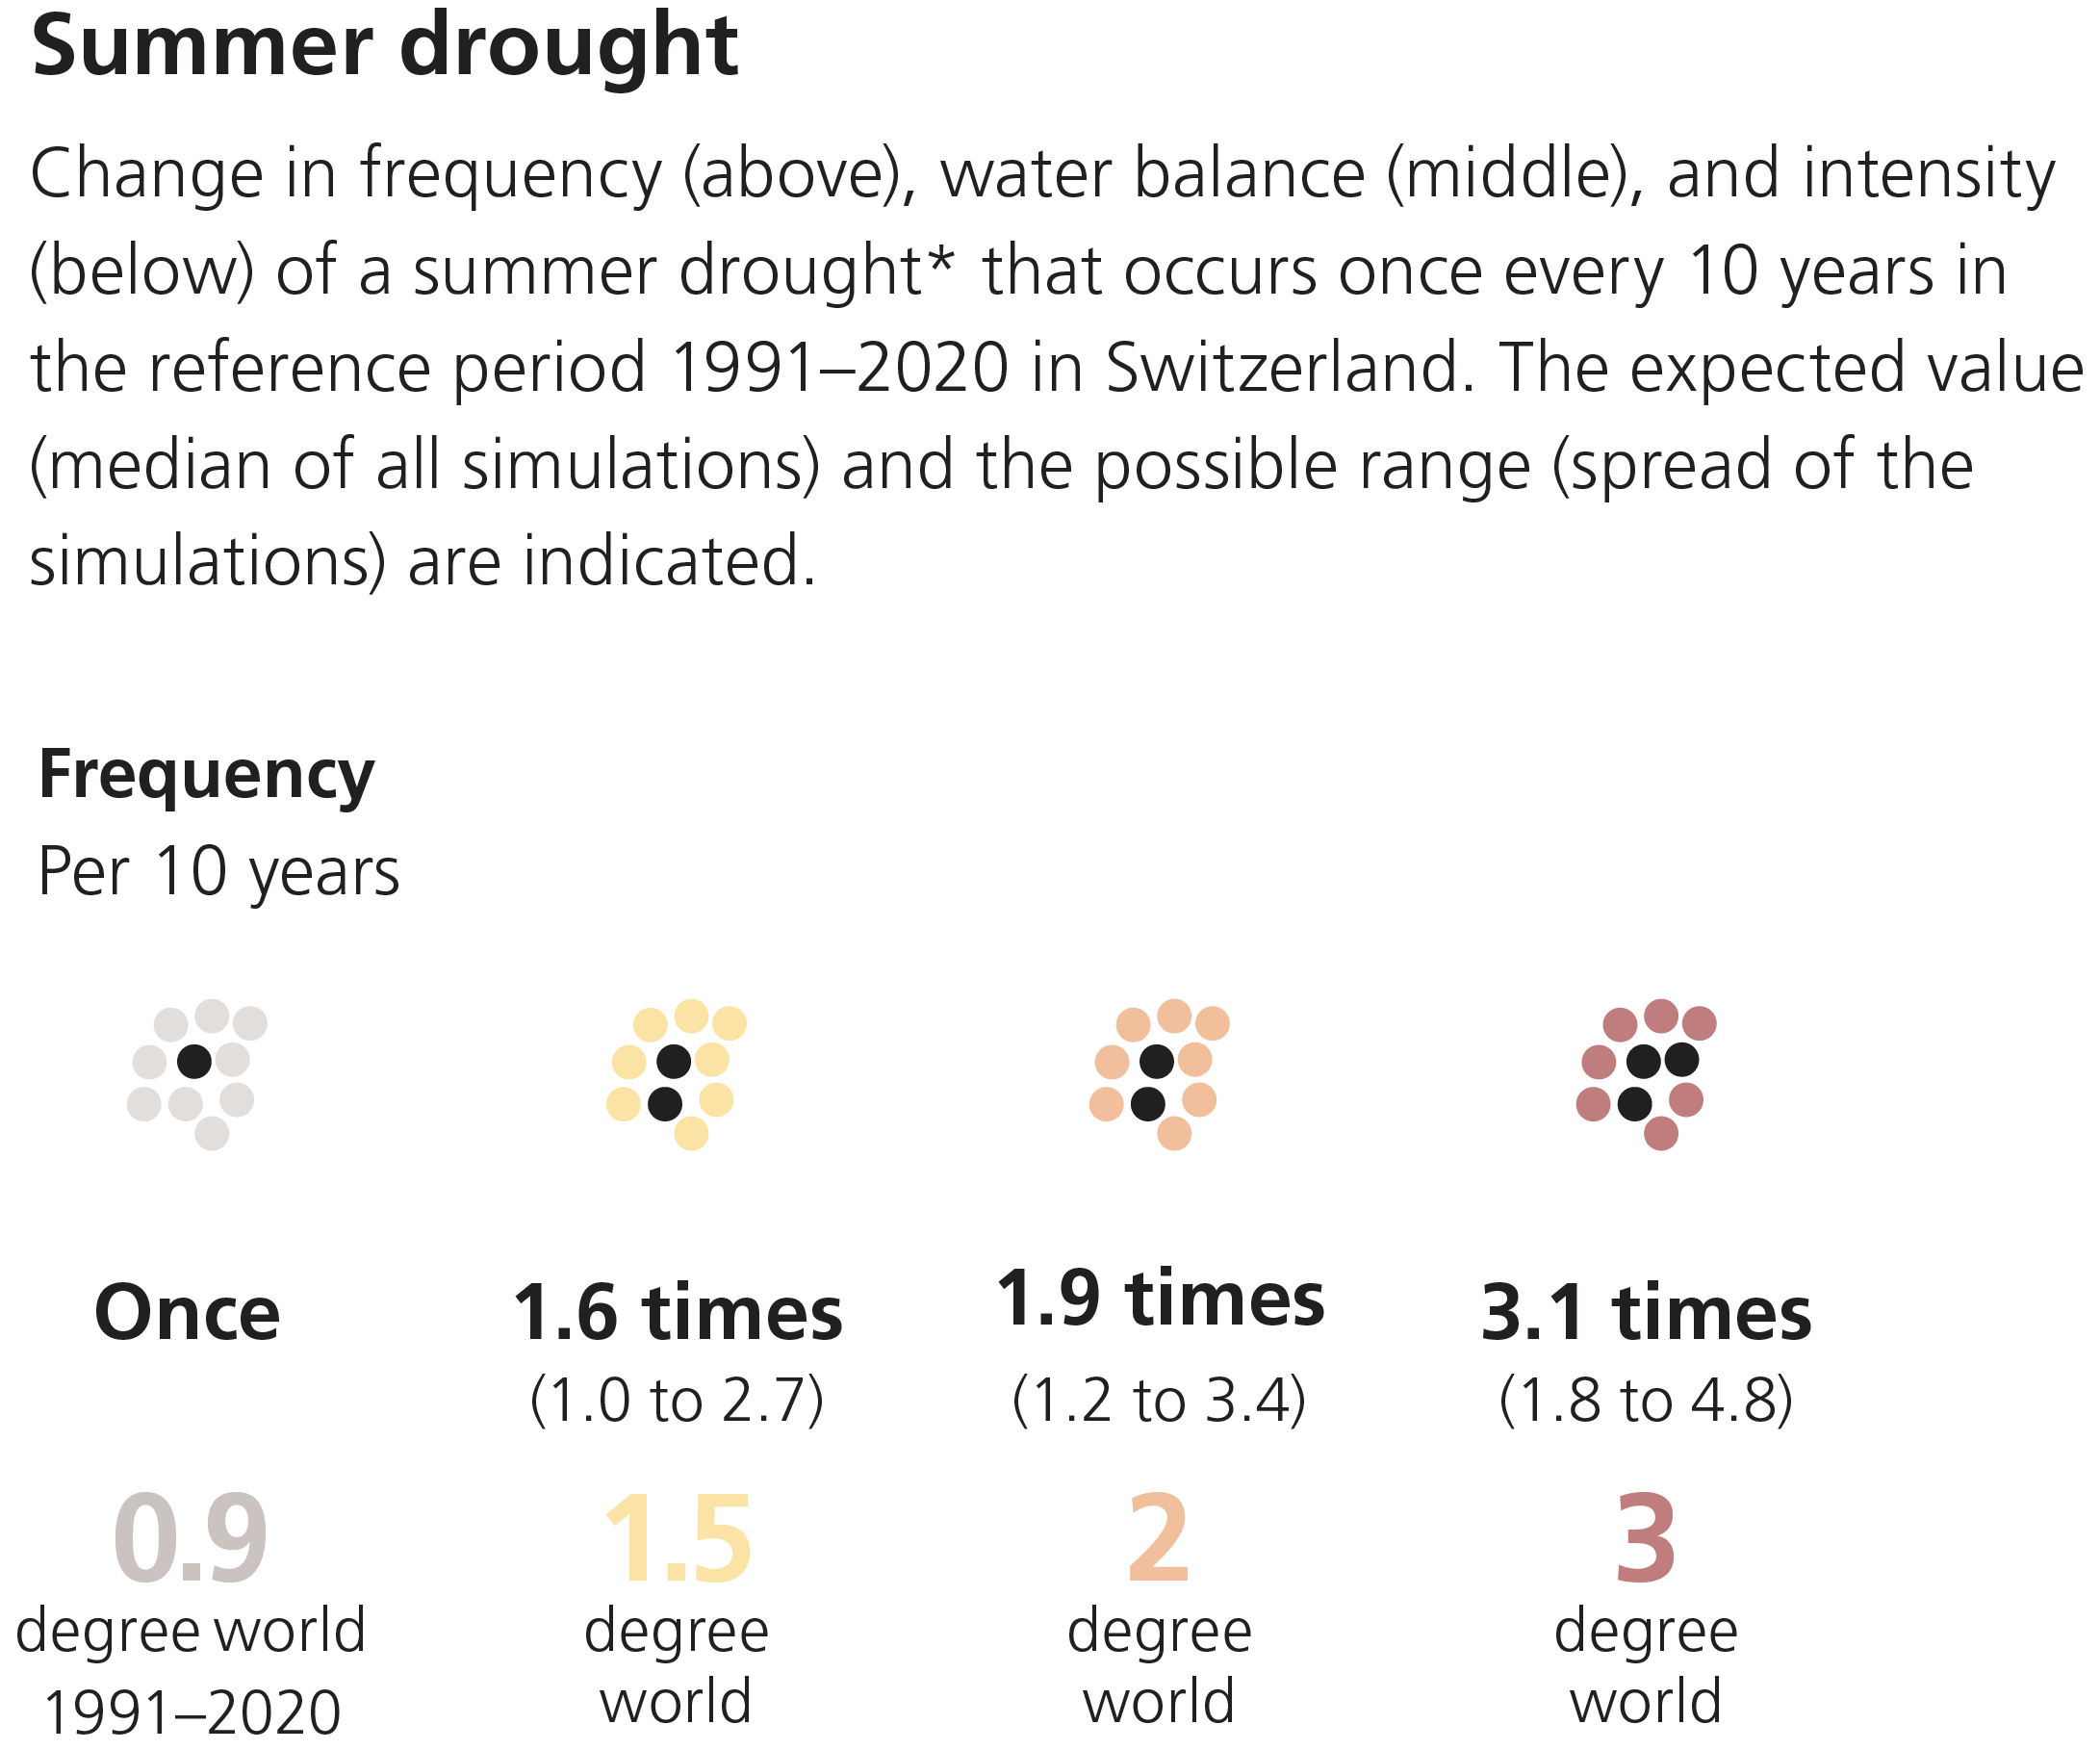
Drier summers lead to an increased risk of forest fires as well as increasing frequency and intensity of droughts, as depicted in the Figures below.

Precipitation in winter will increasingly fall in the form of rain instead of snow as the zero-degree line increases.
Potential economic consequences:
- Sudden flash floods and hail can cause property damage and business interruptions. In addition, they can destroy agricultural crops. This will negatively affect economic output and decrease the value of properties in areas at risk.
- Drought leads to yield losses in agriculture and increased risk of forest fires, causes water shortages in reservoirs and restricts water supply. In addition, drought can intensify and prolong heatwaves. This will negatively affect economic output
- Thawing permafrost and melting glaciers can lead to unstable slopes, and the water cycle may be disrupted. This will affect industries that depend on water (e.g., for cooling). Decreasing snow will also affect winter tourism and associated industry sectors.
3. Estimating financial impacts
For the potential future changes in temperature and precipitation in Switzerland because of global warming, the possible economic consequences have been explored in the sections above. To what extent these are relevant for risk management of a financial institution will depend on the sectors and physical locations of their clients, counterparties and issuers of securities in which they invest.
The general steps taken to perform a materiality assessment for individual clients, counterparties and issuers are:
1. Identify transmission channels through which the impacts of global warming can negatively impact their business.
2. Estimate the financial impact of individual transmission channels.
- As historical data is not representative of what is likely to happen in the future under global warming, a common approach is to use scenario analysis.
- FINMA explicitly expects financial institutions to employ scenario analysis when performing the materiality assessment for nature-related financial risks in its recent circular (link, see our Zanders blog for a summary).
- The Swiss climate scenarios can form a basis for the scenario analysis. However, the climate impacts that have been made available by MeteoSwiss (see Section 4) need to be translated to a financial impact for clients, counterparties and issuers. The impact on both revenues (e.g., lower sales due to business disruptions or lower demand) and costs (e.g., higher costs due to damages or required additional investments) need to considered.
- Mitigating measures such as insurance can be taken into account if they are deemed effective in the scenarios considered.
3. Reflect the estimated financial impact in internal risk metrics, such as credit ratings, collateral values and the value-at-risk of investments.
For companies that are active internationally, or which depend on international supply chains, the exposure of their supply chains and international markets to the impact of global warming also needs to be considered.
4. Swiss climate scenario data
With the publication of the Swiss climate scenarios, MeteoSwiss also makes available detailed scenario data. This data can be viewed through an interactive WebAtlas (link) for combinations of:
- Various temperature and precipitation indicators (listed in the document “Overview of CH2025 climate indicators” (link))
- Reference period (1991-2020) and three future Global Warming Levels (GWL1.5, GWL2.0 and GWL3.0)
- Annual changes as well as seasonal changes (Winter, Spring, Sommer and Autumn)
- Switzerland as a whole, each of five ‘biogeographic’ regions (Jura, Swiss Plateau, Pre-Alps, Alps, and South side of the Alps) as well as individual weather stations
- Three climate scenarios (SSP1-2.6, SSP2-4.5 and SSP5-8.5) over time (2040-2060) (for mean temperature and precipitation only)
The following detailed data can also be accessed directly:
- Historical climate data (daily) at individual Swiss measurement stations since measurement started, covering 169 indicators related to temperature, humidity, precipitation, wind, sunshine, snow, air pressure, evaporation and radiation. (link)
- These data have been ‘homogenized’ for changes in measurement methods over time.
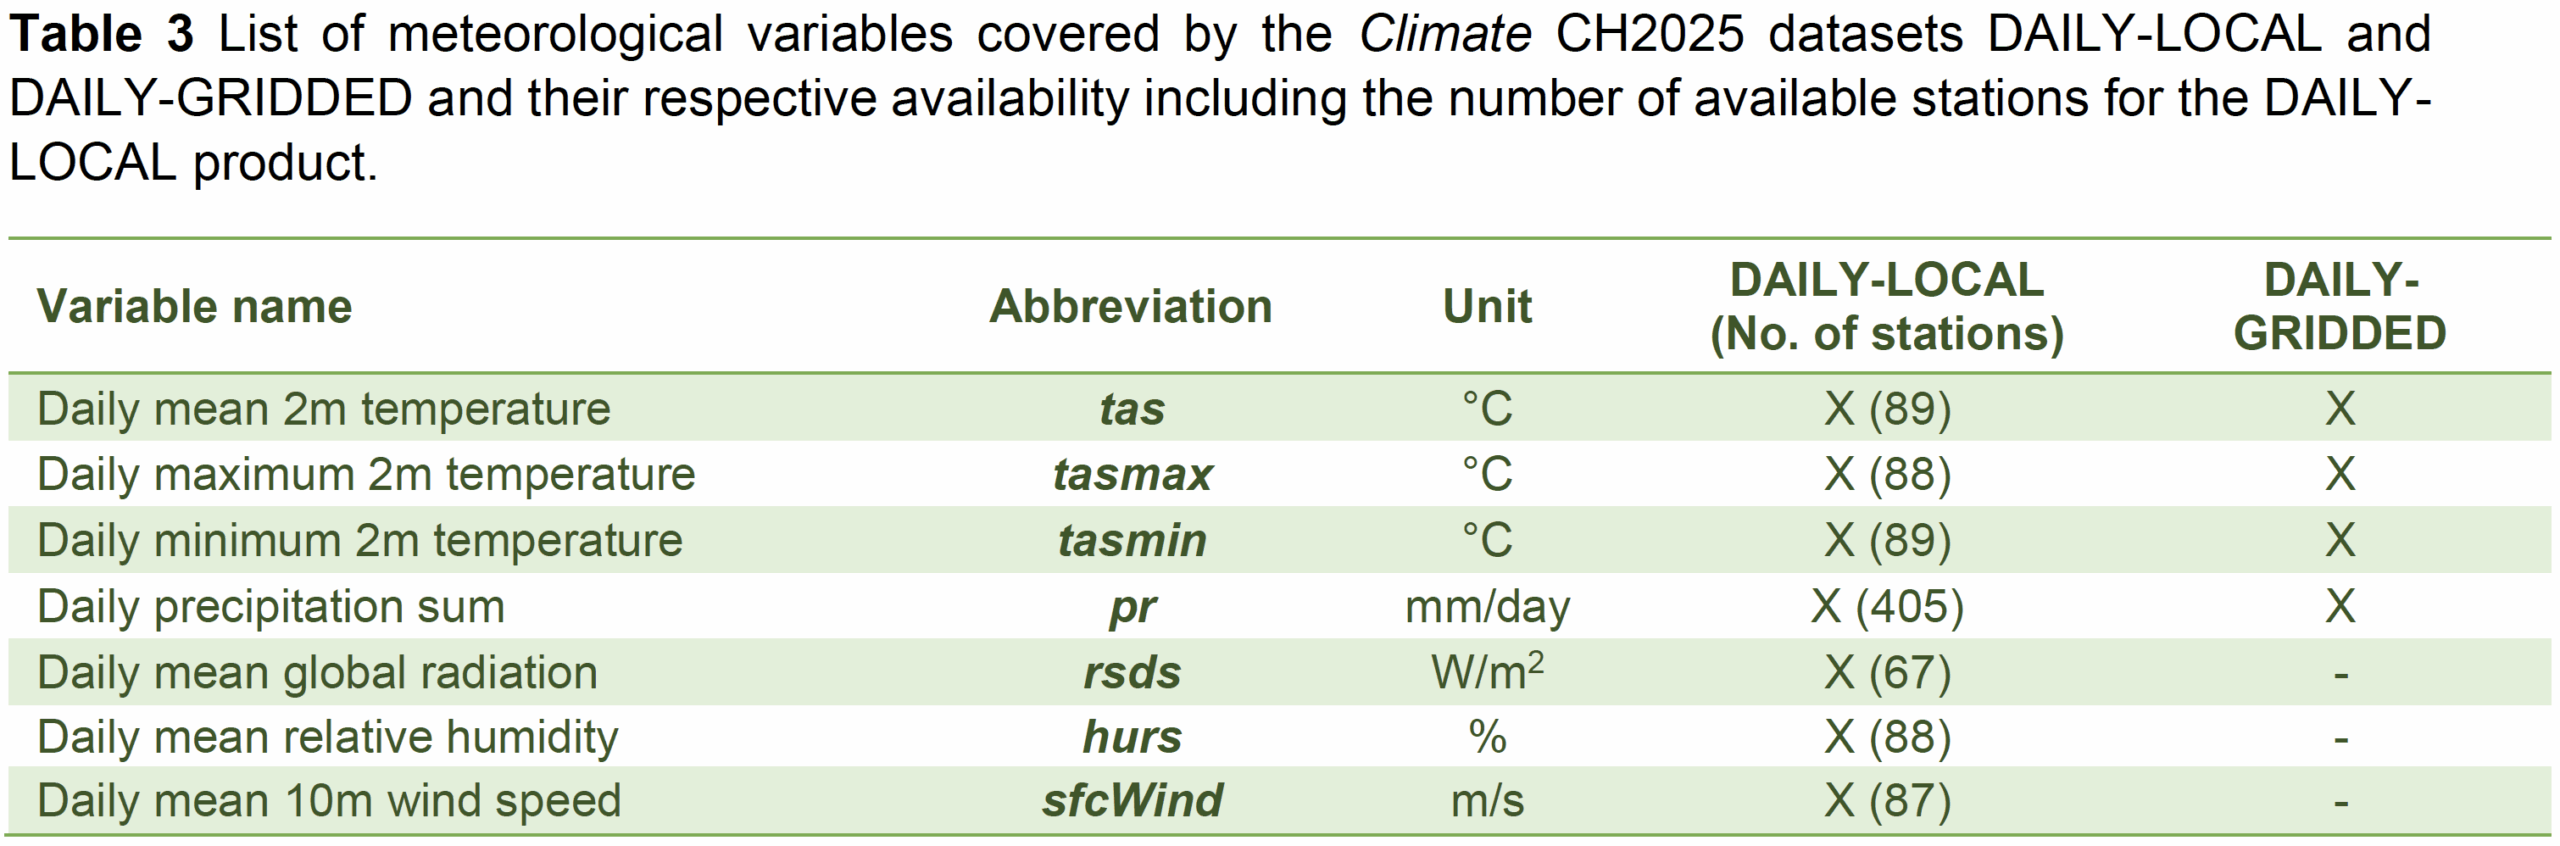
- Scenario forecast data (daily) for different Global Warming Levels (GWL) under different Regional Climate Models (RMC) (link)(link) at
- Individual weather stations (DAILY_LOCAL)
- 1km×1km gridpoints in Switzerland (DAILY-GRIDDED)
Climate variables included in the daily scenario forecasts are shown in the table below.
How Zanders can help
We have supported various banks with the assessment of the materiality of climate risks for their clients, counterparties and investment issuers. With our focus on risk and technology and our strength in applying quantitative approaches, we are particularly well equipped to substantiate a materiality assessment with scenario analysis and the use of data. If you want to learn more, do not hesitate to contact us.

Get climate risk support
Speak to an expert


This blog is the first blog in a series of 3 blogs on the ECB’s 2026 Geopolitical Reverse Stress Test.
Introduction: Why This Matters Now
Geopolitical risk has become a defining feature of today’s financial landscape. Trade fragmentation, sanctions, and regional conflicts are reshaping markets and business models. Recognizing this, the European Central Bank (ECB) will run a thematic Reverse Stress Test (RST) on geopolitical risk in 2026 as part of its explicit supervisory priorities. Unlike traditional stress tests, RST starts from a failure condition and works backward to identify plausible scenarios that could lead to this situation.
Hence, this exercise is not about plugging in generic macro shocks—it’s about uncovering hidden vulnerabilities. And that requires one critical ingredient: an informed and detailed view of how geopolitical events may affect your organization.
The Key Challenge: Seeing the Full Picture
To pass muster with supervisors, selecting and explaining the transmission channels will matter far more than the numerical modeling. If relevant channels are missed, the backward search becomes blind, undermining the credibility of the entire exercise. The ECB has made clear that banks must go beyond traditional macroeconomic modeling and identify how disruption to trade flows and supply chains, cyberattacks, and even physical risks related to conflicts might affect banks and their clients, and in turn how this transmits to banks’ capital, liquidity, and operations.
While the ECB has mapped out the primary pathways through which geopolitical risks propagate, the size and nature of the impact will very much depend on each bank’s location, exposures, and business models — meaning a one-size-fits-all approach will not work. Reverse stress testing is designed to uncover failure pathways, but this only happens if transmission channels have been studied and selected with care.
Building a granular, bank-specific taxonomy of geopolitical risk drivers and their linkages to the portfolio is therefore a critical step.
What Does a Geopolitical Risk Taxonomy Look Like?
Well-defined transmission channels should link high-level risk drivers to specific impacts and risk parameters. For example:
- Drivers: Trade tensions, sanctions, regional conflicts, cyber threats, energy disruptions, and overall market volatility.
- Impacts: Credit losses (through direct and indirect exposures), loss of revenue (loss of markets, loss of pricing power), cost increases (funding costs, safety and security measures, insurance premiums, staff compensation and relocation), compliance and legal risks (sanctions breaches, disputes).
- Risk Parameters: PD and LGD shocks, market risk factors, operational risk metrics.
Once relevant transmission channels have been defined and quantified, the severity of the shocks to the risk drivers can be tuned so that the targeted reverse stress impact is achieved. In the case of the ECB reverse stress test, a CET1 capital impact of 300 basis points is targeted. Finding a balanced set of shocks to achieve the reverse stress target will require expert judgement and needs to be documented properly.
A layered approach like this will help ensure that the exercise does not become a paper product but a strategic diagnostic tool that meets supervisors’ expectations. In our next blog, we will spend more time on how to set up a proper taxonomy and make it actionable for your organization.
How Zanders Can Help
At Zanders, we support banks in building a robust RST framework. Our approach includes:
- Quantitative modeling to support or benchmark scenario design.
- Advisory support to design a purposeful, bank-specific taxonomy and link it to ICAAP.
- Hands-on assistance during stress test exercises, leveraging our experience with several European banks.
- Tool development and deployment of our Credit Risk Suite (CRS) for scenario modeling, automated ECL and CET1 impact calculations, and advanced scenario building.
With Zanders, you can move beyond compliance to create a stress test framework that enhances your strategic capability.

Create your stress test framework
Speak to an expert


As businesses globally assess what impact the changes to Swift’s cross-border payment transaction methods will have, this blog sets out the history of the service and examines its pros and cons.
This article was first published on: TMI (Treasury Management International).
As the Swift MT-MX1 co-existence phase came to a soft ending in November 2025, ISO 20022 (MX) messaging became the main standard for cross-border payment instructions between FIs. The migration will see the majority of cross-border payments moving from the legacy Swift FIN network to the Swift InterAct (FINplus2) network, with Swift providing an extension to the translation services where an FI has still not completed the migration to MX payment messages. Furthermore, last year, Swift started a pilot that would also allow the corporate community to access the FINplus network under a new Standardised Corporate Environment (SCORE) Plus model3. This article aims to demystify SCORE Plus as a possible additional or replacement Swift for corporates service and considers the key question – does it make sense for the corporate community to adopt?
Evolution of Swift for Corporates
The corporate community first gained access to Swift back in 1997 through the treasury counterparty model. This enabled corporates to receive the MT300 series messages covering FX confirmations. In 2001, corporate access evolved through the Member-Administered Closed User Group (MA-CUG) model. This enabled the corporate community to access the Swift FIN network covering the traditional MT-based messages in addition to the new Swift FileAct network, which supported file-based flows.
However, given the bank proprietary/bilateral nature of the MA-CUG model, this logically evolved into the SCORE model in 2006. SCORE offered the corporate community a more standardised and simplified implementation of the multi-banking model with access to both Swift FIN and FileAct networks.
Corporate adoption of Swift
From a corporate perspective, we have seen two primary adoption models:
- Swift FileAct only: under this corporate adoption model, vendor urgent and non-urgent payments, tax payments, treasury transactions, and in some cases payroll transactions are all sent to the cash management partner banks via FileAct. This standardised and secure file-based model simplified the corporate technology integration stack, with the flexibility to support both industry and bank proprietary payment, status reporting and balance and transaction reporting file formats. Importantly, performance wise, there was no material delay in the banking community processing urgent treasury payments under a file-based model, when compared with a separate Swift FIN network connection, with FileAct typically offering much richer file and transaction level status monitoring through the use of the ISO 20022 XML payment status report.
- Swift FIN and FileAct: this second corporate adoption model was typically linked to corporates that operated a TMS that only generated the Swift MT101 payment message. Individual treasury payments would be sent via the Swift FIN network, with vendor payments, tax payments, and possibly payroll transactions being generated within the ERP system and sent as a file using the Swift FileAct network. This adoption model required the corporate to subscribe to both the Swift FIN and FileAct networks.
Corporate adoption of XML messaging
An important point to underline at this stage is the corporate adoption of ISO 20022 XML messaging. A combination of the 2009 ISO standards maintenance release – commonly referred to as XML version 3, the underlying corporate motivation to simplify and standardise banking integration and finally the global industry collaboration – the common global implementation market practice group (CGI-MP4), which published a series of implementation guidelines.
These factors all contributed to XML payment messaging going mainstream in the corporate to banking domain. As the XML payment message (pain.001) could support almost any payment method globally, the corporate community embraced XML messaging for vendor payments, payroll, urgent payments, tax payments, and treasury transactions.
XML messaging enabled the corporate community to at least standardise the file format for making payments across the multi-banking environment, with the associated benefit of richer file and transaction status reporting.
Introduction of SCORE Plus
SCORE Plus, which came on-stream last year, is being labelled as an enhanced Swift for corporates adoption model, which provides more detailed and structured data for payments and reporting, combined with real-time transaction tracking and management, offering corporates improved visibility into their payment life cycle.
However, this reference to improved data is directly linked to the corporate migration onto ISO 20022 XML standard from the legacy MT101 FIN message. As noted above, the corporate community adoption of ISO 20022 XML messaging is already mainstream – globally. Second, taking the current cross-border payment services into account, payment tracking is already available today through the Swift Gpi service5 which enables the tracking through to the beneficiary bank account being credited.
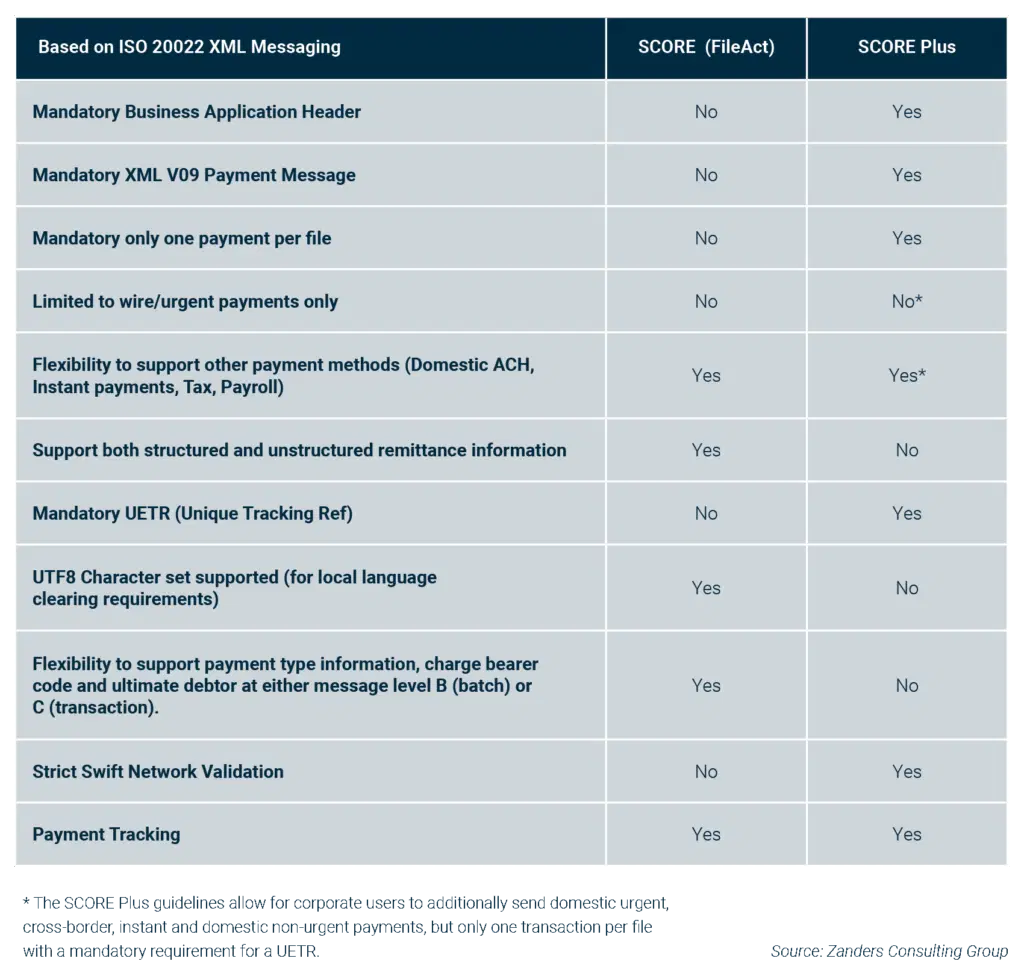
The table below (fig. 1) seeks to highlight some of the key differences between SCORE (FileAct) and the enhanced SCORE Plus solutions from a corporate community perspective.
What is the impact to the corporate community?
While the below table provides a simple overview of the key differences, it’s important to understand what this means in practice to the corporate community, as there are some significant considerations:
- XML Version 9 payment message: first and foremost, any corporate looking to adopt SCORE Plus will have to develop the new XML version 9 payment message (pain.001.001.09), which was introduced as part of the ISO 2019 annual standards maintenance release. While this SCORE Plus development will permit other domestic payment methods, which can be defined through use of the service level code, users are limited to sending just one transaction per file. This single transaction limitation follows the same logic as the legacy FIN MT101 payment message, despite the richness and flexibility of the underlying XML V09 payment message, which has almost 1,000 XML data tags.
- Business Application Header: in addition to developing the new XML V09 payment message, there is an additional Swift requirement to also include the Business Application Header (BAH), which contains sender and receiver information. The BAH is not required where the XML V09 payment message is sent under the traditional FileAct connection.
- Swift network validation: strict network messaging validation will apply to all SCORE Plus messages. While this might sound like a benefit, migrating to the new XML V09 message will logically and ultimately embrace the other payment methods that can be sent in bulk – so domestic non-urgent, instant, domestic urgent, tax, and potentially payroll transactions that will be sent via Swift FileAct. A key guiding principle of the CGI-MP group was data over-population, which both simplified the design and development of XML payment messaging, and also enabled a core multi-banking XML template to be agreed with core banking partners. This approach is particularly beneficial where a corporate maintains a global master vendor record, which typically contains both domestic clearing and international bank routing codes in addition to full address information. This approach allows more information to be provided in the XML payment message as part of an agreed template, with the originating banking partner accepting and ignoring any surplus data that is not relevant for the requested payment method. Although there does appear to be some flexibility under the SCORE Plus model, this is an area that needs to be carefully considered as part of any adoption decision in order to ensure messages that contain data over-population will not be rejected by the Swift network. This means the corporate community will need to closely review the published Cross-Border Payments and Reporting Plus (CBPR+) industry guidelines6 to determine any possible friction points.
- Remittance Information: SCORE Plus will support up to 9,000 characters of payment remittance information, however this can only be provided in either the structured or unstructured xml tags. Users are not permitted to use both structured and unstructured within the same payment message. This is in contrast to the Swift FileAct model, which will allow the corporate community to populate both structured and unstructured xml tags within the same payment instruction.
- Message Design: when the XML payment message was designed, it provided flexibility for the corporate community to decide whether to specify elements such as the payment method, ultimate debtor, and charge bearer code at batch or individual transaction level. This flexibility allowed for a more efficient payment message design as a file containing 10,000 non-urgent payments could be defined once using the service level code NURG at the batch level as opposed to 10,000 times at a transaction level. Now while SCORE Plus is crystal clear that only single transactions can be sent within each file, which removes any issue, this does mean the corporate community will need to design a completely different XML V09 message for the Swift FileAct flows adding additional complexity and cost.
- Status Monitoring: in terms of the status monitoring and tracking capabilities, SCORE Plus provides options, which translate into additional development. The first option is to use the new XML V10 payment status report, which, subject to partner bank capabilities, will incorporate the Swift Gpi end-to-end tracking for cross-border payments. Alternatively, or in addition to the payment status report, Swift will be introducing the new TRCK.004 payment tracking message, which will provide improved end-to-end visibility around cross-border payments. The new tracking message will be released as part of the November 2026 standards release (SR2026). Although this initially sounds positive, it’s important to remember that the Swift Gpi service enables tracking through the intermediate banking partners through to the beneficiary bank account being credited. Furthermore, the new XML V10 payment status report will still be required for the Swift FileAct flows whenever the corporate decision is taken to migrate to the XML V09 payment message. Ultimately, this could mean two types of status and tracking messages will have to be developed, contributing to the overall cost and time taken to complete any development.
Key questions corporates should be asking themselves
The first question is what is the reason behind considering SCORE Plus? If a business is currently sending the MT101 message via Swift FIN, there is currently no industry-agreed end date to the corporate community sending the MT101 payment message to partner banks. However, given the November 2026 end date for providing the unstructured postal address, this might require some fine tuning in the form of adopting Tag 59 option F. This Swift-agreed industry workaround permits the corporate community to send structured postal address data, subject to specific formatting rules. The Tag59F approach provides a light-touch way of achieving compliance as the actual development is limited to a field-level change in addition to some master data address clean-up work. And full compliance means providing the minimum mandatory postal address data requirements7 – city/town name and ISO country code.
Alternatively, the reason might be to replace the existing Swift FIN network connection with the new SCORE Plus network. If this is the case, it is important to consider whether there is an existing Swift FileAct connection to send payment messages. The benefit of potentially extending the use of the existing FileAct connection to also make cross border payments is twofold.
- It removes the immediate requirement to develop the new XML V09 payment message, BAH and associated new tracking messages.
- It now allows the consolidation of Swift services to just a Swift FileAct service and thereby reducing overall Swift membership costs.
Conclusion
SCORE Plus has been designed as a replacement for the legacy Swift FIN network. While the benefits are mainly associated with a corporate migration from the MT101 message to the new XML V09 payment message, this does not recognise that XML messaging is already mainstream within the corporate community – with Swift FileAct typically supporting a multi-banked file-based interface.
There are also alternative approaches to address the forthcoming November 2026 compliance deadline – both a light touch for MT101 users, while existing XML V03 (version 3) message users can add cross-border payments as a new payment method and configure either the hybrid address or full structured address and continue to send via Swift FileAct or bank proprietary host-to-host connection.
An additional material risk is the pending decision on whether corporates that adopt SCORE Plus will also have a mandatory requirement to keep aligned to the latest version of the XML payment message. Discussions are planned for December 2025, but if the decision is taken to force corporate users to align to the annual ISO standards maintenance release, this will create a significant cost overhead on corporate users, with questionable benefits.
It’s also important to note that the associated XML V08 bank statement (camt.053.001.08) is currently in pilot-only mode and is subject to release later this month. As the SCORE Plus network has a bandwidth limit of just 100Kb, this translates to approximately 250 transactions that can be reported per bank statement message. This limitation does not exist under the FileAct network.
So, recognising the typical cost pressures within the corporate domain, further internal questions must be asked before formalising a plan to adopt SCORE Plus. It’s important that an informed decision is made around this key architectural change, as it impacts the connectivity, messaging, and associated payments workflow.
Does the commercial business case really stack up, or is now the time to think about if and when rationalising the current Swift for corporates services makes sense?

Navigate the transition to ISO 20022 with confidence.
Speak to an expertCitations
- SWIFT will be moving from the traditional MT (FIN)-based messages, initially in the cash management payments space, onto ISO 20022 XML messages (MX). ↩︎
- FINplus Service enables financial institutions to exchange the ISO 20022 messages for securities and payments in a secure, cost effective and reliable way. ↩︎
- SCORE Plus is an enhanced evolution of Swift’s Standardised Corporate Environment (SCORE) service. ↩︎
- https://www.swift.com/standards/market-practice/common-global-implementation ↩︎
- SWIFT gpi (Global Payments Innovation) is an initiative by SWIFT that improves international payments by providing features like end-to-end payment tracking, fee transparency, and faster credit to recipient accounts. ↩︎
- Cross-border Payments and Reporting Plus (CBPR+) is a set of specifications for ISO 20022 financial messages over the Swift network. In essence, it refers to the types of ISO 20022 messages that will be used over Swift. CBPR+ messages over Swift are also referred to as “MX” messages, as they differ in format from the traditional MT messages used over Swift. ↩︎
- While City/Town Name and ISO country code is the agreed minimum mandatory data requirements for cross border payments based on the CBPR+ guidelines, some countries do have additional requirements that will also need to be considered. The USA/Canada travel rules require additional address information. ↩︎

Finance and treasury teams spend significant time on repetitive, manual SAP tasks—updating business partner records, managing intercompany pricing, or handling payment cut-offs. These processes are not only time-consuming but prone to errors, operational risk, and compliance challenges.
While SAP S/4HANA provides a strong ERP foundation, standard functionality alone often cannot address complex, organization-specific requirements. Our suite of tools helps organizations automate processes, integrate systems, and optimize finance and treasury operations. From mass uploading business partner data to automating transfer pricing, managing payment cut-offs, and sending accurate exposure data to Kantox through the SAP Kantox Adapter Tool, these solutions save time, reduce errors, and deliver measurable business value—all while fitting seamlessly into existing SAP landscapes.
What many don’t realize is that the SAP S/4HANA Cloud, public edition, can also be tailored to specific business needs. Through extensibility, your ERP system can be enhanced without touching the core code, ensuring full compatibility with SAP’s updates. By enabling organizations to add tailored business logic, extensibility supports innovation, process optimization, and capabilities that go beyond standard cloud functionality.
This article will first explore the bespoke solutions we offer and then shift to the extensibility options available in SAP’s public cloud edition.
SAP Business Partner Upload Tool
The Business Partner (BP) Upload Tool accelerates the creation and maintenance of SAP Business Partner records—traditionally a long, manual, and time-consuming task—by enabling mass uploads of key data such as names, roles, IDs, addresses, settlement instructions, and other master data attributes.
Zanders’ BP Upload Tool streamlines these tasks using a structured Excel template with multiple worksheets, allowing users to choose the level of detail they want to maintain for each Business Partner.
Key features and benefits of the BP Upload Tool:
- Upload unlimited data records
- Process hundreds of BPs within minutes
- Handle thousands of settlement instruction records
- Track and trace upload results through a detailed system log
SAP Integration with Zanders Transfer Pricing Solution (TPS)
In addition to master data management, organizations also face efficiency challenges in other treasury-related areas. One of the most critical is managing intercompany transactions and ensuring accurate, compliant transfer pricing. This is where Zanders’ Transfer Pricing Solution provides additional value.
Zanders’ cloud-based Transfer Pricing Solution automates the pricing of intercompany deposits and withdrawals, reduces manual effort in treasury workflows, and generates detailed audit-ready documentation for every pricing run.
To support this process, we have developed an integration tool that leverages web services and APIs to automatically price cash pool transactions directly from SAP S/4HANA in an OECD-compliant manner.
This integration component is estimated to save our customers around 100 hours of manual work annually, on top of the benefits derived from lowering the risk inherent in transfer pricing calculations.
Zanders SAP Kyriba Interface
Effective treasury operations rely not only on accurate pricing but also on smooth integration between ERP and treasury platforms. To address this, Zanders has developed tools that enhance these processes while minimizing manual effort and operational risk.
Zanders SAP Kyriba Interface is an integration framework that automates payments, accounting, cash forecasting, and internal settlements between SAP and Kyriba. It streamlines data flows end-to-end and reduces the need for manual intervention.
The interface manages key processes across multiple areas:
- Outbound Payments
Enhances SAP’s Data Medium Exchange Engine (DMEE) to generate payment files according to the Kyriba file naming convention. This ensures straight-through processing and control over file routing and payment execution in Kyriba.
- Inbound Accounting
Imports accounting data from Kyriba into SAP via BAPI (Business Application Programming Interface), with validation and duplicate prevention for cash and financial transactions.
- Outbound Cash Forecast
Exports open AP/AR balances and cash flow data from SAP to Kyriba for forecasting and bank mapping.
- Outbound Internal Settlement
Exports SAP AP/AR items eligible for internal settlement to streamline intercompany reconciliation and settlement processes.
SAP Kantox Adapter Tool
Beyond cash management and payment automation, organizations also face challenges in handling currency exposures. Zanders provides a dedicated solution to enhance this process and ensure accurate, consistent data for Kantox.
The SAP Kantox Adapter Tool is a streamlined interface that extracts currency exposure data from SAP sales and purchase orders and sends it to Kantox through a secure API. It standardizes data mapping, automates processing, and provides an intuitive SAP interface for reviewing and transmitting exposures, including updates and cancellations.
Key Features
- Automated extraction and mapping of SAP order data into Kantox-ready JSON
- Secure API communication with token-based authentication
- ALV screen for filtering, reviewing, selecting, and processing exposures
- Handles new, updated, and cancelled items with delta logic
- Customizable configuration for API parameters and filtering rules
Key Benefits
- Reduces manual processing and operational risk
- Ensures accurate, consistent exposure data for Kantox
- Improves transparency through real-time status updates and logs
- Easily adjustable to business requirements via configuration
Automated Cut-Off Time Handling in SAP Payments
In addition to integrations, payment timing is another area where automation can significantly reduce risk. Zanders’ automated cut-off time enhancement addresses this challenge.
This SAP enhancement automates the handling of internal payment cut-off times within SAP In-House Cash. Banks enforce daily cut-off times—deadlines after which payments are processed on the next business day. Standard SAP logic does not always account for these constraints, which can lead to delays or missed payments.
How the solution works:
- Automatically checks if a payment is being made too late in the day
- Adjusts the payment date to ensure it meets the bank’s cut-off time
- Uses SAP’s Business Rules Framework (BRF) to tailor logic to company-specific needs (e.g., currency, bank location, urgency)
Key Benefits:
- Fewer payment delays
- Improved cash flow planning
- Eliminates manual checks
- Seamless fit with existing SAP systems
- Customizable to business rules
These tools are compatible with SAP S/4HANA On-Premises and Private Cloud editions and are deployed under Zanders’ namespace. This ensures they do not interfere with the customer’s own developments and allows Zanders to safely deliver support updates without impacting the customer environment.
While Zanders’ tools streamline SAP processes like payments, currency exposures, and transfer pricing, some clients on SAP S/4HANA Public Cloud may think there’s no room for customization. In the next section, we will explore the platform’s extensibility capabilities, which allow organizations to adapt and extend their cloud system safely, without altering the core code.
Tailor Your Cloud: How Extensibility Empowers SAP S/4HANA Public Edition
SAP S/4HANA Cloud, public edition, is a standardized, continuously updated cloud ERP system. For many organizations, this standardization provides a solid foundation for managing core business processes like finance, procurement, and logistics. However, every business has unique competitive differentiators or regulatory requirements that the standard software simply cannot address.
As adoption of SAP’s cloud solutions grows, organizations increasingly want these platforms to meet their specific business needs.
This is where Extensibility comes in.
Extensibility is the built-in capability that allows users and developers to adapt, extend, and integrate new functionality into S/4HANA Cloud without modifying the core code. This "Clean Core" approach is essential in a public cloud environment, ensuring that custom solutions remain fully compatible with SAP’s quarterly updates. Think of it as installing modern amenities in a historic building—you can add new features without altering the original structure.
The Three Pillars of Cloud Extensibility
The flexibility to build custom solutions on S/4HANA Cloud is delivered through a spectrum of tools designed for different needs and skill sets. These capabilities range from simple key-user adjustments to full developer-driven extensions, with the level of technical proficiency increasing at each stage:
1. In-App Extensibility (Key-User Tools)
This capability empowers business users and functional analysts—Key Users—to make immediate, direct changes within S/4HANA Cloud. These are typically simple, administrative-level modifications that improve day-to-day usability.
- What you can do: Add custom fields to master data records (e.g., a new compliance code for a vendor), rearrange screen layouts, or create custom business logic rules such as a simple approval workflow.
- The Benefit: Agility and self-service. Changes can be implemented quickly by the people who best understand the business need, without traditional programming.
2. Developer Extensibility
For more complex business processes that must be tightly integrated with the S/4HANA core, professional developers use the Embedded Steampunk environment. This allows them to write sophisticated custom code directly within the S/4HANA system while adhering strictly to cloud-compliant APIs (Application Programming Interfaces).
- What you can do: Build custom applications or highly specialized business logic (like a unique pricing algorithm) that needs access to core data in real-time.
- The Benefit: Deep integration and performance. Custom code is co-located with the ERP system, ensuring high-speed data access and seamless operation with core processes.
3. Side-by-Side Extensibility (SAP Business Technology Platform - SAP BTP)
The most innovative and decoupled solutions are created using the SAP Business Technology Platform (SAP BTP). This platform acts as an innovation layer, running custom applications that securely consume and extend S/4HANA Cloud services without being inside the ERP system.
- What you can do: Create entirely new user experiences (e.g., a custom mobile app for field service), build complex data insights, integrate with external cloud services (e.g., a logistics provider), or develop automated workflows using low-code/no-code tools such as SAP Build.
- The Benefit: Innovation and decoupling. Because the custom solution is separate, it can be developed, updated, and scaled independently, offering the highest level of stability for the core ERP and a path to unique digital capabilities.
As organizations evolve their finance and treasury functions, the need for systems that are both efficient and adaptable has never been greater. Zanders’ SAP solutions—ranging from automating master data and transfer pricing to integrating treasury platforms and streamlining payments—demonstrate how targeted enhancements can unlock significant operational value.
At the same time, the extensibility capabilities of SAP S/4HANA Cloud show that innovation can coexist with standardization, allowing companies to tailor their ERP without disrupting core processes.
By combining deep SAP expertise with a clean-core approach, we enable organizations to transform today’s operations while building a flexible, future-proof foundation. This empowers companies to improve efficiency, strengthen compliance, and extract maximum value from their SAP environment.
Contact us to assess fit, request a demo, or learn more about our add-ons and technical capabilities in the public cloud.

Ready to explore a SAP S/4HANA Migration?
Read the whitepaper
Many organizations have the data they need to manage cash, but not the visibility to act on it. We explore how SAP S/4HANA helps finance teams turn fragmented information into real-time insight — and unlock liquidity across the business.
Fragmented systems, manual reconciliations, and delayed reporting make it difficult for finance teams to see the full picture of their liquidity. As a result, valuable cash remains tied up in receivables, payables, or inventory — limiting flexibility and slowing growth.
Recording and tracking working capital solutions within the ERP system ensures transparency, auditability, and control over liquidity. Clear records of financing activities enable better cash flow monitoring, compliance, and financial reporting, while supporting informed decisions and stakeholder trust.
With SAP S/4HANA, organizations can turn visibility into action. By bringing financial, operational, and supply chain data onto a single digital platform, S/4HANA delivers real-time insight into how cash moves through the business. Finance and treasury teams gain the clarity to forecast more accurately, act faster, and unlock liquidity that was once tied up in day-to-day operations. The result is stronger cash flow, lower funding costs, and a more agile, financially resilient organization.
How ECC handled working capital management processes
In ECC, recording working capital management functions relied on limited solutions such as the “Pledging Indicator” in Accounts Receivable, which offered tracking but little automation. This often led to manual workarounds and reduced transparency. The Contract Accounts Receivable and Payable (FI-CA) module offered a factoring solution to sell approved receivables to a factor bank with full accounting integration and automated postings for transfers, payments, and settlements. However, its use was largely restricted to industries such as insurance with high-volume customer billing. SAP S/4HANA changes that by embedding working capital processes directly into the digital core — enabling real-time liquidity visibility, automated settlements, and integrated accounting for financing activities.
Solution options in S/4HANA
Optimizing Working Capital with SAP S/4HANA empowers organizations to strengthen liquidity, reduce funding costs, and enhance operational agility through an integrated digital core. Built on the SAP HANA in-memory platform, it delivers real-time visibility, predictive insights, and automation across financial and operational processes that directly influence working capital performance.
S/4HANA Settlements Management is one such solution that brings together a wide range of financial and commercial settlement processes to streamline how organizations manage payables, receivables, rebates, commissions, and cost allocations. Its functionalities—covering financial settlements, rebates, commissions, freight and cost allocations, factoring, intercompany charges, and chargebacks—come together in one unified system that reduces scattered processes and cuts down manual work across departments. Integration with Accounts Receivable, Accounts Payable, and Treasury enables real-time insight into financial exposure, helping finance teams make informed decisions on funding and liquidity. By consolidating transactions, automating complex calculations, and enabling transparent, rules-based settlements, the solution accelerates cash cycles, improves forecasting accuracy, and enhances liquidity. Among its many capabilities, the factoring functionality is significantly enhanced in S/4HANA compared to ECC, offering a far more integrated and automated approach to managing receivables financing.
Factoring in SAP S/4HANA Settlements Management: An integrated approach
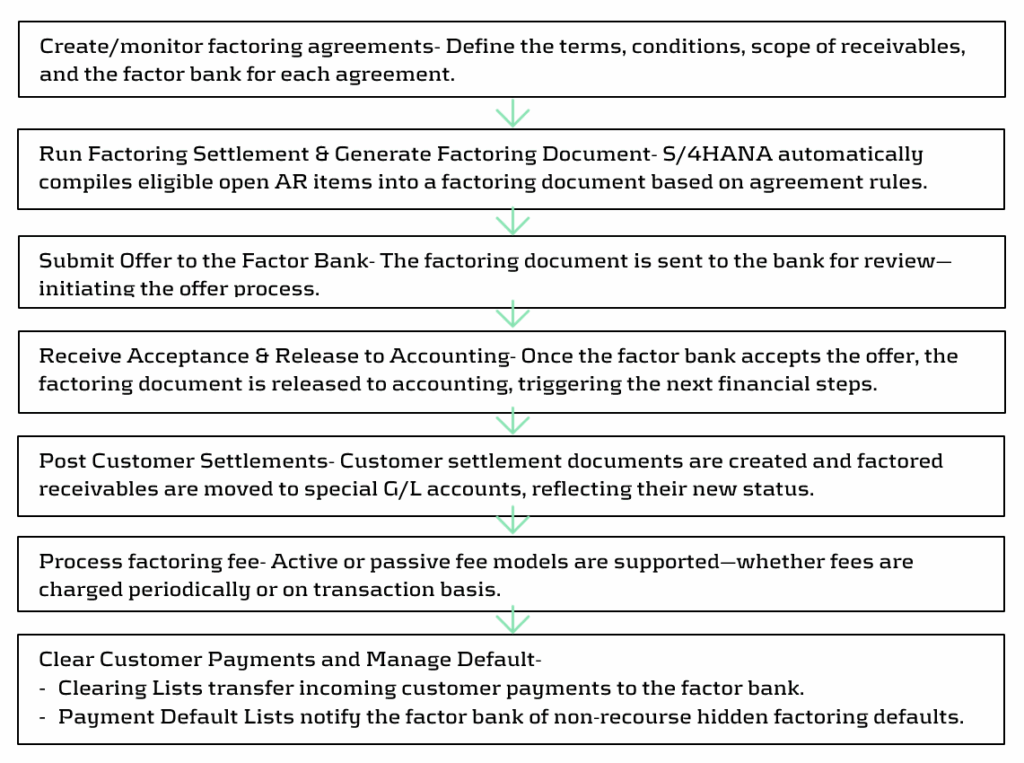
S/4HANA provides an enhanced factoring solution within Settlements Management (for private cloud), that allows organizations to manage factoring agreements with banks in a structured, automated, and auditable way. It brings transparency to the end-to-end process while improving liquidity on short notice. Below steps highlight the overall process under Factoring solution:
SAP’s future innovation strategy for working capital management focuses on delivering integrated solutions like SAP Taulia Working Capital Management which is an embedded solution within SAP’s Treasury and Working Capital portfolio that helps buyers and suppliers optimize cash flow across payables, receivables, and inventory. Built into SAP ERP and Business Network, it enables seamless integration, real-time insights, and scalable liquidity management to unlock cash, reduce costs, and strengthen supplier relationships. Taulia-based factoring capabilities are offered since 2508 for S/4HANA Private and Public Cloud customers.
Building on these operational capabilities, SAP also enables organizations to gain deeper analytical visibility across the entire working capital cycle. To support this, SAP offers Working Capital Insights — a pre-built intelligent application in SAP Business Data Cloud that consolidates data from receivables, payables, inventory, and cash to deliver unified working-capital KPIs, trends, and forecasts. It gives finance teams rapid visibility, liquidity insights, and actionable optimization opportunities with minimal setup.
Choosing the right Working Capital Solution: Drivers for selecting the appropriate option
When comparing different solution options for working capital optimization, the key difference lies in managing financing relationships and the automation that is provided out of the box. Settlements Management provides the customer with a toolset to configure the handling of predefined finance providers, making it suitable for organizations with stable funding arrangements and long-term partners. In contrast, Taulia offers a fully embedded digital marketplace that connects businesses with multiple funders through one platform, enabling flexible, transparent, and competitive financing. This makes it ideal for organizations seeking dynamic or global funding options. For any new S/4HANA Private or Public Cloud customer, selected entitlements from Taulia are included as part of the ERP entitlements at no additional subscription cost. These cover key capabilities such as Factoring, Virtual Cards and Dynamic Discounting. However, organizations that need broader or more advanced Taulia capabilities can unlock the full feature set by opting for the premium version.
Beyond cost and system integration, the choice between the two solutions should be guided by business drivers, such as:
| Business Driver | Considerations |
| Stability of existing funding arrangements | Assess if current financing options are stable and already meet liquidity goals. |
| Choice of funders and financing structures | Evaluate the need for flexibility and visibility in selecting funders or dynamic funding models. |
| Cash Conversion Cycle (CCC) | Review the organization’s CCC and determine if further optimization is required. |
| Agility to external pressures | Assess how quickly the organization needs to adapt to market or liquidity changes. |
| Supplier and buyer onboarding and adoption | Evaluate how easily suppliers and buyers can be onboarded to the chosen platform. |
| Implementation complexity and time | Compare expected implementation effort, timelines, and traceability features. |
| Scalability and geographic reach | Determine if the solution supports multi-country operations and varying business volumes. |
| Integration with existing SAP landscape | Assess how well the solution fits within the current SAP environment and data flows. |
Ultimately, the decision should align with the organization’s strategic liquidity objectives, operational maturity, and supplier ecosystem, ensuring that the selected platform not only optimizes working capital but also enhances transparency and control.
From Insight to Action: Guiding Your Working Capital Strategy with expertise
Choosing the right working capital solution is not just a technical decision — it’s a strategic one. Turning insights into action requires time, focus, and a clear understanding of both business and treasury priorities. Many organizations find it challenging to balance day-to-day operations with the strategic effort needed to evaluate and implement the right solution.
We supporst organizations in navigating this complexity by combining deep treasury expertise with in-depth SAP knowledge. Our consultants take an objective and structured approach; assessing business drivers, current processes, and operational requirements to identify the solution that best aligns with your strategic goals. Beyond technical evaluation, Zanders acts as a strategic partner, ensuring that your chosen solution supports broader liquidity, financing, and operational objectives.
Ready to rethink working capital management with SAP S/4HANA?
Contact us
This article explores how newly established treasury functions can lay foundations and go beyond day 1 readiness to establish effective, scalable, and resilient cash and liquidity management for the group, representing a critical lever for long-term financial stability and value creation of the business.
Introduction
In the previous article, From Day 1 to Strategic Partner: Building a Treasury Function for a Carved-Out Business, we highlighted the importance of a tailored target operating model (TOM) to establish a solid strategic and organizational base for the new treasury. Following the definition of the treasury TOM and once day 1 readiness measures are in place, the next priority is to focus on value creation via cash and liquidity management, which represent another key pillar for a successful treasury implementation and treasury process. Cash and liquidity capabilities play a vital role in ensuring treasury delivers both operational continuity and strategic value. This article outlines how to build that foundation by establishing robust and forward-looking cash and liquidity management processes already at the time of the transaction, addressing immediate post-transaction needs, and enabling mid-term process efficiency.
Prepare for Day 1: Managing Liquidity Readiness
When preparing for the closing of an M&A transaction, treasury plays a critical role in ensuring that the new organization operates independently from Day 1. Liquidity planning is essential as cash pressures often peak around the time of legal close.
The following aspects may erase cash reserves if not properly anticipated:
- Upfront costs (transaction fees, legal, advisory, integration).
- Debt financing frameworks still under negotiation.
- Cash repatriation constraints or internal investment requirements to support the separation.
Hence, treasury must address these topics in cash and liquidity planning by:
- Modeling short-term needs under multiple scenarios based on validated assumptions on the business’ structure and liquidity needs.
- Ensuring cash visibility and centralization of cash, where possible to manage funding efficiently.
- Evaluating working capital buffers and the need for interim funding lines.
By addressing these topics before closing, the new entity enters day 1 with visibility on liquidity positions, funding plans, and confidence in its ability to operate independently.
Manage Day 1: Establishing Control, Visibility and Centralization
For a newly independent entity, cash visibility is often fragmented across systems and bank accounts, especially in the early stages after a carve-out. Yet gaining (real-time) transparency is fundamental to effective cash management and decision-making. The foundational elements to achieve at this stage are:
- Set up efficient connectivity with all banking partners.
- Deploy treasury technology (e.g., a TMS or interim solution) to aggregate bank balances and transactions centrally.
- Implement daily cash positioning processes across all relevant bank accounts.
- Define responsibilities and control mechanisms for cash operations, ensuring a clear RACI model.
Cash visibility improves control and reduces risk while enabling better liquidity allocation across the group via a centralized cash management process. The deployment of cash concentration structures, such as cash pooling, allows the unlocking of financial resources and benefits, such as fee reduction or interest optimization. Furthermore, centralized cash management data is a prerequisite for AI-driven cash applications and greater financial risk exposure definition1, which can significantly reduce manual effort in distributing and managing cash across the group.
Early Stabilization: Forecasting and Short-Term Control
Once operational continuity is secured, the focus should move to stabilizing cash and liquidity processes.
Forecasting in a post-carve-out environment is challenging, yet essential. Missing historical data, unclear transaction volumes, and transitional arrangements (e.g., TSAs) often reduce forecast accuracy.
A suitable solution is the deployment of a layered forecasting approach, including:
- Short-term cash flow forecasts (typically 13-week rolling) to guide immediate liquidity needs.
- Medium-term liquidity planning, integrated with business planning (FP&A) and CAPEX cycles.
- Stress-testing and scenario analysis to evaluate performance under simulated business conditions.
In our experience, cash forecasting is an evolving process, which can be optimized and automated over-time through data integration (e.g. from ERP system) and predictive modeling. With data quality as the foundation, cash flow forecasting can begin by establishing the most accurate starting point and committed forecasts under company control, such as opening balances and invoice payables. Once the high-certainty inputs are captured, additional cash flows such as committed accounts receivable and other material forecasts e.g. sales forecast or CAPEX forecast can be integrated.
Carved-out entities must consider the growing maturity and quality of their systems and respective data over the first 12 months after day 1.
Designing a Fit-for-Purpose Liquidity Structure
Once visibility and forecasting are addressed, the focus should immediately shift to structuring liquidity flows across the new organization. The objective is to ensure funding efficiency, mitigate cash drag and trapped cash, and enable flexibility, all within the constraints of the newly formed legal and operational setup.
Key design considerations include:
- Tailored cash pooling and automated cash concentration structures.
- Intercompany funding structures, including currency and transfer pricing alignment and documentation.
- Liquidity buffers tailored to business volatility and seasonality.
- Working capital optimization levers (e.g., payment terms, supplier financing).
Hybrid liquidity management structures, combining centralized oversight with localized autonomy for operational banking, often achieve the best balance. Zanders supports clients based on its wide experience in bank relationship strategy and liquidity optimization for disentanglements.
Optimizing Cash Flow Management towards long-term state
Throughout the transition and towards the steady-state operations, treasury must monitor and manage cash & liquidity against an evolving backdrop of business integration activities and one-off events.
These may include:
- Working capital shifts based on new supply chains or changes in customer behaviour.
- Integration costs linked to systems, people, and process harmonization.
- Divestitures or asset sales to fund operations or sharpen the business focus.
- Cash flow issues caused by system delays or supplier renegotiations.
To address this, Treasury should establish daily cash positioning routines utilizing state-of-the-art technologies and tools, escalation mechanisms, and strong collaboration with FP&A, procurement, and tax. Treasury shall also foster a “Cash First” mindset in the newly created organization. This ensures quick resolution of bottlenecks and reinforce cash flow discipline.
Strategic Liquidity Considerations for Long-Term Success
Cash and liquidity decisions taken during a carve-out will influence the new company’s financial flexibility as it takes quite some time and effort to implement changes in liquidity structures considerably at a later stage. Therefore, treasury should consider as early as possible the following aspects:
- Debt and credit rating impacts, especially if carve-out funding involves leverage.
- Treasury risk centralization (especially FX risk), to reduce cross-border inefficiencies and improve hedging performance.
- Tax and regulatory considerations, such as repatriation limitations, transfer pricing, and cash tax leakage.
- Strategic investment readiness, ensuring adequate liquidity for future M&A, CAPEX, or digital transformation.
The liquidity setup must be scalable, allowing the business to respond confidently to rapid growth, market volatility, or external shocks with resilient measures.
Zanders’ clearly sees a need for treasury functions to evolve into applying strategic enterprise liquidity models providing an efficient framework to link various stakeholders around the office of the CFO, including treasury, FP&A, risk management, accounting and more. A group-wide approach ensures alignment, cooperation and can lead to faster and more informed decision-making processes.
A Roadmap to Liquidity Maturity
The path to liquidity excellence starts with day 1 readiness preparation and implementation but extends far beyond. Treasury should approach this evolution through a structured roadmap that includes:
- Standardization of forecasting processes and technology tools.
- Centralization of liquidity governance, structures, and banking relationships.
- Continuous optimization of working capital, pooling structures, and investment of surplus funds.
- Measurement and benchmarking of liquidity KPIs and stress performance.
We bring a proven methodology and deep experience in day 1 planning and execution, as well as in post-M&A treasury transformation. We help clients design and implement cash and liquidity frameworks that deliver control, flexibility, and strategic value.
In the next edition of this series, we look at implementing effective banking strategy and funding practices within the newly carved-out entity, including key areas of focus and potential challenges.
Citations
- To learn more about this topic, read the whitepaper: Brace for AI-mpact: The six trends driving treasuries forward in 2025 - Zanders ↩︎

Ready to implement cash and liquidity management?
Contact us
Financial crime prevention (FCP) models play a critical role in protecting organizations from money laundering, fraud, and other illicit activities. The effectiveness depends on being able to adapt quickly as criminal tactics evolve.
Yet in many organizations, FCP models still follow the same rigid model validation (MV) process used for credit risk models, a process designed for stability, not agility.
While this ensures consistency, it leaves little room for the frequent updates these models desperately need. With regulators pushing for both effectiveness and compliance, and criminals moving faster than ever, the traditional approach is under pressure. Could generative AI, one of today’s most disruptive technologies, be the key to bridging the gap between strict validation requirements and the need for agility? Could it help us strike a better balance between speed, control, and cost?
The Current State of Model Validation in FCP
Currently, FCP model validation largely follows the framework used for credit risk models, but it faces several critical limitations:
- Manual, time-consuming and resource-intensive: Highly skilled validators must carefully review documentation, code, data pipelines, and monitoring outputs. Currently, it can take two people 6-8 weeks to complete a single validation, leaving them with little capacity to handle additional validations in parallel. In the time it takes to complete a validation, new criminal patterns may already be emerging which require updates or the development of a new model. In addition, delays in feedback between the validation team and developers could further extend the overall timeline.
- Costly: Compliance already consume significant budgets, and under cost-cutting pressures, it becomes increasingly difficult to justify allocating large teams to a single validation.
- Inflexible: Current validation approaches, built around credit risk frameworks, are primarily designed to safeguard capital adequacy. While effective for that purpose, they are not structured to keep up with the fast-moving and evolving patterns of financial crime.
- Capacity constraints: Given the size of most financial crime model portfolios and the frequency of validations required by internal policies, current resources are unlikely to meet long-term expectations. With model inventories expected to grow, this gap will only widen unless capacity is increased.
These challenges highlight a pressing reality: the current validation approach is no longer sustainable. Without significant improvements, organizations risk falling behind with both regulatory expectations and the fast-moving tactics of financial criminals.
Where Can GenAI Make the Biggest Impact in Validation?
In most organizations, models are assessed based on risk, complexity, and probability of failure. This tiered approach helps determine where automation, such as GenAI, can be applied most effectively.:
- High-risk, complex models – Models that are mathematically sophisticated, critical to operations or compliance, and have a higher probability of failure require thorough human validation and expert judgment due to their complexity and potential impact. Therefore, they are not well-suited for GenAI-based validation.
- Low-risk, simpler models – Models that are less mathematically complex, more standardized, and have a lower probability of failure. These are ideal candidates for GenAI, which can handle repetitive validation tasks, review documentation, and generate draft reports.
With GenAI taking care of routine checks on simpler models, human experts can dedicate their time and judgment to the models that truly require deep expertise.
The Role of AI in Financial Crime Model Validation
In practice, how can AI be applied to support model validation? At its core, AI is best suited to take on the repetitive and manual aspects of the process, the tasks that consume valuable time but add little judgment-based value. Instead of replacing experts, AI acts as an efficiency enabler – a “second pair of eyes” that enhances consistency, speeds up routine checks, and leaves human validators free to focus on areas where their expertise is irreplaceable.
Generative AI opens new possibilities for how validation might be approached, with AI driving the validation steps. Instead of starting from scratch, it could make it possible to ingest large volumes of model documentation and generate draft answers to validation questions which are informed by guidance documents, policies, and historical validation reports. It may also be possible to highlight areas that need further clarification, suggesting relevant follow-up questions for discussions between validators and model developers. Where responses are already sufficient, GenAI could enable the automatic closure of open points, keeping the process moving smoothly. Beyond Q&A, it creates the possibility of drafting validation findings based on prior patterns and even producing structured, section-by-section draft validation reports, giving validators a strong foundation to build on, rather than a blank page to start with. Final review and submission are always completed by the validator.
This shift highlights a clear evolution in validation practices. Currently, validation is often characterized by long checklists, manual document reviews, and labor-intensive report writing. With AI support, validation can become faster, more consistent, and highly scalable, allowing humans to focus on important aspects such as judgment, oversight, and final decision-making. With routine and repetitive tasks automated and accelerated through AI, and waiting times between interactions significantly reduced, validators could manage multiple validations in parallel. For model developers, this also means less time spent waiting on feedback, and therefore model developers can drive the speed of validation by submitting evidence faster. In short, AI doesn’t diminish the role of the validator – it elevates it, ensuring their expertise is applied where it delivers the most value. AI will transition the validator from an executor to a supervising role.
How would this Technically Work?
The goal is to create a simple, working version of the idea that shows how GenAI can support validators by automating repetitive steps while keeping humans in full control. It’s not about replacing expertise but about giving validators a smart assistant that can read complex documentation, provide the right information, and draft initial outputs they can refine.
At the center of this setup is an agentic framework built around two main parts: a Retrieval-Augmented Generation (RAG) system and a prompt creation engine. The RAG system helps the AI pull the most relevant content from internal guidance, policies, and historical validation reports. The prompt engine then turns that information into focused, context-aware prompts, so the AI can generate accurate, useful drafts. Everything runs securely in the organization’s existing cloud environment (for example, in Vertex AI on GCP) to make sure data stays protected and traceable.
The process could look like this:
- The model developer submits documentation, and the AI reviews it to identify relevant guidance and validation standards.
- It drafts initial responses to validation questions, giving the validator something concrete to start from instead of a blank page.
- If information is missing or unclear, the AI compiles structured follow-up questions that the validator can check and send back to the developer.
- When new evidence comes in, the AI reviews it, links it to the open items, and flags what can be closed or what still needs attention.
- Finally, it pulls everything together into a draft validation report with structured sections and proposed findings, ready for the validator to review and finalize.
In this target setup, the AI tool sits between the model developer and the validator. It manages the flow of documents and questions, keeps track of progress, and helps draft findings and reports. Validators remain in charge of every decision but can move through the process much faster and with more consistency. Developers, in turn, get clearer feedback and shorter waiting times.
The outcome is a smoother, more efficient collaboration where AI takes care of the manual groundwork, and humans focus on judgment and oversight, the parts that really matter.
Balancing Benefits and Risks
The potential of AI in model validation is not just theoretical; it comes with tangible benefits. First and foremost is efficiency: automation can significantly reduce the time spent on repetitive validation tasks, freeing experts to focus on higher-value activities. With a basic introduction of AI into the validation process, teams can achieve time savings of around 30%. When introducing a more advanced option, we believe an estimated time saving of up to 80% can be achieved. This naturally translates into cost savings, as the overall validation burden is lowered without compromising quality or increasing headcount. AI also promotes consistency and transparency, applying the same standards uniformly across models. Finally, it offers scalability as organizations can handle a larger portfolio of models without needing to increase headcount, a crucial advantage given current cost-cutting pressure.
As with any innovation, AI in model validation comes with significant risks that must be managed. Generative AI itself carries model risk, including bias, opacity, or “black box” behavior, which could undermine confidence if not carefully controlled. Additional concerns include autonomy risk, where AI might generate outputs without sufficient human guidance, leading to decisions that may be inappropriate or misaligned with validation standards; hallucination risk, where it produces information that seems plausible but is factually incorrect, which could mislead validators if not carefully checked; and incompleteness risk, where AI may overlook parts of a model or validation requirement, resulting in partial or insufficient coverage.
These risks can be managed by humans actively supervising AI and regularly reviewing its outputs. Mistakes are far less likely when experts double-check results, make sure nothing is missing, ensure all information provided is accurate, and stay in control of key decisions. Regulatory acceptance is also a consideration, as supervisors are likely to scrutinize the role of AI and require organizations to explain and justify its use. Finally, careful implementation prevents over-reliance on automation, ensuring human validators remain central to decisions where judgment is essential.
When implemented with care and proper oversight, AI can bring significant benefits to model validation. By combining AI’s capabilities with human judgment, organizations can work more efficiently, handle greater scale, and reduce costs, all while maintaining the trust and rigor that model validation requires.
Our FCP expertise:
Zanders brings a unique combination of expertise in both traditional and AI-driven model validation, helping to navigate the evolving landscape of financial crime model oversight. As a trusted advisor in risk, treasury and finance, Zanders combines deep regulatory knowledge with practical experience, ensuring that solutions are not only innovative but also fully compliant. More importantly, Zanders focuses on pragmatic, regulator-ready designs that bridge cutting-edge technology with compliance requirements. Zanders helps organizations work more efficiently while still meeting the high standards of rigor and trust that regulators expect.
Conclusion
In this FCP series, we have explored bias and fairness, explainability, and model and data drift. Each represents a vital aspect of building models that are not only powerful, but also responsible. Together, they remind us that the real challenge is not just creating models that work, but creating models that we can trust, understand, and sustain over time.
This is what makes AI-enabled model validation a natural next step. As models become more complex, risks evolve faster, and regulatory expectations increase. Organizations need human experts to focus on the areas where their judgment and oversight have the greatest impact, while AI handles the routine tasks.
As we conclude this series, the message is clear:
Organizations that embrace GenAI in their validation processes are not just improving efficiency, but they are shaping the future of model risk management.

AI for financial crime prevention
Get in touch to put GenAI into practice for your model validation process.
Contact us
Does your treasury team feel like you invested in a “Formula 1” TMS but its tires have been flat for a while? Then it is time for a pit stop.
Treasury organizations should periodically review their technology landscape and solutions. The right data foundations, system integrations and top-notch analytics can provide immense business value through better insights, cost savings, workflow automation, and productivity gains.
To obtain these benefits, it is necessary to re-assess how your Quantum setup fits your business requirements, evaluate the newest features introduced in quarterly Quantum releases, and define an implementation roadmap after conducting a cost-benefit analysis.
With AI becoming increasingly accessible and more widely integrated into enterprise applications, the opportunities are greater than ever.
Your pit stop with Zanders: Quantum Health Check
At Zanders, our Quantum Health Check is designed to give you a clear, fact-based view of how your treasury system is performing today and where there’s room to grow, considering how your company and treasury organization evolved over the years. Our goal is to ensure that you can drive Quantum like a proper F1 car, benefit from its newest features, and leverage the opportunities related to such technologies as APIs, oData, EWF, dashboards, data warehouses/lakes, BI tools or (Gen)AI.
How do we do it? Each health check is tailored to your specific scope – we listen closely to your priorities and then bring our ideas and suggestions to the table. We dive deep into your Quantum setup and the surrounding solutions – reviewing configuration, data flows, system integrations, reporting, controls, and daily processes – using proven checklists and targeted workshops and interviews.
In less than a month, at the end of the review, we present to you and discuss an easy-to-understand assessment report with a practical action plan and a tailored roadmap, highlighting quick wins and longer-term improvements. Our approach ensures you have the insights needed to stabilize operations, address risks, and unlock new value from Quantum, all while keeping the process smooth and efficient for your treasury team.
TreasuryIQ: AI as Your Pit Crew and Co-Driver
Taking your Quantum Health Check to another level, Zanders seamlessly integrates our proprietary AI platform called TreasuryIQ and our cutting-edge AI services to deliver tangible innovation and value. With an option of involving a dedicated AI engineer throughout the process, clients gain access to hands-on (Gen)AI knowledge, people with experience of implementing AI use cases, and workshops that transform conceptual AI into practical, treasury-specific applications.
Imagine taking your TMS to the next level like swapping out a standard engine for a turbocharged hybrid, engineered for tomorrow’s demands. Our “TreasuryIQ Assistant” acts as your instant expert co-pilot, accelerating user support and insight. Our agentic solutions such as “TreasuryIQ Tester” ensure your workflows are not just automated but intelligently optimized. And specialized solutions such as “Transfer Pricing Suite” show you concrete examples of how AI can fit into your treasury technology picture.
What truly sets Zanders apart is our commitment to co-innovation: after the Health Check, we partner with you to pilot and scale new treasury AI solutions, empowering your team to reimagine what’s possible. With Zanders and TreasuryIQ, your treasury technology isn’t just race-ready – it’s rewriting the rules of the track.

Ready to take the next step?
If any of these questions sound familiar, reach out to us — we’re here to help you get the most from your Quantum investment.
Contact us

As Transfer Pricing compliance becomes increasingly important, discover how treasury can streamline UAE loan pricing with the right tools.
Until recently, most UAE corporate entities were not subject to corporate income tax. This changed with the Ministry of Finance’s announcement on 31 January 2022, introducing a federal corporate tax regime applicable to financial years starting on or after 1 June 2023. The new regime also formalised the UAE’s transfer pricing framework as part of its commitment to the OECD BEPS standards.
Federal Decree-Law No. 47 of 2022 sets out the corporate tax rules and embeds transfer pricing requirements under Articles 34–36 and 55. In addition to the Federal Decree-Law No. 47, the UAE’s Ministry of Finance and Federal Tax Authority also issued additional rules and guidance specific to transfer pricing:
- Ministerial Decision No. 97 of 2023 – Sets out the conditions for the preparation of Master Files and Local Files in line with OECD BEPS Action 13.
- UAE Transfer Pricing Guide – Detailed guidance on the practical impact and implementation of transfer pricing regulations. The guide was prepared in alignment with the OECD’s Transfer Pricing Guidelines.
The incorporation of these rules, together with the growing attention from tax authorities on the Transfer Pricing of Intra-Group Loans, has significantly increased the focus of tax and treasury teams on the importance of transfer pricing in the region.
Importance for treasury teams
Over two years on from the UAE’s adoption of a formal corporate income tax regime, the region has positioned itself as a potential financial hub for multinationals to set up their centralised group finance and treasury functions. The UAE’s economic reforms and growing alignment with international financial standards further strengthen its case as a pragmatic and effective financial hub.
Multinationals are increasingly looking towards centralised, in-house financing functions to more effectively navigate variables between markets such as regulatory requirements, currency exposures, and broader liquidity and cash flow targets.
As more multinationals set up financing hubs in the UAE, scrutiny from the Federal Tax Authority will increase accordingly, particularly with a legitimate transfer pricing regime now in place. This means that both treasury teams and tax departments need to price intra-group loans on an arm’s length basis.
Alignment with the OECD TP Guidelines
The UAE follows the OECD TP Guidelines Chapter X for the transfer pricing of intra-group financial transactions, with additional local guidance provided in section 7.1.3.2 of the UAE Transfer Pricing Guide. Intercompany loans must reflect arm’s length terms, including loan amount, maturity, repayment terms, and arm’s length interest rates.
In practice, a 4-step process should be followed to comply with these requirements:

Step 1: As a first step, the terms and conditions should be reviewed to ensure their commercial rationale and that they reflect the actual economic reality of the parties. In this sense, special consideration should be given to the loan amount and whether an independent party would extend such an amount to the borrower. To this end, the so-called Debt Capacity Analyses are performed.
Step 2: As a second step, a credit rating analysis should be performed. While the recommended approach is to follow a bottom-up approach, based on the standalone credit rating of the entity adjusted for group support, in some cases a more simplified top-down credit rating approach can also be considered acceptable.
Step 3: As a third step, the pricing analysis is performed, typically by application of the external CUP method, identifying comparable third-party transactions with similar characteristics. Of course, the necessary comparability adjustments should be performed to reflect the differences between the external comparables and the loan under analysis.
Step 4: Finally, the analysis should be documented in a Transfer Pricing Report, explaining in a transparent manner the analysis performed in the previous steps. It is important to have legal documentation in place, reflecting the terms and conditions of the loan that have been considered during the analysis.
Interest limitation rules:
Alongside traditional transfer pricing regulations, the UAE also enacted interest deductibility rules in Article 30 of the Ministerial Decision No. 120 of 2023. The provisions are broadly modelled after the OECD’s BEPS Action 4. These interest limitation rules should be considered alongside transfer pricing regulations. In principle, net interest expense in the UAE is deductible only up to 30% of the borrower’s adjusted EBITDA. This rule only applies to cumulative interest expense greater than AED 12 million in a given year.
Article 28(1)(b) provides further rules that should apply specifically to intercompany arrangements. In addition to the foundational rule, any intercompany interest expense is non-deductible if:
- The financial arrangement lacks economic substance or commercial purpose; and
- The lender is not subject to a corporate tax rate of more than 9%; and
- The main purpose or one of the main purposes of the loan was to obtain a tax advantage.
Each of these must be proven for any interest deductions to be denied. These rules function to mitigate intergroup profit shifting and hybrid arrangements.
Zanders Transfer Pricing Software as a tool:
As tax authorities intensify their scrutiny, it is essential for companies to carefully adhere to the recommendations outlined above.
Does this mean additional time and resources are required? Not necessarily. Technology provides an opportunity to minimize compliance risks while freeing up valuable time and resources. The Zanders Transfer Pricing Software is an innovative, cloud-based solution designed to automate the transfer pricing compliance of financial transactions.
With over eight years of experience and trusted by more than 90 multinational corporations, our platform is the market-leading solution for intra-group loans, guarantees, and cash pool transactions.
Our clients trust us because we provide:
- Transparent and high-quality embedded intercompany rating models.
- A pricing model based on an automated search for comparable transactions.
- Automatically generated, 40-page OECD-compliant Transfer Pricing reports.
- Debt capacity analyses to support the quantum of debt.
- Legal documentation aligned with the Transfer Pricing analysis.
- Benchmark rates, sovereign spreads, and bond data included in the subscription.
- Expert support from our Transfer Pricing specialists.
- Quick and easy onboarding—completed within a day!
If you are interested in exploring how the Transfer Pricing Software could optimize your transfer pricing processes for financial arrangements, let us know in the contact form below.

Book a demo
Contact us
Zanders partners with Kantox on the latest in hedge accounting software to tackle the challenge of net income variability with full technical support and expert help.
The Challenge
The challenge is well known. Accounting conventions treat derivatives differently from commercial transactions. As a result, even when exposures are perfectly hedged, unrealised FX gains and losses on derivatives can create unwanted swings in net income. The fix is hedge accounting under IFRS and local GAAP—but designing policies, running effectiveness tests, documenting relationships, and producing audit-ready reports can stretch finance teams.
The Solution
Kantox Hedge Accounting Powered by Zanders automates this end to end. The software solution integrates out of the box with Kantox Dynamic Hedging, giving companies a true, end-to-end currency management automation setup that connects risk management and accounting seamlessly.
The benefits are immediate. Companies reduce operational cost and risk versus manual implementation, gain full technical and audit support, and remove net income variability stemming from unrealised FX gains and losses. Finance teams get consistent, audit-ready outputs while freeing resources to focus on higher-value activities.
Zanders & Kantox
Zanders brings deep expertise to the workflow. With more than 400 consultants, 12 offices across 4 continents, and 750+ customers, Zanders is a recognised authority in automated hedge accounting. Teams receive the level of support they need—from day-to-day assistance to premium, customised advisory—to draft hedge accounting policies, address country-specific audit requirements, and keep pace with evolving standards without building costly in-house capabilities.
By combining automation from Kantox with Zanders’ specialist guidance, organizations can implement hedge accounting with confidence—and finally align their FX risk management with their financial reporting.
Learn More
Find out about the full range of features and capabilities and watch the video on the Kantox website.
Interested in Kantox Hedge Accounting? Contact us to learn how to implement it quickly and smoothly.
Contact us
Get in touch to learn more about Kantox Hedge Accounting software and how Zanders can help.
Contact us

