Artificial intelligence (AI) has rapidly emerged as one of the most transformative technologies of the 21st century, revolutionizing everything – from healthcare and transportation to finance and entertainment.
Late last year, ChatGPT emerged online as the next phase in this fast-growing and exciting technological space. Many of us tried it out already, and I have yet to meet anyone who is not left amazed by its capacity in such an infant stage. Where to from here though? And how will this type of technology interweave with the systems we use today, such as SAP?
Artificial Intelligence versus Machine Learning
Anyone familiar with the functionalities of SAP is aware of its intelligent ’machine learning’ capabilities. This system looks for patterns in the user’s behavior and creates recommendations and shortcuts to optimize the experience and relieve labour-intensive and repetitive clearing processes. Artificial Intelligence, however, would revolutionize the experience entirely. For example, Microsoft is currently developing AI integrated with Excel which will negate the requirement for users to remember different formulas or spend hours putting together various graphs. Soon, it will be possible to input a request to the application; it will know where to source data from and will create the analysis automatically.
If we were to translate this to SAP, we could be looking at a world where T-Codes are no longer needed and where the user can ask the system a question or request a task to be performed. For example, instead of going about creating an invoice or needing to explain to management why a forecast isn’t aligned, we can ask the system to do it for us. Answering the questions will become more efficient, if the right questions are asked…
The future of analysis and development
Technologies like ChatGPT and future AI systems are set to transform the typical workflow of treasury professionals as well as wider business analysis across the world. Predictive analysis will allow businesses to make even more informed and intelligent decisions through improved models. While SAP already utilizes data upload from market sources such as Reuters and Bloomberg, we can expect to see a more intelligent system providing users with risk models, investment recommendations and better-informed risk models.
These help treasurers and companies at large make more accurate and strategic decisions regarding cash management and borrowing. There’s also less capacity for error through the assistance of AI; treasurers will be able to utilize automated next level financial reporting tools, saving organizations time and also ensuring regulatory requirements are abided by. Finally, treasurers will get to work with greater cash management optimization, a fundamental part of their roles; allowing businesses to keep borrowing to a minimum and ensuring cash is available when its needed.
A better experience for clients
This additional reduction in repetitive tasks will provide more time for solving complex tasks and establishing better relationships with clients. It should also provide the space for more innovative and expanded analysis. The social experience between consultants and clients will also become even more important; whereas computers will explain things very directly, the empathetic and open-minded consultant will be able to provide solutions in a manner that will be easier to digest. Trust in new technology, particularly among the ever-prudent treasury community, will also remain pivotal. It’s hard to foresee a future where a Head of Treasury will take a response from a computer that they do not agree with and just move on.
Where are we right now with ChatGPT and SAP?
It is without a doubt that the future of treasury technology and SAP in particular is exciting. It will be up to the leaders of organizations to work collaboratively with consultants to ensure such benefits afforded by advancements in AI will be taken advantage of.
For now, though, we are still in the infant stages of what is an exponentially growing piece of tech. The limitations of ChatGPT and its potential for collaboration with SAP focus on privacy and trust. OpenAI is quite open (excuse the pun) about the fact that one should not enter delicate data into the system as it cannot guarantee that such information’s integrity and privacy can be maintained. Furthermore, it is based on the data from the internet of 2021 – so therefore, it is somewhat out of date.
This is a developing story, not a settled one. The future has not happened, rather it is happening and as many are saying: We will not be replaced by AI – we will be replaced by those that embrace AI.


How should corporate treasury business stakeholders and project owners deal with the transitions of SAP Treasury as their treasury management system (TMS) and its surrounding treasury interfaces and solutions?
This article may help SAP system owners re-think or change their approach towards bespoke custom solutions in the system.
Over the past 14 years, my colleagues and I have dealt with five types of SAP Treasury transitions:
- From fully custom/in-house coded TMS to SAP TMS.
- From an outdated version of SAP to a newer version of SAP (for example: ECC to S/4HANA).
- From an outdated version of non-SAP TMS to SAP S/4HANA
- A split of the existing SAP TMS system into two SAP TMS, due to the business carve out.
- A merge of SAP TMS system with the main SAP ERP system.
Any type of transition has its own specific focus points during the project’s design phase. Almost every project’s primary goal is to enhance the TMS functionality; improve the user experience using a better level of business process automation and improve the security level of TMS.
Meeting business needs
Often Corporate Treasury requires support and expertise in designing the future business process and how the SAP Treasury system and architecture can meet business needs. One of the biggest challenges here is to find a trade-off between the different business requirements and the standard capabilities of SAP and its interfaces.
One of the main drivers of the custom requirements is hidden in the existing user experience. The end users/stakeholders got used to the old TMS functionality and behaviour, which is not the same in the new SAP system.
An experienced and independent consultant would first recommend leveraging the TMS standard functionality and proposing solutions to meet the business requirements with minimum custom functionality. In this case, the consultants often run TMS DEMO sessions in the new SAP Treasury; pre-configure the TMS and provide proof-of–concept solutions to provide evidence of certain complex functionality that can be aligned with standards.
Why is standard functionality important?
There are six reasons why we think the standard functionality is so important:
- It is supplied out–of–the–box and pre-designed by the system provider. Consequently, less time is needed to design the business process compared to design bespoke solutions.
- It is used by other clients and the system provider already analyzed the user experience of the solution. Hence, there is a higher level of quality assurance.
- SAP supports its own products and any enhancement of the TMS must be done by the system provider with minimum regression impact (impact on the current and working functionality).
- A client can raise SAP expertise internally or hire an external consultant to support the known functionality. There is no dependency on the knowledge of custom functionality.
- It provides easier business process standardization and scaling among different countries/regions.
- It helps to find treasury employees with known SAP Treasury experience, the knowledge can be taken from the market.
Nevertheless, it is quite hard to drop custom bespoke solutions; sometimes it must be applied in the design and implemented for the clients.
Sometimes custom solutions are needed
There are some reasons to implement custom solutions in a treasury system’s architecture:
- Strict and complex client requirements which cannot be met by standard functionality. There is no workaround in the standard. The most common example is cut-off time logic for POBO payments or calculation of internal FX rate types, among others.
- Standard functionality is not yet released to clients. However, it is crucial for a client to get it as soon as possible.
- Custom SAP functionality is already in place but needs to be enhanced.
Recommendations for the custom solutions
If a custom solution is inevitable, we have a couple of best practices.
Firstly, avoid the hardcoding of multiple conditions in the ABAP code. Instead, move the maintenance of the conditions to either custom or standard tables which can be supported by functional SAP support personnel or even by business users. Once a minor change in the conditions is needed there will be no need for a developer.
Secondly, leverage the use of SAP functional modules, programs, BAPIs and BADI etc. This makes the custom code more stable and leaves it less exposed to regression risks during the next system upgrade.
Also, avoid replacing significant pieces of the standard functionality with custom-developed ones which do not bring significant improvements. Supporting such SAP TMS becomes complex and expensive.
To conclude
We recommend that you minimize the volume of the custom solutions during TMS systems implementation. A good balance should be found between business requirements versus SAP standard functionality.
SAP continuously improves its solutions in response to customer feedback, changes in financial standards, regulatory requirements, technology trends, etc. Therefore, it is important to conduct the TMS audit from time to time to see if old and custom functionality can be scrapped since there is standard functionality already available.
If you need an audit of your treasury systems, have challenges with custom solutions or need help with the system design, please feel free to approach us. We have extensive experience in enhancing treasury technology and improving treasury functions.


Sustainability poses risks and offers opportunities for the financial sector.
The Federal Council in Switzerland wants to make sure that the Swiss financial sector will play a leading role in sustainability. To help accomplish this, it published an action plan in December for the period 2022-2025. Furthermore, the Swiss supervisory authority FINMA issued additional guidance on how financial institutions need to account for sustainability in their strategy, governance, risk management and disclosure. In this article we provide an overview of recent developments in the area of sustainability in Switzerland that are relevant for Swiss financial institutions.
Key takeaways:
- In November 2022, a law was approved that requires all Swiss firms above a minimum size (hence including financial institutions) to disclose climate-related information in line with the recommendations from the Task Force for Climate-related Financial Disclosures (TCFD) as of 1 January 2024. This comes on top of the existing law that came into force on 1 January 2022, requiring all firms to disclose more broadly their management of risks to the environment, social engagement, employee interests, human rights and avoidance of corruption (for the first time as part of their annual disclosure over 2023).
- In January 2023, Swiss supervisory authority FINMA published additional guidance in which it highlights its expectation that banks and insurance companies in Switzerland proactively engage with the recent guidance and recommendations issued by the BCBS and IAIS. FINMA will intensify its supervision of the measures that institutions are taking to address climate risks and it will expand this to cover a larger number of institutions (current focus is on the largest institutions, those in FINMA categories 1 and 2). In November 2022, FINMA also published recommendations for improvements of disclosures about climate-related financial risks by category 1 and 2 institutions to satisfy existing climate-related disclosure rules, which came into effect on 1 July 2021.
- In December 2022, the Swiss Federal Council (‘Bundesrat’) published its action plan ‘Sustainable Finance in Switzerland – Areas for action for a leading sustainable financial centre 2022-2025’. The action plan contains 15 initiatives to improve the availability of comprehensive and comparable sustainability data for the full Swiss economy, enhance transparency in the financial sector with respect to climate and biodiversity risks, promote impact investments and green bonds, and support international initiatives for the pricing of environmental damage.
Disclosure requirements in line with the TCFD
From 1 January 2024, all firms above a minimum size1 are legally required to disclose climate-related information in line with the recommendations from the Task Force for Climate-related Financial Disclosures (TCFD) (see media release). An overview of the TCFD disclosure recommendations can be found in this separate article.
This law provides details on climate-related reporting requirements in relation to a law that entered into force on 1 January 20222. This earlier law requires firms to disclose their management of risks in relation to climate change and the environment, social engagement, employee interests, human rights and avoidance of corruption. Firms have to report on this for the first time as part of their annual disclosure over 2023, at the latest by end of June 2024. This law is based on, and in some aspects extends, the EU directive 2014/95 on Corporate Social Responsibility (CSR) reporting from 20143.In addition, this law requires firms that import and/or process minerals from conflict or high-risk regions as well as firms which offer products or services for which the use of child labour in its supply chain is likely, to establish and report on due-diligence measures that have been implemented to manage these risks in line with international agreements.
FINMA: Guidance with respect to the management of climate risks
FINMA issued additional guidance for the management of climate risks by banks and insurance companies in January 20234. This guidance follows the publication of documents by international supervisory bodies in the financial sector, specifically:
- ‘Application paper on the Supervision of Climate-related Risks in the Insurance Sector’ by the International Association of Insurance Supervisors (IAIS) in May 2021 (See IAIS)
- ‘Principles for the effective management and supervision of climate-related financial risks’ by the Basel Committee on Banking Supervision (BCBS) in June 2022 (See BCBS Principles and for a summary, see our recent article)
- ‘Frequently asked questions’ by the BCBS in December 2022 (See BCBS FAQ), intended to facilitate a globally uniform interpretation of the existing Pillar 1 standards in relation to climate risk5.
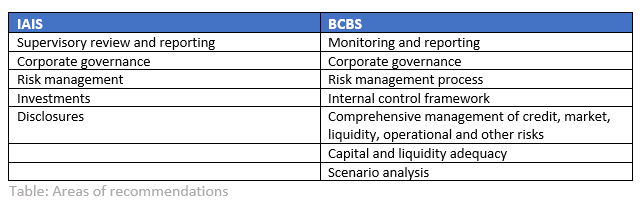
In the guidance, FINMA reiterates that climate risks in the form of transition, physical, legal and reputational risks should not be seen as separate risk categories, but as risk drivers for existing risk categories. It further emphasizes that banks and insurance companies are expected to implement the recommendations as contained in the above papers by the BCBS and IAIS. The areas of the recommendations are summarized in the table below.
In its supervision of climate-related risks, FINMA is currently focusing on the institutions in FINMA categories 1 (currently UBS and Credit Suisse, no insurance companies) and 2 (currently Raiffeisen, PostFinance and the Zürcher Kantonalbank (ZKB) as well as five insurance companies). FINMA is also gathering initial experiences with climate scenario analysis. Over time, FINMA intends to generally intensify its supervision of the measures that institutions are taking to address climate risks and it will expand this to cover a larger number of institutions.
Institutions in supervisory categories 1 and 2 were already subject to climate-related disclosure rules from FINMA as of 1 July 2021, as embedded in the disclosure circulars 2016/1 (for banks) and 2016/2 (for insurers). The required disclosure covers:
- The governance structure in place to identify, assess, measure and monitor climate-related financial risks
- The impact of climate-related financial risks on the business and risk strategy as well as on the existing risk categories in the short, medium and long term
- Risk management structures and processes to identify, assess and manage climate-related financial risks
- Quantitative information (metrics and targets) employed, including the measurement methodologies used
In November 2022, FINMA issued an evaluation of climate-related disclosures by these institutions in their 2021 annual reports against the disclosure rules. FINMA concludes that the institutions largely met the disclosure obligations but observes that it is still difficult for readers to get a clear picture about the effective relevance of climate-related financial risks for the individual institutions. According to FINMA, it proved difficult to find the specific disclosures on climate-related financial risks in the annual and/or other (e.g., sustainability) reports and it expects institutions to more clearly present this. Furthermore, FINMA suggests the following improvements:
- More specific information on how climate risk is managed as part of the overall governance structure. This should include internal reporting of climate-related financial risks, which FINMA views as a part of embedding them in the internal governance
- More detailed information on how climate-related risks impact the business and risk strategy, including the results of a materiality assessment and differentiation of short-, medium- and long-term impact
- More transparent information about the risk management structures and processes in place to identify, assess and manage climate-related financial risks
- Clarification of the connection between climate-related financial risks and the metrics and targets that are disclosed, and which (sub)portfolios are covered by the metrics
FINMA notes that the disclosures did not give sufficient transparency about the criteria and assessment methods by institutions to evaluate the materiality of climate-related financial risks.
Swiss Federal Council: Sustainable Finance Action plan 2022-20256
The Sustainable Finance Action plan 2022-2025 of the Swiss Federal Council (“Bundesrat”) is written against the background of fulfilling the 17 UN Sustainable Development Goals (SDGs) by 2030. However, the focus is on risks and opportunities in relation to the mitigation of climate change in line with the Paris Agreement and of biodiversity loss. The action plan consists of 15 measures in four main areas:
A: Sustainability data from all sectors of the economy
B: Transparency in the financial sector
C: Impact investments and green bonds
D: Pricing of environmental damage
An overview of the individual actions, grouped by main area, is shown in the following chart.
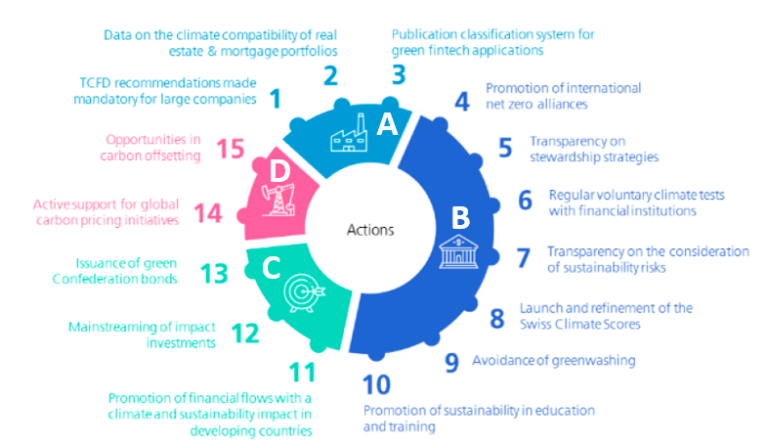
Source: Swiss Federal Council, Sustainable Finance in Switzerland – Areas for action for a leading sustainable financial centre, 2022–2025, 16 December 2022 (media release)
Below we summarize each of the 15 actions on which the Swiss government will focus, following the numbering in the graph above. Some of the actions will benefit investors and involve additional effort from financial institutions (such as those leading to additional rules or disclosure requirements in actions 1, 5, 7, 8 and 9) while others aim to benefit financial institutions (such as actions 2, 3 and 10). Some actions will affect or benefit society at large (actions 6 and 11 to 15).
A – Sustainability data from all sectors of the economy
1. This action corresponds to the law with climate-related financial disclosure requirements according to the TCFD recommendations, which we described earlier in this article. In addition, the Federal Council will continue to follow and participate in international discussions regarding biodiversity-related financial disclosures.
2. The Swiss government will increase the availability of data about the climate-friendliness of buildings in Switzerland (CO2 emissions, energy efficiency and alignment with the Swiss climate goals) in the Gebäude- und Wohnungsregister (GWR)
3. Support the introduction of a green fintech classification system (see website), which can help existing players in the Swiss financial sector to obtain access to and/or process sustainability related data in a more efficient manner.
B- Transparency in the financial sector
4. The Swiss government encourages financial institutions to join international Net-Zero-Alliances. Furthermore, it collaborates in the international Climate Data Steering Committee (CDSC) to establish a database to create transparency about the commitment of reduction in greenhouse gas emissions of individual financial institutions.
5. In December 2022, the Federal Council recommended that financial institutions and pension funds publish information on how their client engagement strategy and the exercise of equity voting rights aligns with the own net-zero strategy.
6. The government will continue to conduct regular, voluntary climate tests of the financial sector, to provide transparency how the financial sector as a whole aligns with achieving the goals of the Paris agreement (results of the 2022 test can be found on this website).
7. Already in 2020, the Federal Council recommended that financial institutions publish the methods and strategies employed for taking account of climate and environmental risks when managing clients’ assets, in accordance with the existing legal duties of loyalty and due diligence.
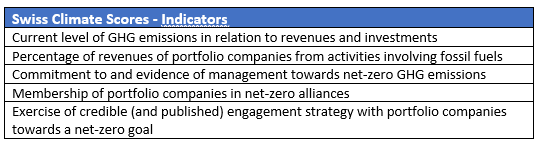
8. In June 2022, the Federal Council recommended that financial institutions use comparable and meaningful information about alignment of financial investments and client portfolios with global (net-zero) climate goals. To support this, it introduced the ‘Swiss Climate Scores’ (see Climate Scores website). These Swiss Climate Scores comprise indicators for both the current and prospective alignment with global (net-zero) climate goals, which are summarized in the table below.
9. Establish rules to avoid greenwashing of financial products and services, ensuring that products and services that are labeled as sustainable are aligned with, or contribute to the achievement of at least one specific sustainability goal.
10. Promote sustainable finance education
C. Impact investments and green bonds
11. Promote impact investments in developing countries, for example by establishing the ‘Sustainable Development Goals (SDG) Impact Finance initiative’ in 2021 and the goals of the ‘Swiss Investment Fund for Emerging Markets (SIFEM) 2021-2024’.
12. Examine, in collaboration with the industry and FINMA, how financial market legislation can be amended to promote the expansion of impact investments.
13. Issue green Swiss Confederation bonds.
D – Pricing of environmental damage
14. Active support of multi-lateral initiatives to establish an equitable global carbon price.
15. Investigate what role the federal government can play to exploit opportunities for the Swiss financial market in the area of CO2-compensation.
In conclusion
Pressure on firms in Switzerland is increasing to be more transparent on how climate and environmental risks are identified, assessed and managed as part of the regular course of business. Zanders has supported various financial institutions on climate and environmental risk-related topics in the EU as they need to adhere to detailed expectations from the European Central Bank (ECB) and the European Union (EU). If you want to learn more, please contact us or call at +41 44 577 70 10.
Footnotes
[1] At least 500 FTE and a balance sheet total of at least CHF 20 million and/or revenues of at least CHF 40 million on a consolidated basis
[2] See media release.
[3] Within the EU, this is generally referred to as the Non-Financial Reporting Directive (NFRD). On 5 January 2023 the Corporate Sustainability Reporting Directive (CSRD) entered into force, succeeding the NFRD (details can be found here). The CSRD extends the scope of the companies covered to all large and all listed companies, requires the audit (assurance) of reported information and strengthens the standardisation of reported information by empowering the Commission to adopt sustainability reporting standards.
[5] The EBA published a discussion paper on the inclusion of environmental risks in Pillar 1 capital requirements, see EBA and for a summary EBA summary https://zandersgroup.com/en/latest-insights/are-climate-change-risks-properly-captured-in-the-prudential-framework/.
[6] See media release

The recommendations for the disclosure of climate-related financial information by the Task Force for Climate-related Financial Disclosures (TCFD), published in 2017, have become the de-facto disclosure standards world-wide.
An increasing number of policy makers and regulators have embedded the recommendations in industry guidance and laws. In this article we summarize the TCFD recommendations, taking into account the additional guidance that has been provided by the TCFD since the original recommendations were published.
Key takeaway:We recommend that firms begin collecting data and amend internal processes that enable them to disclose climate-related information in line with the recommendations of the Task Force for Climate-related Financial Disclosures (TCFD)
Background
The Task Force for Climate-related Financial Disclosures (TCFD) was established by the Financial Stability Board (FSB) in December 2015 to develop climate-related disclosures that “could promote more informed investment, credit [or lending], and insurance underwriting decisions” and, in turn, “would enable stakeholders to understand better the concentrations of carbon-related assets in the financial sector and the financial system’s exposures to climate-related risks.” The TCFD finalized its recommendations in June 20171 and, based on the subsequent experience, published implementation guidance in 20212.
In line with this goal, the recommendations and implementation guidance are intended for all financial and non-financial organizations with public debt or equity. However, the TCFD encourages all organizations to implement the recommendations. An increasing number of firms are doing so and indicate explicitly as part of their annual report or financial filing where they have disclosed information in relation to individual TCFD recommendations3.
Climate-related risks and opportunities
To be able to disclose relevant climate-related information, an organization first needs to understand its exposure to climate-related risks and the opportunities that the execution of the Paris Agreement offers. Hence, it needs to evaluate the potential negative impacts of climate change on its own operations and the full value chain (covering both physical and transition risks) as well as the opportunities it offers for new products, services and markets. Subsequently, the impact of the identified risks and opportunities on revenues, expenses, assets and liabilities, and capital and financing needs to be assessed. This is summarized in the following chart.
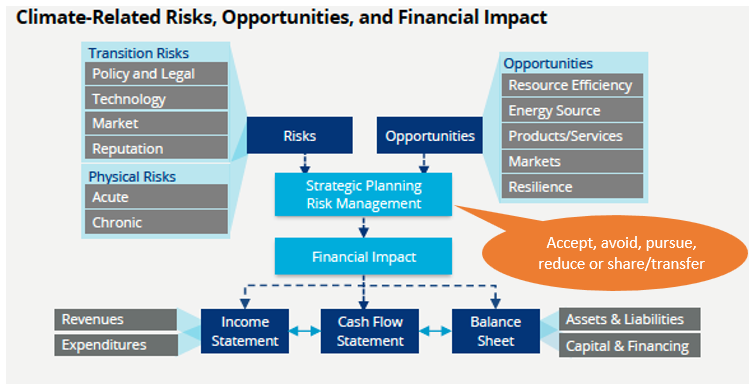
Source: TCFD, Implementing the Recommendations of the Task Force on Climate-related Financial Disclosures, October 2021, page 9.
Appendix 1 of the TCFD implementation guidance provides examples how climate-related risks and opportunities can impact the financial statements.
The TCFD Recommendations
The TCFD has issued 11 recommendations in four main areas: Governance, Strategy, Risk Management, and Metrics and Targets. These are summarized in the table below.
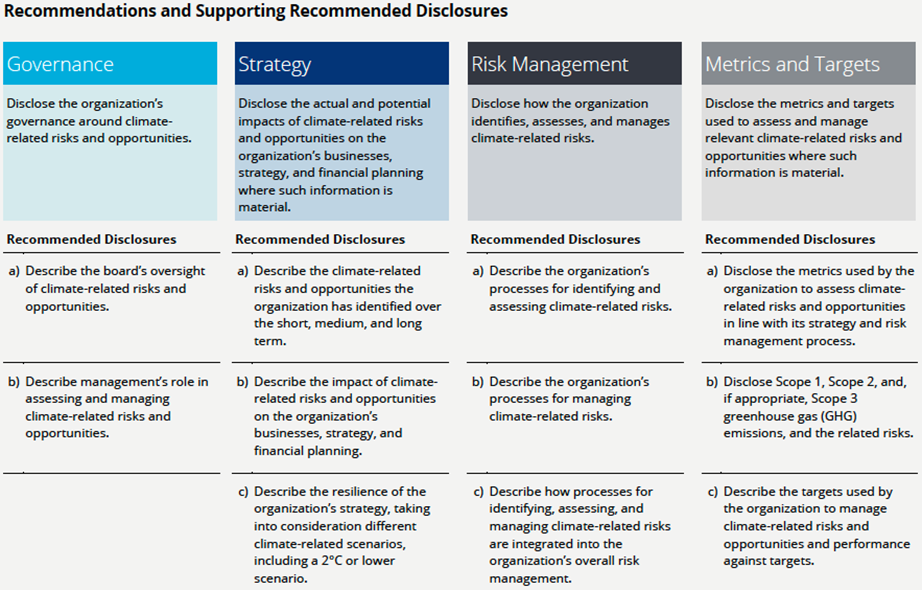
Source: TCFD, Implementing the Recommendations of the Task Force on Climate-related Financial Disclosures, October 2021, page 15.
For banks, insurance companies, asset owners, asset managers and non-financial industries that are more likely to be financially impacted by climate-related risks4, the TCFD provides additional guidance for some of the recommended disclosures.
For banks, the additional guidance entails:
- Describe significant concentrations of credit exposure to carbon-related assets through the lending and financial intermediary business (Strategy – sub a).
- Characterize their climate-related risks in the context of traditional banking industry risk categories such as credit risk, market risk, liquidity risk, and operational risk (Risk Management – sub a).
- Disclose GHG emissions for their lending and other financial intermediary business activities where data and methodologies allow, calculated in line with the Global GHG Accounting and Reporting Standard for the Financial Industry developed by the Partnership for Carbon Accounting Financials (PCAF Standard) or a comparable methodology (Metrics and Targets – sub b).
Metrics and targets: Additional guidance
For the metrics, the TCFD provides the following suggestions for all organizations:
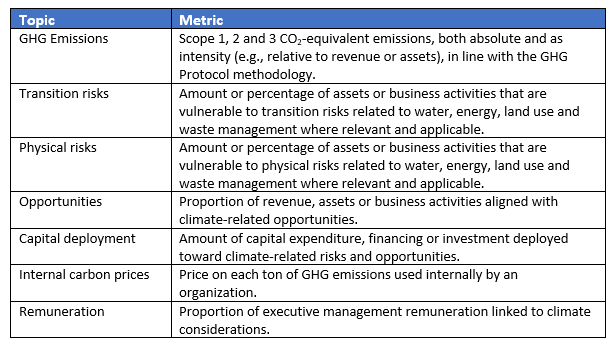
Targets can be established by specifying the planned reduction or increase in each of the metrics over a chosen time horizon, including a comparison to regulatory requirements, market constraints or other goals.
In conclusion
As the TCFD recommendations are increasingly used as basis for climate-related disclosure standards in national laws and regulatory guidance, firms are advised to start collecting data and amend internal processes that enable them to disclose climate-related information in line with these recommendations. Zanders has supported various financial institutions on climate-related topics that have a bearing on the TCFD disclosure recommendations. If you want to learn more, please do not hesitate to contact us or call at +41 44 577 70 10.
Footnotes
[1] TCFD, Recommendations of the Task Force on Climate-related Financial Disclosures, June 2017, see TCFD Recommendations
[2] TCFD, Implementing the Recommendations of the Task Force on Climate-related Financial Disclosures, October 2021, see TCFD Publications
[3] TCFD, 2022 Status Report, October 2022, see TCFD Publications
[4] Comprising the following sectors: energy, transportation, materials and buildings, and agriculture, food and forest products.
[5] TCFD, Guidance on Metrics, Targets and Transition Plans, October 2021, see TCFD Publications

Markets have been confronted with a sharp increase in interest rates over the last months, resulting in a material change in level and steepness of the yield curve.
Today’s interest rates are positive, the yield curve relatively flat and, in some currencies, even (slightly) inverse. The rise in interest rates poses a significant challenge for banks. This challenge involves managing the impact that rising rates have on the bank’s IRRBB key risk metrics as well as new EBA regulation related to supervisory outlier tests (SOTs) for IRRBB.
Banks’ economic values of equity (EVE) are most likely negatively affected by the rise in rates. The impact is dependent on the duration of equity taken by the bank; the higher the equity duration, the larger the decline in EVE when rates rise (and hence a higher EVE risk). On the other side, choosing a high equity duration would lock in consistent income over a longer period of time (lower earnings risk), whereas a low equity duration results in earnings fluctuating with market rates (high earnings risk). As a result, eliminating both EVE risk and earnings risk at the same time is hard to achieve. Selecting the appropriate equity duration (or more in detail, key rate durations) is a balancing act between acceptable levels of EVE risk versus earnings risk. This decision depends on the bank’s risk appetite, internal risk limits and regulatory limits (SOT limits). Finally, due to EBA’s introduction of the NII SOT (supervisory outlier test on earnings risk), banks will need to put more emphasis on earnings risk, by assessing the impact of mitigation measures on the size of earnings risk relative to capital.
Levers to consider
Since today’s rate environment is materially different from years past, banks should re-evaluate their ALM strategy and, in particular, actively manage residual interest rate risk going forward. For banks, the following levers are important to consider:
- Adapting the interest rate risk limit framework to the new reality. This includes an assessment whether or not it is necessary to amend the overall equity duration and corresponding key rate durations. Especially, the introduction of the NII SOT by EBA will incentivize banks to amend existing limits on earnings risk or set new ones. The preferred target equity duration and corresponding key rate duration profile will be the result of a study where the impact of alternative equity durations is assessed against the bank’s risk appetite, and EVE and earnings risk limits. Once decided, it will be necessary to [i] adapt the hedge (derivative overlay) according to the new equity duration and key rate duration profile set as targets and [ii] manage the overlay over time in such a way that the realized key rate duration profile remains within the limits set around the target key rate profile and equity duration. Since the risk limit framework is part of the broader ALM framework, the ALM framework could be subject to a review as well.
- Reassessing key behavioral assumptions in the banking book. Although behavioral models are reviewed periodically, banks should consider recalibrating the behavioral models, especially after a shift in paradigm from negative to positive interest rates. Since behavioral assumptions are used to forecast cashflows, they should be set in a forward looking way (possibly using an expert overlay) and thus reflect the new rate environment. In this way, banks will understand how their behavioral models for mortgage pre-payments and non-maturing deposits impact the IRRBB key metrics and resulting equity duration going forward. Amendments in behavioral models can alter the size and structure of a derivative overlay.
- Brushing up the product palette and reviewing the range of banking products. Banking products that have not been attractive in a low and/or negative interest rate environment during the past years could very well become more attractive again for clients in a different (high) interest rate environment. At certain interest rate levels and steepness of the yield curve, clients could favor floating rate over fixed term instruments, short-term over long-term instruments, or vice versa. Volume shifts between banking products can gradually alter the balance sheet composition over time and materially change the interest rate risk profile of the banking book. Therefore, banks should consider adapting their product palette (and corresponding price setting) to the new interest rate environment. Also, banks should consider offering alternative banking products to clients to be able to benefit from risk offsets between assets and liabilities. This can be done by e.g. refurbishing specific products that have been on the shelf for a while now.
- Managing the duration of the liquidity buffer portfolio (more) actively in conjunction with the desired interest rate risk profile set by the revised ALM strategy. Investments in bonds with maturities consistent with the ALM strategy can bring the equity duration closer to the desired level and reduce the size of a potential derivative overlay.
- Strengthening the risk system capabilities to be able to provide management the requested transparency in a timely manner. It requires scenario analyses to determine the impact of strategic ALM decisions on the key risk metrics, both internal and regulatory risk limits and SOTs as well as other balance sheet metrics (e.g. capital and capital ratios). Scenario analyses include the roll-over of the bank’s balance sheet and hedges for a certain period (e.g. 1-5 years) under various scenarios regarding market rate, client rate (commercial margins) and balance sheet assumptions.
How can Zanders support banks in meeting these challenges?
Zanders is a trusted advisor in helping banks review their ALM/hedge strategy. Drawing on expert knowledge in ALM, we help banks conduct strategic ALM studies and holistic balance sheet management assessments using our proprietary tooling. These typically include impact studies of:
- alternative hedges (derivative overlays);
- changes in key behavioral assumptions;
- changes in balance sheet composition or
- other possible measures to mitigate the residual interest rate risk.
Using our holistic approach, we provide transparency and support banks in understanding the impact on future EVE risk, earnings (NII) and earnings risk, as well as other key metrics such as capital ratios, leverage, liquidity and funding (LCR and NSFR) ratios under different scenarios.
Are you interested in Strategic ALM and Holistic Balance Sheet Management? Contact Jaap Karelse, Erik Vijlbrief (Netherlands, Belgium and Nordic countries) or Martijn Wycisk (DACH region) for more information.

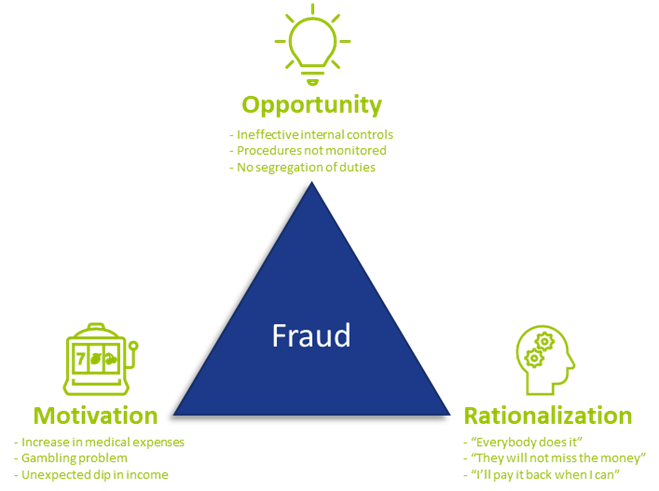
Financial institutions spend billions per year in their fight against fraud.
With every improvement, fraudsters look for and find new opportunities to exploit. When the opportunity arises, some people see a big incentive or pressure to commit fraud, and most will be able to justify to themselves why it is acceptable to commit fraud (as shown in the Fraud triangle – Figure 1). Unfortunately, the impact of fraud on organizations, individuals and society in general is substantial.
In a recent report by the Association of Certified Fraud Examiners (ACFE), Occupational Fraud 2022: A report to the nations, it is estimated that organizations lose about 5% of their revenue each year due to employees committing fraud against their employer. It is estimated that more than USD 4.7 trillion is lost worldwide to occupational fraud. Of these, most cases were identified through a tip to a hotline and most were not detected until 12 to 18 months later. The longer the fraud was undetected, the higher the loss. But organizations do not only fight fraud internally; external threats are also on the rise. As businesses evolve and processes are automated and digitalized, fraud activities become much more complex.
Data and modeling approach to fraud prevention
To effectively prevent fraud, it first needs to be identified. Traditionally, employees are trained to identify anomalies or inconsistencies in their daily work environment. It is still crucial that your employees know what to look for and how to spot suspicious activities. But due to the complexities and vast amounts of information available, and because fraudsters are becoming more sophisticated, it becomes much more difficult to determine whether a potential customer is a fraudster or a real client.
The good news is that digitalization and increased data availability provides the opportunity for data analytics. It is important to note here that it does not completely replace your current processes; it should be used in addition to your traditional prevention and/or detection methods to be more effective to proactively identify and prevent fraud in your organization.
Benefits of data analytics
Traditionally, sampling was done on a population to test for fraud instances, but this may not be as effective because it only looks at a small population. Because fraud numbers reported usually being small (but with a large monetary impact), it is possible to overlook valuable insights if only samples of populations are investigated. Ideally, all data should be included to identify trends and potential fraudulent activities, and with data analytics that is possible. By analyzing large amounts of data, organizations can identify patterns and trends that may indicate fraudulent activity. It can help to improve the accuracy of fraud detection systems, as they can be trained to recognize these patterns.
Data analytics can increase efficiency by reducing false positives and false negatives and assists organizations to automate parts of the fraud detection processes, which can save time and resources. This allows the business to focus on other important strategic objectives and tasks such as customer service and product development.
By using data analytics to identify and prevent fraudulent activity, organizations can help to protect their customers against financial losses and other harm. Customer trust and loyalty are built when organizations show they are serious about the welfare and safety of their customers.
Detecting and preventing fraud
Reality is that preventing fraud upfront or in an early stage is much more economical and beneficial than having to detect fraud after the fact, as investigations are time-consuming and the fraud is not always easy to proof in court. Moreover, by the time it is detected, a loss may have already been incurred. Using data analytics to identify fraudsters and fraudulent activities earlier, can protect the bottom line by reducing financial losses and improving the organization’s overall financial performance.
By using analytics to detect and prevent fraud, organizations can demonstrate to regulatory bodies that they are taking compliance seriously. Reporting suspicious transactions and activities to regulatory bodies is a key component of complying with anti-money laundering and counter-terrorism financing legislation, and analytics can assist with identifying these transactions and activities more effectively.
Data analytics can be used to prevent fraud at onboarding, detect it in the existing customer base, and to make your operational processes more efficient. More specifically, data analytics can be used and leveraged as follows:
- Identifying outlier trends and hidden patterns can highlight areas and/or transactions that are more vulnerable to fraud.
- Automating identification of exceptions removes manual intervention and makes the identification criteria more consistent.
- Traditional physical reviews using limited resources to investigate is time-consuming. Data analytics can be used to prioritize the ones with the highest impact and risk, e.g. investigate the suspicious transactions with the highest value first.
- Combining data from different data sources to feed into a model provides a more holistic view of a customer or scenario than looking at individual transactions or applications in isolation.
- Both structured and unstructured data can be used to prevent and detect fraud.
- Fraud propensity model scoring can run automatically and generate results to be reviewed and investigated in real-time or near real-time.
- Analyzing relationships between various entities and customers using Social Network Analysis (SNA). Traditionally, networks/links were identified by the investigator while building a case. By using analytics, less time is needed to identify these relationships. Also, it identifies valuable links previously unknown, as additional levels of relationships can be examined.
- Specific modus operandi identified by the organization’s internal fraud team can be translated into data models to automate identification of similar cases. (See Case study below)
- Applying a fraud model to the organization’s bad debt book can assist with your collections strategy. Fraudsters never intended to pay and focusing your collection efforts on them wastes time and valuable resources. Most efforts should be on those cases where money can be collected.
Case study
The Zanders data analytics team has experience with applying data analytics within a company to identify customers who create synthetic profiles at point of application. By working closely with investigators, a model was developed in which one out of every three applications referred for investigation was classified as fraudulent.
The benefit of introducing analytics was twofold – from an onboarding- and existing customer point of view. The number of fraudsters identified before onboarding increased, preventing (potential) losses. Using the positive identified frauds at point of application, and checking the profile against the existing book, helped to identify areas that were more vulnerable where investigation should be prioritized.
The project proved that:
- Data analytics is valuable and combining it with insights from the operational teams is powerful.
- The buy-in from the stakeholders made the model more effective. If the team investigating the alert does not trust the model or does not know what to look for, there will be resistance in investigating the alerts.
- Taking your internal fraud team on a data and analytics journey is a must. They need to understand the impact that their decisions and captured outcomes can have on future models.
- Challenges with false positives (within business appetite and investigation capacity) are a reality, but having a model is better than searching for a needle in a haystack. Learning from the results and outcomes of the investigations, even if they were false positives, will enhance your next model.
- One size does not fit all. Fraud models need to be tailored to the business’ needs.
Conclusion
While using data analytics to identify fraudulent activities is an investment, organizations need to outweigh the benefit of incorporating data analytics in their current processes against the potential losses. Fraud not only results in monetary losses, it can lead to reputational damage and have an impact on the organization’s market share as customers will not do business with an organization where they don’t feel protected. Your customers also expect great customer service and implementing proactive fraud prevention measures increases confidence in your organization.
How can Zanders help your organization?
Did you find this article helpful but do you still have questions or need additional assistance? Our team of experts is ready to assist you in finding the solutions you need. Please feel free to reach out to us to discuss your needs in more detail. Whether you’re looking for advice on a specific project or just need someone to exchange ideas with, we are here to assis

In turbulent markets, enhancing VaR models with volatility scaling can improve their responsiveness to market changes and reduce capital charges due to backtesting failures.
Challenges with VaR models in a turbulent market
With recent periods of market stress, including COVID-19 and the Russia-Ukraine conflict, banks are finding their VaR models under strain. A failure to adhere to VaR backtesting requirements can lead to pressure on balance sheets through higher capital requirements and interventions from the regulator.
VaR backtesting
VaR is integral to the capital requirements calculation and in ensuring a sufficient capital buffer to cover losses from adverse market conditions. The accuracy of VaR models is therefore tested stringently with VaR backtesting, comparing the model VaR to the observed hypothetical P&Ls. A VaR model with poor backtesting performance is penalised with the application of a capital multiplier, ensuring a conservative capital charge. The capital multiplier increases with the number of exceptions during the preceding 250 business days, as described in Table 1 below.

Table 1: Capital multipliers based on the number of backtesting exceptions.
The capital multiplier is applied to both the VaR and stressed VaR, as shown in equation 1 below, which can result in a significant impact on the market risk capital requirement when failures in VaR backtesting occur.


Pro-cyclicality of the backtesting framework
A known issue of VaR backtesting is pro-cyclicality in market risk. This problem was underscored at the beginning of the COVID-19 outbreak when multiple banks registered several VaR backtesting exceptions. This had a double impact on market risk capital requirements, with higher capital multipliers and an increase in VaR from higher market volatility. Consequently, regulators intervened to remove additional pressure on banks’ capital positions that would only exacerbate market volatility. The Federal Reserve excluded all backtesting exceptions between 6th – 27th March 2020, while the PRA allowed a proportional reduction in risks-not-in-VaR (RNIV) capital charge to offset the VaR increase. More recent market volatility however has not been excluded, putting pressure on banks’ VaR models during backtesting.
Historical simulation VaR model challenges
Banks typically use a historical simulation approach (HS VaR) for modeling VaR, due to its computational simplicity, non-normality assumption of returns and enhanced interpretability. Despite these advantages, the HS VaR model can be slow to react to changing markets conditions and can be limited by the scenario breadth. This means that the HS VaR model can fail to adequately cover risk from black swan events or rapid shifts in market regimes. These issues were highlighted by recent market events, including COVID-19, the Russia-Ukraine conflict, and the global surge in inflation in 2022. Due to this, many banks are looking at enriching their VaR models to better model dramatic changes in the market.
Enriching HS VaR models
Alternative VaR modeling approaches can be used to enrich HS VaR models, improving their response to changes in market volatility. Volatility scaling is a computationally efficient methodology which can resolve many of the shortcomings of HS VaR model, reducing backtesting failures.
Enhancing HS VaR with volatility scaling
The Volatility Scaling methodology is an extension of the HS VaR model that addresses the issue of inertia to market moves. Volatility scaling adjusts the returns for each time t by the volatility ratio σT/σt, where σt is the return volatility at time t and σT is the return volatility at the VaR calculation date. Volatility is calculated using a 30-day window, which more rapidly reacts to market moves than a typical 1Y VaR window, as illustrated in Figure 1. As the cost of underestimation is higher than overestimating VaR, a lower bound to the volatility ratio of 1 is applied. Volatility scaling is simple to implement and can enrich existing models with minimal additional computational overhead.
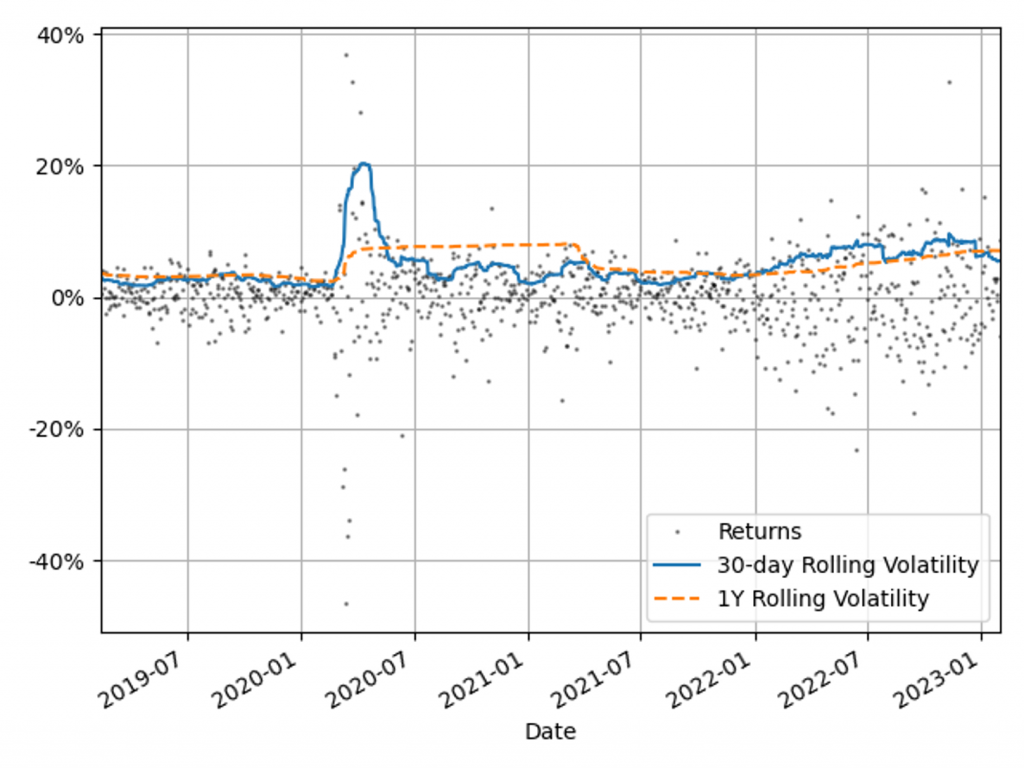
Figure 1: The 30-day and 1Y rolling volatilities of the 1-day scaled diversified portfolio returns. This illustrates recent market stresses, with short regions of extreme volatility (COVID-19) and longer systemic trends (Russia-Ukraine conflict and inflation).
Comparison with alternative VaR models
To benchmark the Volatility Scaling approach, we compare the VaR performance with the HS and the GARCH(1,1) parametric VaR models. The GARCH(1,1) model is configured for daily data and parameter calibration to increase sensitivity to market volatility. All models use the 99th percentile 1-day VaR scaled by a square root of 10. The effective calibration time horizon is one year, approximated by a VaR window of 260 business days. A one-week lag is included to account for operational issues that banks may have to load the most up-to-date market data into their risk models.
VaR benchmarking portfolios
To benchmark the VaR Models, their performance is evaluated on several portfolios that are sensitive to the equity, rates and credit asset classes. These portfolios include sensitivities to: S&P 500 (Equity), US Treasury Bonds (Treasury), USD Investment Grade Corporate Bonds (IG Bonds) and a diversified portfolio of all three asset classes (Diversified). This provides a measure of the VaR model performance for both diversified and a range of concentrated portfolios. The performance of the VaR models is measured on these portfolios in both periods of stability and periods of extreme market volatility. This test period includes COVID-19, the Russia-Ukraine conflict and the recent high inflationary period.
VaR model benchmarking
The performance of the models is evaluated with VaR backtesting. The results show that the volatility scaling provides significantly improved performance over both the HS and GARCH VaR models, providing a faster response to markets moves and a lower instance of VaR exceptions.
Model benchmarking with VaR backtesting
A key metric for measuring the performance of VaR models is a comparison of the frequency of VaR exceptions with the limits set by the Basel Committee’s Traffic Light Test (TLT). Excessive exceptions will incur an increased capital multiplier for an Amber result (5 – 9 exceptions) and an intervention from the regulator in the case of a Red result (ten or more exceptions). Exceptions often indicate a slow reaction to market moves or a lack of accuracy in modeling risk.
VaR measure coverage
The coverage and adaptability of the VaR models can be observed from the comparison of the realised returns and VaR time series shown in Figure 2. This shows that although the GARCH model is faster to react to market changes than HS VaR, it underestimates the tail risk in stable markets, resulting in a higher instance of exceptions. Volatility scaling retains the conservatism of the HS VaR model whilst improving its reactivity to turbulent market conditions. This results in a significant reduction in exceptions throughout 2022.
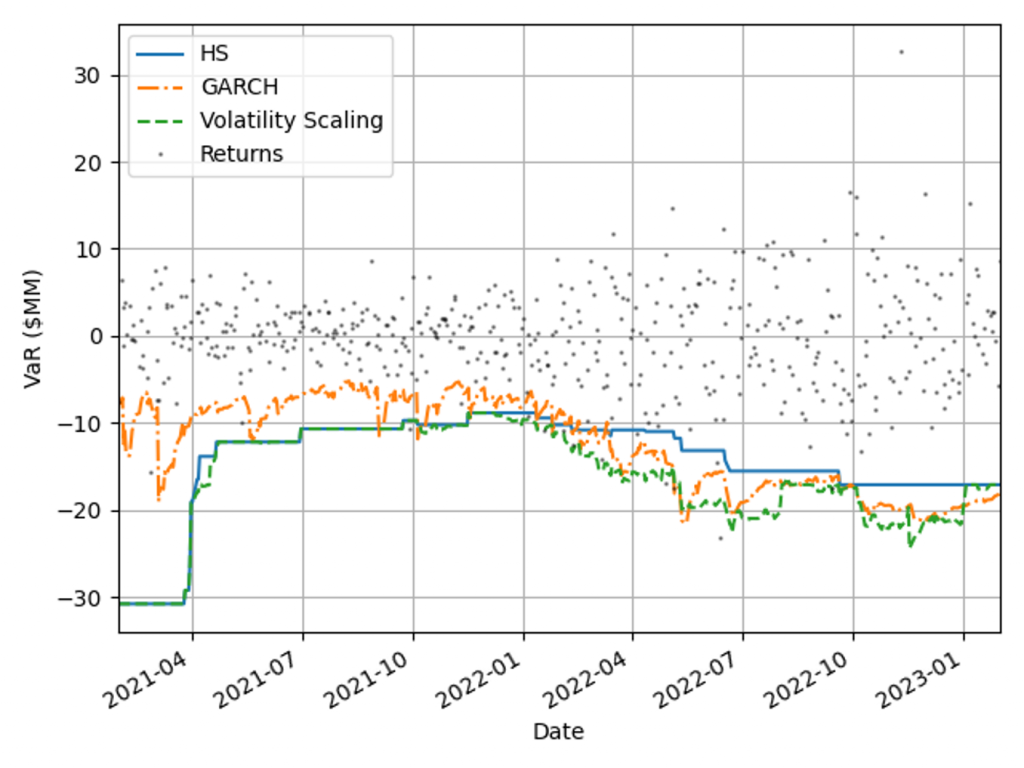
Figure 2: Comparison of realised returns with the model VaR measures for a diversified portfolio.
VaR backtesting results
The VaR model performance is illustrated by the percentage of backtest days with Red, Amber and Green TLT results in Figure 3. Over this period HS VaR shows a reasonable coverage of the hypothetical P&Ls, however there are instances of Red results due to the failure to adapt to changes in market conditions. The GARCH model shows a significant reduction in performance, with 32% of test dates falling in the Red zone as a consequence of VaR underestimation in calm markets. The adaptability of volatility scaling ensures it can adequately cover the tail risk, increasing the percentage of Green TLT results and completely eliminating Red results. In this benchmarking scenario, only volatility scaling would pass regulatory scrutiny, with HS VaR and GARCH being classified as flawed models, requiring remediation plans.
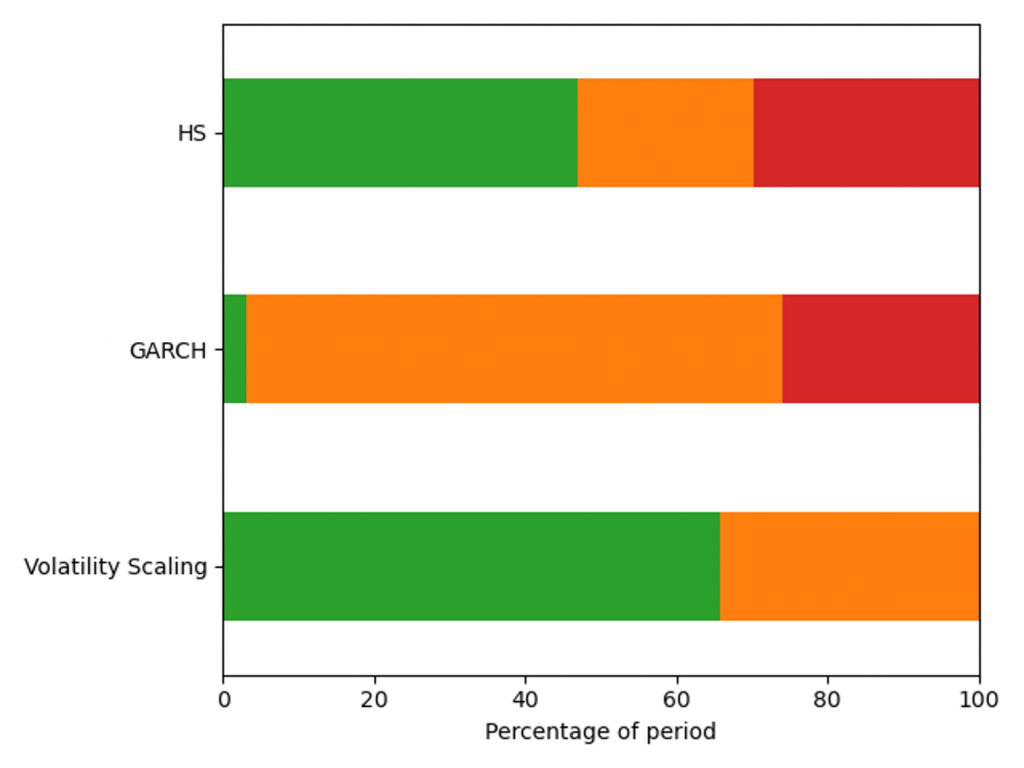
Figure 3: Percentage of days with a Red, Amber and Green Traffic Light Test result for a diversified portfolio over the window 29/01/21 - 31/01/23.
VaR model capital requirements
Capital requirements are an important determinant in banks’ ability to act as market intermediaries. The volatility scaling method can be used to increase the HS capital deployment efficiency without compromising VaR backtesting results.
Capital requirements minimisation
A robust VaR model produces risk measures that ensure an ample capital buffer to absorb portfolio losses. When selecting between robust VaR models, the preferred approach generates a smaller capital charge throughout the market cycle. Figure 4 shows capital requirements for the VaR models for a diversified portfolio calculated using Equation 1, with 𝐴𝑑𝑑𝑜𝑛𝑠 set to zero. Volatility scaling outperforms both models during extreme market volatility (the Russia-Ukraine conflict) and the HS model in period of stability (2021) as a result of setting the lower scaling constraint. The GARCH model underestimates capital requirements in 2021, which would have forced a bank to move to a standardised approach.
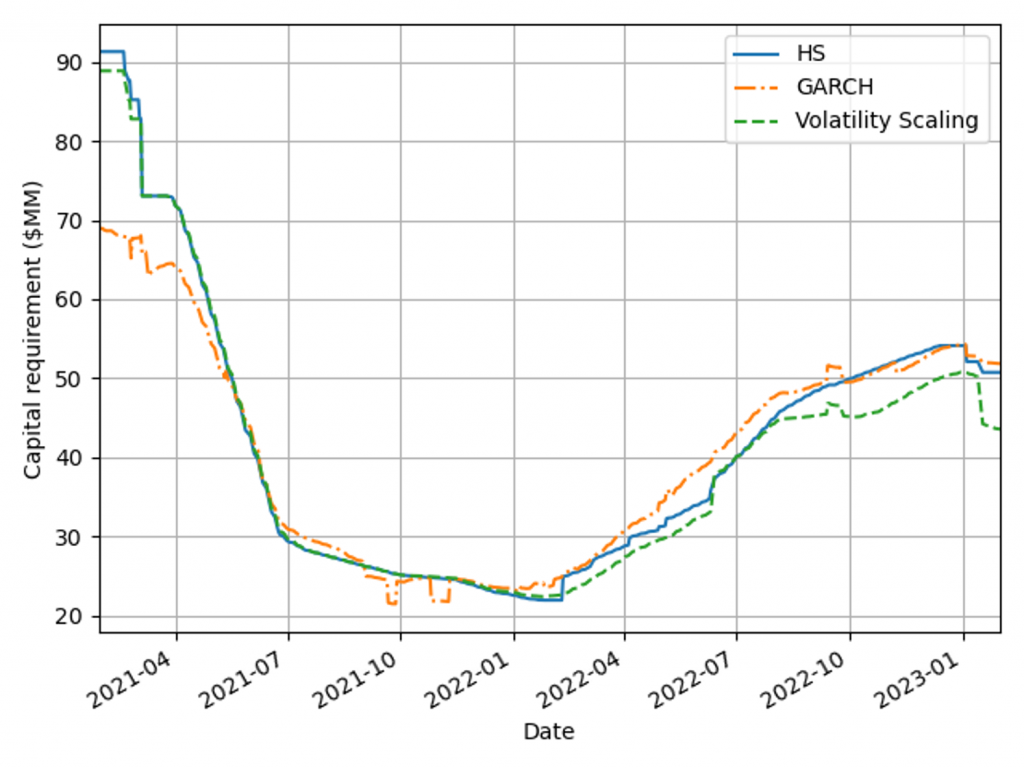
Figure 4: Capital charge for the VaR models measured on a diversified portfolio over the window 29/01/21 - 31/01/23.
Capital management efficiency
Pro-cyclicality of capital requirements is a common concern among regulators and practitioners. More stable requirements can improve banks’ capital management and planning. To measure models’ pro-cyclicality and efficiency, average capital charges and capital volatilities are compared for three concentrated asset class portfolios and a diversified market portfolio, as shown in Table 2. Volatility scaling results are better than the HS model across all portfolios, leading to lower capital charges, volatility and more efficient capital allocation. The GARCH model tends to underestimate high volatility and overestimate low volatility, as seen by the behaviour for the lowest volatility portfolio (Treasury).
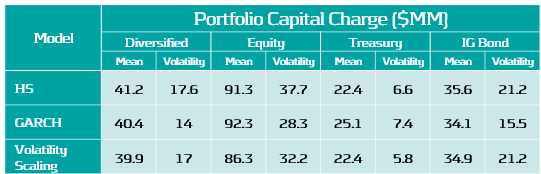
Table 2: Average capital requirement and capital volatility for each VaR model across a range of portfolios during the test period, 29/01/21 - 31/01/23.
Conclusions on VaR backtesting
Recent periods of market stress highlighted the need to challenge banks’ existing VaR models. Volatility scaling is an efficient method to enrich existing VaR methodologies, making them robust across a range of portfolios and volatility regimes.
VaR backtesting in a volatile market
Ensuring VaR models conform to VaR backtesting will be challenging with the recent period of stressed market conditions and rapid changes in market volatility. Banks will need to ensure that their VaR models are responsive to volatility clustering and tail events or enhance their existing methodology to cope. Failure to do so will result in additional overheads, with increased capital charges and excessive exceptions that can lead to additional regulatory scrutiny.
Enriching VaR Models with volatility scaling
Volatility scaling provides a simple extension of HS VaR that is robust and responsive to changes in market volatility. The model shows improved backtesting performance over both the HS and parametric (GARCH) VaR models. It is also robust for highly concentrated equity, treasury and bond portfolios, as seen in Table 3. Volatility scaling dampens pro-cyclicality of HS capital requirements, ensuring more efficient capital planning. The additional computational overhead is minimal and the implementation to enrich existing models is simple. Performance can be further improved with the use of hybrid models which incorporate volatility scaling approaches. These can utilise outlier detection to increase conservatism dynamically with increasingly volatile market conditions.
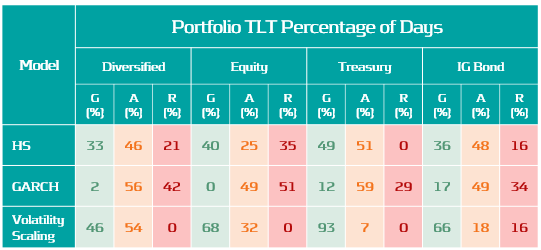
Table 3: Percentage of Green, Amber and Red traffic Lights test results for each VaR model across a range of portfolios for dates in the range: 13/02/19 - 31/01/23.
Zanders recommends
Banks should invest in making their VaR models more robust and reactive to ensure capital costs and the probability of exceptions are minimised. VaR models enriched with a volatility scaling approach should be considered among a suite of models to challenge existing VaR model methodologies. Methods similar to volatility scaling can also be applied to parametric and semi-parametric models. Outlier detection models can be used to identify changes in market regime as either feeder models or early warning signals for risk managers

In March 2021, the European Banking Authority (EBA) was mandated through Article 501c of the Capital Requirements Regulation (CRR) to “assess […] whether a dedicated prudential treatment of exposures related to assets or activities associated substantially with environmental and/or social objectives would be justified”.
More simply put, the EBA was asked to investigate whether the current prudential framework properly captures environmental and social risks. In response, the EBA published a Discussion Paper (DP) [1] in May 2022 to collect input from stakeholders such as academia and banking professionals.
After briefly presenting the DP, this article reviews the current Pillar 1 Capital (P1C) requirements. We limit ourselves to the P1C requirements for credit risk as this is by far the largest risk type for banks. Furthermore, we only discuss the interaction of the P1C with climate change risks (as opposed to broader environmental and/or social risk types). After establishing the extent to which the prudential framework takes climate change risks into account, possible amendments to the framework will be considered.
Key take-aways of this article:
- The current prudential framework includes several mechanisms that allow the reflection of climate change risks into the P1C.
- The interaction between P1C and climate change risks is limited to specific parts of the portfolio, and in those cases, it remains to be seen to what extent this is properly accounted for at the moment.
- Amendments to the prudential framework can be considered, but it is important to avoid double counting issues and to take into account differences in time horizons.
- The EBA is expected to publish a final report on the prudential treatment of environmental risks in the first half of this year.
- Financial institutions that are using the internal ratings-based approach are advised to start with the incorporation of climate change risks into PD and LGD models.
EBA’s Discussion Paper

In the introduction of the DP, the EBA mentions the increasing environmental risks – and their interaction with the traditional risk types – as the trigger for the review of the prudential framework. One of the main concerns is whether the current framework is sufficiently capturing the impact of transition risks and the more frequent and severe physical risks expected in the coming decades. In this context, they stress the special characteristics of environmental risks: compared to the traditional risk types, environmental risks tend to have a “multidimensional, non-linear, uncertain and forward-looking nature.”
The EBA also explains that the P1C requirements are not intended to cover all risks a financial institution is exposed to. The P1C represents a baseline capital requirement that is complemented by the Pillar 2 Capital requirement, which is more reflective of a financial institution’s specific business model and risks. Still, it is warranted to assess whether environmental risks are appropriately reflected in the P1C requirements, especially if these lead to systemic risks.
Even though the DP raises more questions than it provides answers, some starting points for the discussion are introduced. One is that the EBA takes a risk-based approach. Their standpoint is that changes to the prudential framework should reflect actual risk differentials compared to other risk types and that it should not be a tool to (unjustly) incentivize the transition to a sustainable economy. The latter lies “in the remit of political authorities.”
The DP also discusses some challenges related to environmental risks. One example is the lack of high-quality, granular historical data, which is needed to support the calibration of the prudential framework. The EBA also mentions the mismatch in the time horizon for the prudential framework (i.e., a business cycle) and the time horizon over which the environmental risks will unfold (i.e., several decades). They wonder whether “the business cycle concepts and assumptions that are used in estimating risk weights and capital requirements are sufficient to capture the emergence of these risks.”
Finally, the EBA does not favor supporting and/or penalizing factors, i.e., the introduction of adjustments to the existing risk weights based on a (green) taxonomy-based classification of the exposures1. They are right to argue that there is no direct relationship between an exposure’s sustainability profile and its credit risk. In addition, there is a risk of double counting if environmental risk drivers have already been reflected in the current prudential framework. Consequently, the EBA concludes that targeted amendments to the framework may be more appropriate. An example would be to ensure that environmental risks are properly included in external credit ratings and the credit risk models of financial institutions. We explain this in more detail in the following paragraphs.
Pillar 1 Capital requirements
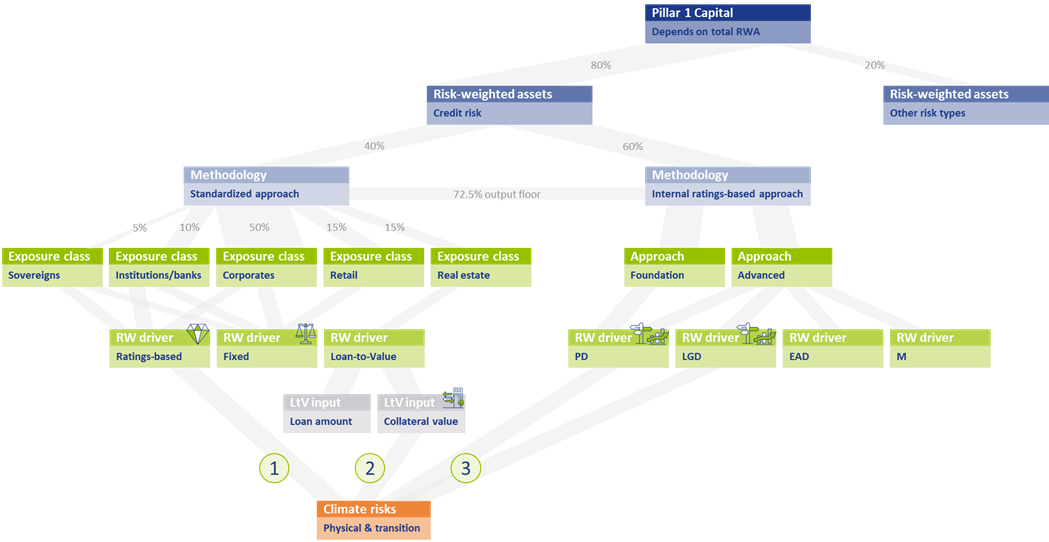
The assessment to what extent climate change risks are properly captured in the current prudential framework requires at least a high-level understanding of the framework. Figure 1 presents a schematic overview of the P1C requirements.
The P1C (at the top of Figure 1) depends on the total amount of Risk-Weighted Assets (RWAs; on the row below)2. RWAs are determined separately for each (traditional) risk type. As mentioned, we only focus on credit risk in this article. The RWAs for credit risk are approximately 80% of the average bank’s total RWAs3. Financial institutions can choose between two methodologies for determining their credit risk RWAs: the Standardized Approach (SA)4 and the internal ratings-based (IRB) approach5 . In Europe, on average 40% of the total RWAs for credit risk are based on the SA, while the rest is based on the IRB approach6 :
Figure 1 – Schematic overview of the P1C requirements and the interaction with climate change risks
Standardized Approach
In the SA, risk weights (RWs) are assigned to individual exposures, depending on their exposure class. About 50% of the RWAs for credit risk in the SA stem from the Corporates exposure class7. Generally speaking, there are three possible RW drivers: the RWAs depend on the external credit rating for the exposure, a fixed RW applies, or the RW depends on the Loan-to-Value8 (LtV) of the (real estate) exposure. The RW for an exposure to a sovereign bond for example, is either equal to 100% if no external credit rating is available (a fixed RW) or it ranges between 0% (for an AAA to AA-rated bond) and 150% (for a below B-rated bond).
Internal Ratings-Based Approach
Within the IRB approach, a distinction is made between Foundation IRB (F-IRB) and Advanced IRB (A-IRB). In both cases, a financial institution is allowed to use its internal models to determine the Probability of Default (PD) for the exposure. In the A-IRB approach, the financial institution in addition is allowed to use internal models to determine the Loss Given Default (LGD), Exposure at Default (EAD), and the Effective Maturity (M).
Interaction with climate change risks
The overview of the P1C requirements introduced in the previous section allows us to investigate the interaction between climate change risks and the P1C requirement. This is done separately for the SA and the IRB approach.
Standardized Approach
In the SA, there are two elements that allow for interaction between climate change risks and the resulting P1C. Climate change risks could be reflected in the P1C if the RW depends on an external credit rating, and this rating in turn properly accounts for climate change risks in the assessment of the counterparty’s creditworthiness (see 1 in Figure 1). The same holds if the RW depends on the LtV and in turn, the collateral valuation properly accounts for climate change risks (see 2 in Figure 1). This raises several concerns:

First, it can be questioned whether external credit ratings are properly capturing all climate change risks. In a report from the Network for Greening the Financial System (NGFS) [3], which was published at the same time as EBA’s DP, it is stated that credit rating agencies (CRAs) have so far not attempted to determine the credit impact of environmental risk factors (through back-testing for example). Also, the lack of high-quality historical data is mentioned as an explanation that statistical relationships between environmental risks and credit ratings have not been quantified. Further, a paper published by the ECB [4] concludes that, given the current level of disclosures, it is impossible for users of credit ratings to establish the magnitude of adjustments to the credit rating stemming from ESG-related risks. Nevertheless, they state that credit rating agencies “have made significant progress with their disclosures and methodologies around ESG in recent years.” The need for this is supported by academic research. An example is a study [5] from 2021 in which a correlation between credit default swap (CDS) spreads and ESG performance was demonstrated, and a study from 2020 [6] which demonstrated that high emitting companies have a shorter distance-to-default.

Secondly, the EBA has reported in the DP that less than 10% of the SA’s total RWAs is derived based on external credit ratings. This implies that a large share of the total RWAs is assigned a fixed RW. Obviously, in those cases there is no link between the P1C and the climate change risks involved in those exposures.

Finally, climate change risks only impact the P1C maintained for real estate exposures to the extent that these risks have been reflected in collateral valuations. Although climate change risks are priced in financial markets according to academic literature, many papers and institutions indicate that these risks are not (yet) fully reflected. In a survey held by Stroebel and Wurgler in 2021 [7], it is shown that a large majority of the respondents (consisting of finance academics, professionals and public sector regulators, among others) is of the opinion that climate change risks have insufficiently been priced in financial markets. A nice overview of this and related literature is presented in a publication from the Bank for International Settlements (BIS) [8]. The EBA DP itself lists some research papers in chapter 5.1 that indicate a relationship between a home’s sales price and its energy efficiency, or with the occurrence of physical risk events. It is unclear though if climate change risks are fully captured in the collateral valuations. For example, research is presented that information on flood risk is not priced into residential property prices. Recent research by ABN AMRO [9] also shows this.
Internal Ratings-Based Approach
In the IRB approach, financial institutions have more flexibility to include climate change risks in their internal models (see 3 in Figure 1). In the F-IRB approach this is limited to PD models, but in the A-IRB approach also LGD models can be adjusted.

A complicating factor is the forward-looking nature of climate change risks. In recent years, the competent authorities have pressured financial institutions to use historical data as much as possible in their model calibration and to back-test the performance of their models. As climate change risks will unfold over the next couple of decades, these are not (yet) reflected in historical data. To incorporate climate change risk, expert judgement would therefore be required. This has been discouraged over the past years (e.g., through the ECB’s Targeted Review of Internal Models (TRIM)) and it will probably trigger a discussion with the competent authorities. A possible deterioration of model performance (due to higher estimated risks compared to historically observations) is just one example that may attract attention.

Another complicating factor is that under the IRB approach, the PD of an obligor is estimated based on long-run average one-year default rates. While this may be an appropriate approach if there are no clear indications that the overall risk level will change, this does not hold if climate change risks increase in the future, and possibly increase systemic risks. By continuing to base a PD model on historical data only, especially for exposures with a time to maturity beyond a couple of years, the credit risk may be understated.
Are amendments to the prudential framework needed?
We have explained that there are several mechanisms in the prudential framework that allow environmental risks to be included in the P1C: the use of external credit ratings, the valuation of collateral, and the PD and LGD models used in the IRB approach. We have also seen, however, that it is questionable whether these mechanisms are fully effective. External credit ratings may not properly reflect all environmental risks and these risks may not be fully priced in on capital markets, leading to incorrect collateral values. Finally, a large share of the RWAs for credit risk depends on fixed RWs that are not (environmentally) risk-sensitive.
Consequently, it can be argued that amendments or enhancements to the prudential framework are needed. One must be careful, however, as the risk of double counting is just around the corner. Therefore, the following amendments or actions should be considered:
- Further research should be undertaken to investigate the relationship between climate change risk and the creditworthiness of counterparties. If there is more clarity on this relationship, it should also be assessed to what extent this relationship is sufficiently reflected in external ratings. Requiring more advanced disclosures from credit rating agencies could help to understand whether these risks are sufficiently captured in the prudential framework. One should be cautious to amend the ratings-based RWs in the SA, since credit rating agencies are continuously working on the inclusion of environmental risks into their credit assessments; there would be a real risk of double counting.
- The potential negative impact of climate change risks on collateral value should be further investigated. Financial institutions are already required by the ECB9 to consider environmental risks in their collateral valuations but this is not at a sufficient level yet. It will be important to consider the possibility of sudden value changes due to transition risks like shifting consumer sentiment or awareness.
- To improve the risk-sensitivity of the framework, a dependency on the carbon emissions of the counterparty could be introduced in the fixed RWs, possibly only for the most carbon-intensive sectors. It could be argued that there are other factors that have a more significant relationship with the default risk of a certain counterparty that could be included in the SA. Climate change risks, however, differ in the sense that they can lead to a systemic risk (as opposed to an idiosyncratic risk) that is currently not captured in the overall level of the RWs.
- In the SA, a distinction could be introduced based on the exposure’s time to maturity. For relatively short-term exposures, the current calibrations are probably fine. For longer-term exposures, however, the risks stemming from climate change may be underestimated as these are expected to increase over time.
- In the IRB approach, a reflection of climate change risk would require the regulator to allow for forward-looking expert judgment in the (re)calibration of PD and LGD models. Further guidance from the competent authorities on the potentially negative impact on model performance based on historical data would also be useful.
Conclusion
Based on the schematic overview of the P1C requirements and the (potential) interaction with climate change risks, we conclude that several mechanisms in the prudential framework allow for climate change risks to be incorporated into the P1C. At the same time, we conclude that this interaction is limited to specific parts of the portfolio, and that in those cases it remains to be seen to what extent this is properly accounted for. To remedy this, amendments to the prudential framework could be considered. It is important, however, to avoid double counting issues and to be mindful of time horizon differences.
It is expected that the EBA will publish a final report on the prudential treatment of environmental risks in the first half of this year. However, especially financial institutions that are using the IRB approach should not take a wait-and-see approach. Given the complexity of modeling climate change risks, it is prudent to start incorporating climate change risks into PD and LGD models sooner rather than later.
With Zanders’ extensive experience covering both credit risk modeling and climate change risk, we are well suited to support with this process. If you are looking for support, please reach out to us.
1 Supporting factors are currently in place for SMEs and infrastructure projects, but the EBA advocated their removal.
2 See RBC20.1 in the Basel Framework.
3 See for example the results from the EBA’s EU-wide transparency exercise. This is reflected in Figure 1 by the percentage in the grey link between P1C and RWAs for credit risk.
4 See CRE20 to CRE22 in the Basel Framework.
5 See CRE30 to CRE36 in the Basel Framework.
6 In the Netherlands, less than 20% of the total RWAs is based on the SA. See the EBA’s EU-wide transparency exercise for more information. The percentages in the grey link between ‘Risk-weighted assets’ and ‘Methodology’ in Figure 1 are based on the European average.
7 See the EBA’s Risk assessment of the European banking system [2]. The percentages in the grey link between ‘Standardized Approach’ and the ‘Exposure class’ in Figure 1 reflect the share of RWAs in the SA for each of the different exposure classes.
8 The LtV is defined as the ratio between the loan amount and the value of the property that serves as collateral.
9 See expectation 8.3 in the ECB’s Guide on climate-related and environmental risks.
References
- The role of environmental risks in the prudential framework, European Banking Authority, Discussion Paper, 2 May 2022
- Risk assessment of the European banking system, European Banking Authority, December 2022
- Capturing risk differentials from climate-related risks, Network for Greening the Financial System, Progress Report, May 2022
- Disclosure of climate change risk in credit ratings, European Central Bank, Occasional Paper Series, No. 303, September 2022
- Pricing ESG risk in credit markets, Federated Hermes, March 2021
- Climate change and credit risk, Capasso, Gianfrate, and Spinelli, Journal of Cleaner Production, Volume 266, September 2020
- What do you think about climate finance?, Stroebel and Wurgler, Journal of Financial Economics, vol 142, no 2, November 2021
- Pricing of climate risks in financial markets, Bank for International Settlements, Monetary and Economic Department, December 2022
- Is flood risk already affecting house prices?, ABN AMRO, 11 February 2022
- Guide on climate-related and environmental risks, European Central Bank, November 2020

Climate change presents risks to the banking system.
These risks stem from the transition towards a low carbon economy and from the physical risks of damages due to extreme weather events. To address climate-related financial risks within the banking sector, the Basel Committee on Banking Supervision (BCBS) established a high-level Task Force on Climate-related Financial Risks in 2020. It contributes to the BCBS’s mandate to strengthen the regulation, supervision and practices of banks worldwide with the purpose of enhancing financial stability.
Both the BCBS’s Core principles for effective banking supervision1 and the Supervisory Review and Evaluation Process (SREP) within the existing Basel Framework are considered sufficiently broad and flexible to accommodate additional supervisory responses to climate-related financial risks. It was felt, however, that supervisors and banks could benefit from the publication of the Principles for the effective management and supervision of climate-related financial risks2. Through this publication, the BCBS seeks to promote a principles-based approach to improving risk management and supervisory practices regarding climate-related financial risks. The document contains principles directed to banks and principles directed to supervisory authorities. In this article, we present an overview of the principles directed to banks.
The BCBS published a draft of their Principles in November 2021. During the consultation phase, which lasted until February 2022, banks and supervisors could provide feedback. The BCBS incorporated their feedback in the final version of the Principles that were published in June 2022.
Principles for the management of climate-related financial risks
In total, twelve bank-focused principles are presented and grouped in eight categories. Each of the eight categories is briefly discussed below:
Corporate governance – Principles 1 to 3
The principles related to corporate governance state that banks first need to understand and assess the potential impact of climate risks on all fields they operate in. Subsequently, appropriate policies, procedures and controls need to be implemented to ensure effective management of the identified risks. Furthermore, roles and responsibilities need to be clearly defined and assigned throughout the bank. To successfully manage climate-related risks, banks should ensure an adequate understanding of climate-related financial risks and as well as adequate resources and skills at all relevant functions and business units within the bank. Finally, the board and senior management should ensure that all climate-related strategies are consistent with the bank’s stated goals and objectives.
Internal control framework – Principle 4
The fourth principle within the internal control framework subcategory requires banks to include clear definitions and assignment of climate-related responsibilities and reporting lines across all three lines of defense. Further requirements are then presented for each line of defense.
Capital and liquidity adequacy – Principle 5
After the identification and quantification of the climate-related financial risks, these risks need to be incorporated into banks’ Internal Capital (and Liquidity) Adequacy Assessment Process (ICLAAP). Banks should provide insights in which climate-related financial risks affect their capital and liquidity position. In addition, physical and transition risks relevant to a bank’s business model assessed as material over relevant time horizons, should be incorporated into their stress testing programs in order to evaluate the bank’s financial position under severe but plausible scenarios. Furthermore, the described incorporation in the ICLAAP to handle such financial risks, should be done iteratively and progressively, as the methodologies and data used to analyze these risks continue to mature over time.
Risk management process – Principle 6
The sixth principle connects to the previous one, as it states that a bank needs to identify, monitor and manage all climate-related financial risks that could materially impair their financial condition, including their capital resources and liquidity positions. The bank’s risk management framework should be comprehensive with respect to the (material) climate-related financial risks they are exposed to. Clear definitions and thresholds should be set for materiality. These need to be monitored closely and adjusted, if necessary, as climate-related risks are evolving.
Management monitoring and reporting – Principle 7
After ensuring that the risk framework is comprehensive, banks need to implement the monitoring and reporting of climate-related financial risks in a timely manner to facilitate effective decision-making. To achieve such reporting, a good data infrastructure should be in place at the bank. This allows it to identify, collect, cleanse, and centralize the data necessary to assess material climate-related financial risks. Furthermore, banks should actively collect additional data from clients and counterparties in order to develop a better understanding of their client’s transition strategies and risk profiles.
Management of credit, market, liquidity, operational risk – Principles 8 to 11
Banks should understand the impact of climate-related risk drivers on their credit risk profiles, market positions, liquidity risk profiles and operational risks. Clearly articulated credit policies and processes to identify, measure, evaluate, monitor, report and control or mitigate the impacts of material climate-related risk drivers on banks’ credit risk exposures should be in place. From a market risk perspective, banks should consider the potential losses in their portfolios due to climate-related risks. On the business operation and strategy side of banking activities, the impact of climate-related risks also plays a large role. For example, physical risks have to be taken into account when drafting business continuity plans. After understanding the different risks and their impacts, a range of risk mitigation options to control or mitigate climate-related financial risks need to be considered.
Scenario analysis – Principle 12
The final principle states that banks need to use scenario analysis to assess the resilience of their business models and strategies to a range of plausible climate-related pathways, and to determine the impact of climate-related risk drivers on their overall risk profile. Scenario analysis should reflect the overall relevant climate-related financial risks for banks, including both physical and transition risks. This analysis should be performed for different time horizons, both short- and long-term, and should be highly dynamic.
Changes to the BCBS risk framework draft and related publications
The final Principles have not changed much compared to the November 2021 consultation document. The most important changes are that the first principle, concerning corporate governance of banks, and the fifth principle, concerning capital and liquidity adequacy, have been extended. The corporate governance principle, for example, now also includes that banks should ensure that their internal strategies and risk appetite statements are consistent with any publicly communicated climate-related strategies and commitments. The capital and liquidity adequacy principle now includes a section requiring banks to incorporate material climate-related financial risks in their stress testing programs.
These twelve bank-focused principles, providing banks guidance on effective risk management of climate-related financial risks, can also be linked to the initiatives of other regulators such as the ECB. In November 2020, for example, the ECB provided a guide that describes how it expects institutions to consider climate-related and environmental risks, when formulating and implementing their business strategy, governance and risk management frameworks (the ECB expectations). These ECB expectations are in line with the BCBS Principles (and often more elaborate).
Zanders has gained relevant experience in implementing the ECB expectations at several Dutch banks. This experience ranges from risk identification and materiality assessments to the quantification of climate-related risks, ESG data frameworks, model validations, and scenario analysis. Please reach out to us if your bank is seeking support in implementing the BCBS Principles.
References
1) Basel Committee on Banking Supervision (2012). Core Principles for Effective Banking Supervision.
2) Basel Committee on Banking Supervision (2022). Principles for the effective management and supervision of climate-related financial risks.

With the recent avalanche of ESG-related guidance and regulations, it is easy to lose track of the corresponding timelines.
In the below overview, we present an overview of the main ESG-related publications from the European Commission (EC), the European Central Bank (ECB), and the European Banking Authority (EBA).
This is complemented by the most important timelines that are stipulated in these regulations and guidelines. Additional regulations and guidelines that are expected for the next couple of years are also highlighted.
If you want to discuss any of them, don’t hesitate to reach out to our subject matter experts.