Replicating investment portfolios

Many banks use a framework of replicating investment portfolios to measure and manage the interest rate risk of variable savings deposits. There are two commonly used methodologies, known as the marginal investment strategy and the portfolio investment strategy. While these have the same objective, the effects for margin and interest maturity may vary. We review these strategies on the basis of a quantitative and a qualitative analysis.
A replicating investment portfolio is a collection of fixed-income investments based on an investment strategy that aims to reflect the typical interest rate maturity of the savings deposits (also referred to as ‘non-maturing deposits’). The investment strategy is formulated so that the margin between the portfolio return and the savings interest rate is as stable as possible, given various scenarios.
A replicating framework enables a bank to base its interest rate risk measurement and management on investments with a fixed maturity and price – while the deposits have no contractual maturity or price. In addition, a bank can use the framework to transfer the interest rate risk from the business lines to the central treasury, by turning the investments into contractual obligations. There are two commonly used methodologies for constructing the replicating portfolios: the marginal investment strategy and the portfolio investment strategy. These strategies have the same objective, but have different effects on margin and interest-rate term, given certain scenarios.
Strategies defined
An investment strategy determines the monthly allocation of the investable volume across various maturities. The investable volume in month t ( It ) consists of two parts:
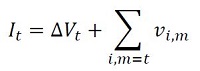
The first part is equal to the decrease or increase in the volume of savings deposits compared to the previous month. The second part is equal to the total principal of all investments in the investment portfolio maturing in the current month (end date m = t ), Σi,m=t vi,m.
By investing or re-investing the volume of these two parts, the total principal of the investment portfolio will equal the savings volume outstanding at that moment. When an investment is generated, it receives the market interest rate relating to the maturity at that time. The portfolio investment return is determined as the principal weighted average interest rate.
The difference between a marginal investment strategy and a portfolio investment strategy is that in a marginal investment strategy, the volume is invested with a fixed allocation across fixed maturities. In a portfolio strategy, these parameters are flexible, however investments are generated in such a way that the resulting portfolio each month has the same (target) proportional maturity profile. The maturity profile provides the total monthly principal of the currently outstanding investments that will mature in the future.
In the savings modeling framework, the interest rate risk profile of the savings portfolio is estimated and defined as a (proportional) maturity profile. For the portfolio investment strategy, the target maturity profile is set equal to this estimated profile. For the marginal investment strategy, the ‘investment rule’ is derived from the estimated profile using a formula. Under long lasting constant or stable volume of savings deposits, the investment portfolio given the investment rule converges to the estimated profile.
Strategies illustrated
In Figure 1, the difference between the two strategies is graphically illustrated in an example. The example provides the development of replicating portfolios of the two strategies in two consecutive months upon increasing savings volume. The replicating portfolios initially consist of the same investments with original maturities of one month, 12 months and 36 months. To this end, the same investments and corresponding principals mature. The total maturing principal will be reinvested and the increase in savings volume will be invested.
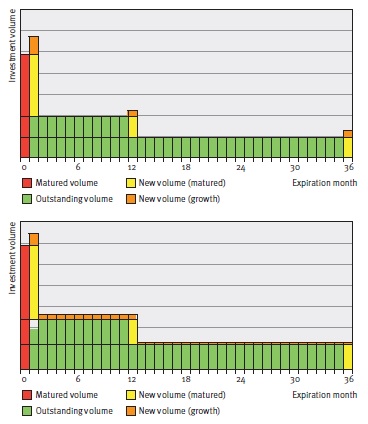
Figure 1: Maturity profiles for the marginal (figure on top) and portfolie (figure below) investment strategies given increasing volume.
Note that if the savings volume would have remained constant, both strategies would have generated the same investments. However, with changing savings volume, the strategies will generate different investments and a different number of investments (3 under the marginal strategy, and 36 under the portfolio strategy).
The interest rate typical maturities and investment returns will therefore differ, even if market interest rates do not change. For the quantitative properties of the strategies, the decision will therefore focus mainly on margin stability and the interest rate typical maturity given changes in volume (and potential simultaneous movements in market interest rates).
Scenario analysis
The quantitative properties of the investment strategies are explained by means of a scenario analysis. The analysis compares the development of the duration, margin and margin stability of both strategies under various savings volume and market interest rate scenarios.
Client interest rate
As part of the simulation of a margin, a client interest rate is modeled. The model consists of a set of sensitivities to market interest rates (M1,t) and moving averages of market interest rates (MA12,t). The sensitivities to the variables show the degree to which the bank has to reflect market movements in its client interest rate, given the profile of its savings clients.
The model chosen for the interest rate for the point in time t (CRt) is as follows:
Up to a certain degree, the model is representative of the savings interest rates offered by (retail) banks.
Investment strategies
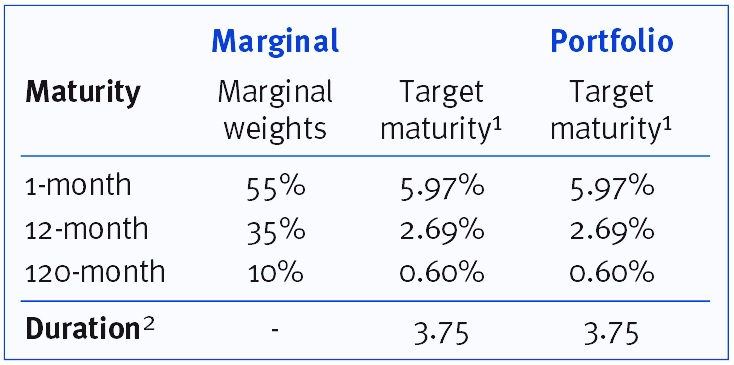
The investment rules are formulated so that the target maturity profiles of the two strategies are identical. This maturity profile is then determined so that the same sensitivities to the variables apply as for the client rate model. An overview of the investment strategies is given in Table 1.
The replication process is simulated for 200 successive months in each scenario. The starting point for the investment portfolio under both strategies is the target maturity profile, whereby all investments are priced using a constant historical (normal) yield curve. In each scenario, upward and downward shocks lasting 12 months are applied to the savings volume and the yield curve after 24 months.
Example scenario
The results of an example scenario are presented in order to show the dynamics of both investment strategies. This example scenario is shown in Figure 2. The results in terms of duration and margin are shown in Figure 3.
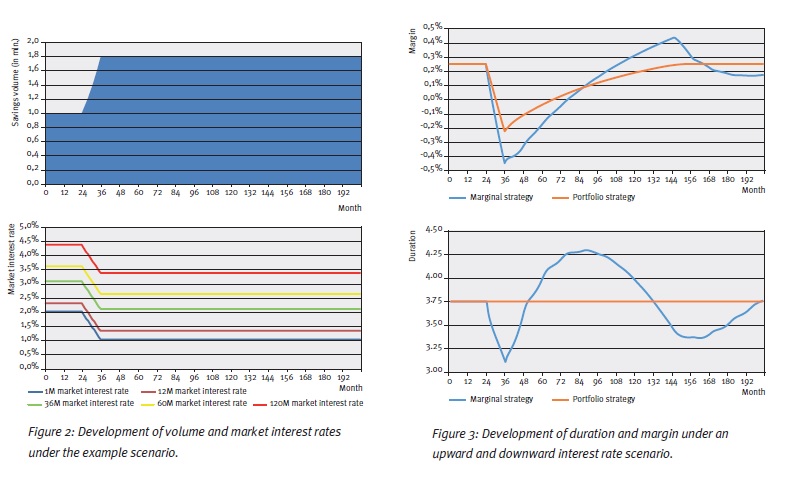
As one would expect, the duration for the portfolio investment strategy remains the same over the entire simulation. For the marginal investment strategy, we see a sharp decline in the duration during the ‘shock period’ for volume, after which a double wave motion develops on the duration. In short, this is caused by the initial (marginal) allocation during the ‘stress’ and subsequent cycles of reinvesting it.
With an upward volume shock, the margin for the portfolio strategy declines because the increase in savings volume is invested at downward shocked market interest rates. After the shock period, the declining investment return and client rate converge. For the marginal strategy this effect also applies and in addition the duration effects feed into the margin development.
Scenario spectrum
In the scenario analysis the standard deviation of the margin series, also known as the margin volatility, serves as a proxy for margin stability. The results in terms of margin stability for the full range of market interest rate and volume scenarios are summarized in Figure 4.
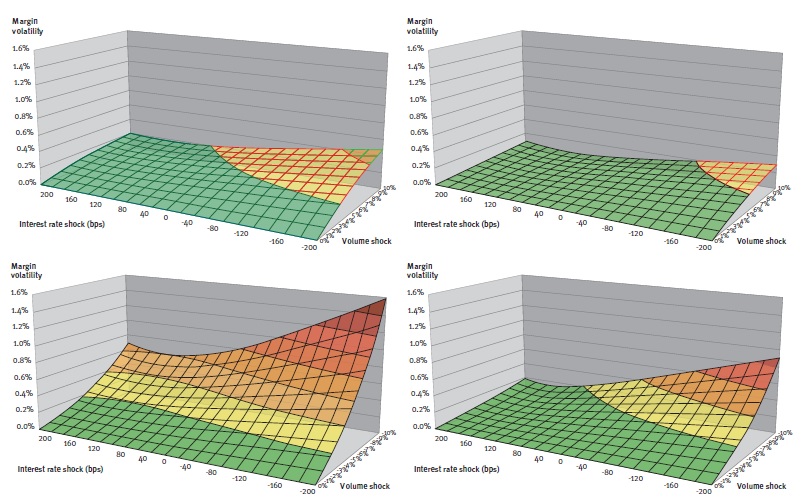
Figure 4: Margin volatility of marginal (left-hand figure) and portfolio strategy (right-hand figure) for upward (above) and downward (below) volume shocks.
From the figures, it can be seen that the margin of the marginal investment strategy has greater sensitivity to volume and interest rate shocks. Under these scenarios the margin volatility is on average 2.3 times higher, with the factor ranging between 1.5 and 4.5. In general, for both strategies, the margin volatility is greatest under negative interest-rate shocks combined with upward or downward volume shocks.
Replication in practice
The scenario analysis shows that the portfolio strategy has a number of advantages over the marginal strategy. First of all, the maturity profile remains constant at all times and equal to the modeled maturity of the savings deposits. Under the marginal strategy, the interest rate typical maturity can vary from it over long periods, even when there are no changes in market interest environment or behavior in the savings portfolio.
Secondly, the development of the margin is more stable under volume and interest rate shocks. The margin volatility under the marginal investment strategy is actually at least one and a half times higher under the chosen scenarios.
An intuitive process
These benefits might, however, come at the expense of a number of qualitative aspects that may form an important consideration when it comes to implementation. Firstly, the advantage of a constant interest-rate profile for the portfolio strategy, comes at the expense of intuitive combinations of investments. This may be important if these investments form contractual obligations for the transfer of the interest rate risk.
The strategy, namely, requires generating a large number of investments that can even have negative principals in case of a (small) decline of savings volume. Secondly, the shocks in the duration in a marginal strategy might actually be desirable and in line with savings portfolio developments. For example, if due to market or idiosyncratic circumstances there is high inflow of deposit volume, this additional volume may be relatively more interest rate sensitive justifying a shorter duration.
Nevertheless, the example scenario shows that after such a temporary decline a temporary increase will follow for which this justification no longer applies.
The choice
A combination of the two strategies may also be chosen as a compromise solution. This involves the use of a marginal strategy whereby interventions trigger a portfolio strategy at certain times. An intervention policy could be established by means of limits or triggers in the risk governance. Limits can be set for (unjustifiable) deviations from the target duration, whereas interventions can be triggered by material developments in the market or the savings portfolio.
In its choice for the strategy, the bank is well-advised to identify the quantitative and qualitative effects of the strategies. Ultimately, the choice has to be in line with the character of the bank, its savings portfolio and the resulting objective of the process.
- The profile shown is a summary of the whole maturity profile. In the whole profile, 5.97% of the replicating volume matures in the first month, 2.69% per month in the second to the 12th month, etc.
- Note that this is a proxy for the duration based on the weighted average maturity of the target maturity profile.
An extended version of this article is published in our Savings Special. Would you like to read it? Please send an e-mail to [email protected].
More articles about ‘The modeling of savings’:
-
New challenges for banks’ ESG strategy and risk management

-
Debt Capacity Made Easy with our Latest Transfer Pricing Solution

-
Boosting MVA Calculation Efficiency: The Power of GPU Computing

-
The EBA’s New IRRBB Heatmap Implementation: Reporting on Key Objectives

-
Intra-Group Loan Transfer Pricing: What’s New in 2025?

-
Insights into XVA Calculations: How to Harness the Power of Neural Networks

-
Unlocking Value Through Foreign Exchange (FX) Risk Management: A Blueprint for Private Equity

-
PRA regulation changes in PS9/24

-
How BCBS 239’s RDARR Principles Can Strengthen Risk Data Aggregation and Reporting in Financial Institutions

-
Converging on resilience: Integrating CCR, XVA, and real-time risk management


