Zanders listed on Swift Customer Security Programme (CSP) Assessment Providers directory

We are excited to announce that Zanders has been listed on the Swift Customer Security Programme (CSP) Assessment Providers directory*.
The CSP helps reinforce the controls protecting participants from cyberattack and ensures their effectivity and that they adhere to the current Swift security requirements.
*Swift does not certify, warrant, endorse or recommend any service provider listed in its directory and Swift customers are not required to use providers listed in the directory.
Swift Customer Security Programme
A new attestation must be submitted at least once a year between July and December, and also any time a change in architecture or compliance status occurs. Customer attestation and independent assessment of the CSCF v2023 version is now open and valid until 31 December 2023. July 2023 also marks the release of Swifts CSCF v2024 for early consultation, which is valid until 31 December 2024.
Swift introduced the Customer Security Programme to promote cybersecurity amongst its customers with the core component of the CSP being the Customer Security Controls Framework (CSCF). Independent assessment has been introduced as a prerequisite for attestation to enhance the integrity, consistency, and accuracy of attestations. Each year, Swift releases an updated version of the CSCF that needs to be attested to with support of an independent assessment.
The Attestation is a declaration of compliance with the Swift Customer Security Controls Policy and is submitted via the Swift KYC-SA tool. Dependent on the Swift Architecture used, the number of controls to be implemented vary; of which certain are mandatory, and others advisory.
Further details on the Swift CSCF can be found on their website:
- https://www.swift.com/myswift/customer-security-programme-csp
- https://www.swift.com/myswift/customer-security-programme-csp/find-external-support/directory-csp-assessment-providers
Our services
Do you have arrangements in place to complete the independent assessment required to support the attestation?
Zanders has experience with and can support the completion of an independent external assessment of your compliance to the Swift Customer Security Control Framework that can then be used to fully complete and sign-off the Swift attestation for this year.
With an extensive track record of designing and deploying bank integrations, our intricate knowledge of treasury systems across both IT architecture as well as business processes positions us well to be a trusted independent assessor. We draw on past projects and assessments to ask the right questions during the assessment phase, aligning our customers with the framework provided by Swift.
The Swift attestation can also form part of a wider initiative to further optimise your banking landscape, whether that be increasing the use of Swift within your organisation, bank rationalization or improving your existing processes. The availability of your published attestation and its possible consultation with counterparties (upon request) helps equally in performing day-to-day risk management.
Approach
Planning
We start with rigorous planning of the assessment project, developing a scope of work and planning resources accordingly. Our team of experts will work with clients to formulate an Impact Assessment based on the most recent version of the Swift Customer Security Controls Framework.
Architecture Classification
A key part of our support will be working with the client to formulate a comprehensive overview of the system architecture and identify the applicable controls dictated by the CSCF.
Perform Assessment
Using our wide-ranging experience, we will test the individual controls against specific scenarios designed to root out any weaknesses and document evidence of their compliance or where they can be improved.
Independent Assessment Report
Based on the evidence collected, we will prepare an Independent Assessment report which includes status of the compliance against individual controls, baselining them against the CSCF and recommendations for improvement areas within the system architecture.
Post Assessment Activities
Once completed, the Independent Assessment report will support you with the submission of the Attestation in line with the requirements of the CSCF version in force, which is required annually by Swift. In tandem, Zanders can deliver a plan for implementation of the recommendations within the report to ensure compliance with current and future years’ attestations. Swift expects controls compliance annually, together with the submission of the attestation by 31 December at the latest, in order to avoid being reported to your supervisor. Non-compliant status is visible to your counterparties.
Do you need support with your Swift CSP Independent Assessment?
We are thrilled to offer a Swift CSP Independent Assessment service and look forward to supporting our clients with their attestations, continuing their commitment to protecting the integrity of the Swift network, and in doing so supporting their businesses too. If you are interested in learning more about our services, please contact us directly below.
Get performance now
- Contact me
You are currently viewing a placeholder content from HubSpot. To access the actual content, click the button below. Please note that doing so will share data with third-party providers.
More Information
The ESG data challenge

Financial institutions (FIs) play an important role in the transition towards a more sustainable economy in which Environmental, Social and Governance (ESG) factors are properly addressed.
But to seize the opportunities ESG must become an integrated part of a bank’s strategy, risk management and disclosure regimes. High-quality data is instrumental to identify and measure ESG risks, but it can be lacking. FIs need to improve their internal data and use of external private and public vendors like Moody’s or the IMF, while developing a framework that plugs any data gaps.
The lack of appropriate ESG data is considered one of the main challenges for many FIs, but proxies, such as using a building’s energy rating to work out its carbon emissions, can be used.
FIs need climate change-related data that isn’t always available if you don’t know where to look. This article will give you an overview of the most relevant data vendors and provide suggestions on how to treat missing data gaps in order to get a comprehensive ESG framework for the green future where carbon measurement, assessment, reporting and trading will be vital
The data challenge
In May 2021, the Network for Greening the Financial System (NGFS) published a ‘Progress report on bridging data gaps’. In this report, the NGFS writes that meeting climate-related data needs is a challenge that can be described along the following three dimensions:
- data availability,
- reliability,
- & comparability.
A further breakdown of the challenges related to these dimensions can be found in Figure 1.
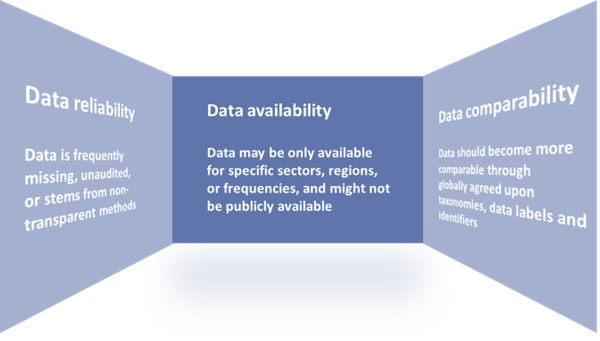
Figure 1: The dimensions of the climate-related data challenge.
Source: Graphic adapted by Zanders from a NGFS report entitled: ‘Progress report on bridging data gaps’ (2021).
Key financial metrics
The NGFS writes that a mix of policy interventions is necessary to ensure climate-related data is based on three building blocks:
- Common and consistent global disclosure standards.
- A minimally accepted global taxonomy.
- Consistent metrics, labels, and methodological standards.
EU Taxonomy, CSRD & EBA’s 3 ESG risk disclosure standards
Several initiatives have started to ignite these needed policy interventions. For example, the EU Taxonomy, introduced by the European Commission (EC), is a classification system for environmentally sustainable activities. In addition, the recently approved Corporate Sustainability Reporting Directive (CSRD) provides ESG reporting rules for large listed and non-listed companies in the EU, including several FIs. The aim of the CSRD is to prevent greenwashing and to provide the basis for global sustainability reporting standards. Another example of a disclosure standard is the binding standards on Pillar 3 disclosures on ESG risks developed by the European Banking Authority (EBA).
Even though policy, law and regulation makers have a big part to play in the data challenge, there are also steps that individual institutions could and should take to improve their own ESG data gaps. Regulatory bodies such as the EBA and the European Central Bank (ECB) have shared their expectations and recommendations on the management of ESG data with FIs.
To illustrate, the EBA recommends FIs “[identify] the gaps they are facing in terms of data and methodologies and take remedial action” and the ECB expects institutions to “assess their data needs in order to inform their strategy-setting and risk management, to identify the gaps compared with current data and to devise a plan to overcome these gaps and tackle any insufficiencies”
Collecting data
Collecting ESG data is a challenging exercise. A distinction can be made between collecting data for large market cap companies, and small cap companies and retail clients. Although large cap companies tend to be more transparent, the data often is dispersed over multiple reports – for example, corporate sustainability reports, annual reports, emissions disclosures, company websites, and so on.
For small cap companies and retail clients, the data is more difficult to acquire. Data that is not publicly available could be gathered bilaterally from clients. For example, one European bank has developed an annual client questionnaire to collect data from its clients.
Gathering data from various reports or bilaterally from clients might not always be the best option, however, because it is time consuming or because the data is not available, reliable, or comparable. Two alternatives are:
- Use tools to collect the data. For example, using open-source tooling from the Two Degrees Investing Initiative (2DII) to calculate Paris Agreement Capital Transition Assessment (PACTA) portfolio alignment.
- Collect data from other external data sources, such as S&P Global.
This could be forward-looking external data on macro-economic expectations, international climate scenarios, financial market data or sectoral climate developments. Below we discuss some sources for external ESG and climate change-related data.
External data
Some of Zanders’ clients resort to vendor solutions for acquiring their ESG data. The most commonly observed solutions, in random order, are:
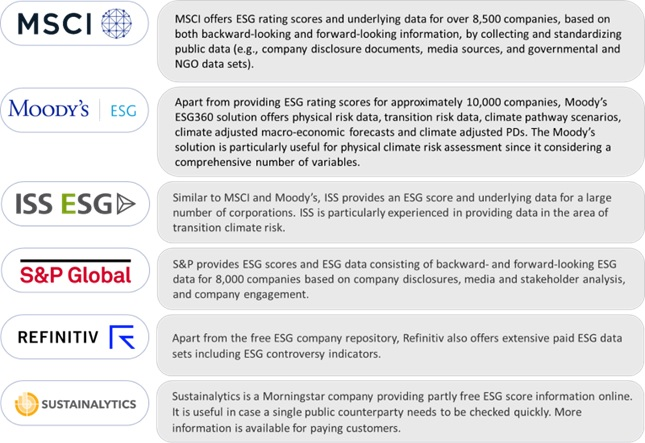
All the solutions above provide an aid to determine if climate related performance data is lacking, or can assist in reporting comparable and reliable data. They all apply a similar process of collecting the data and determining ESG scores, which is illustrated in Figure 2.
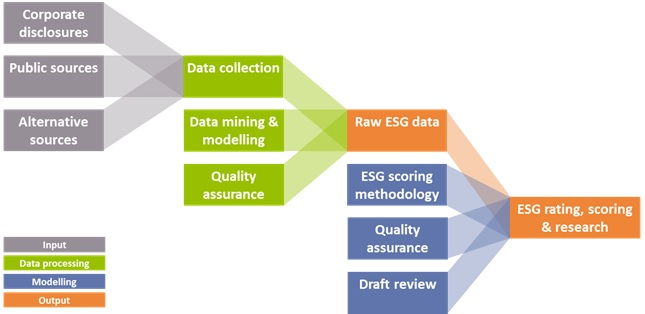
Figure 2: Data collection process for ESG data solutions (Source: Zanders).
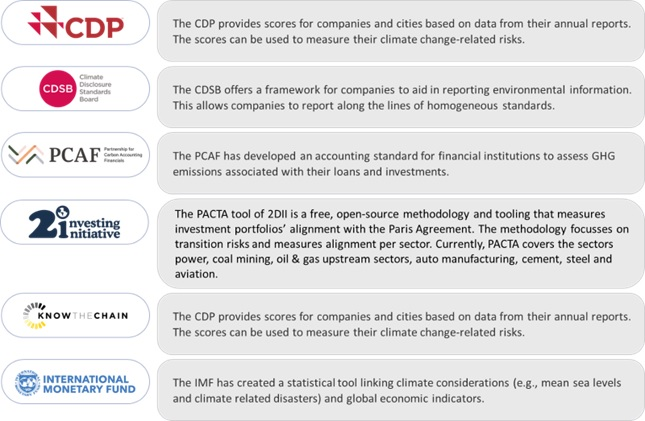
Additionally, public and non-commercial data and solution providers are available, such as:
Missing data
Given the data challenges, it is nearly impossible to create a complete data set. Until that is possible, there are several (temporary) methods to deal with missing data:
- Find a comparable loan, asset, or company for which the required data is available.
- Distribute sector data based on market share of individual companies. For example, assign 10% of the estimated emission of sector X to company Y based on its market share of 10%.
- Find a proxy, comparable or second-best metric. For example, by taking the energy label as a proxy for CO2 emission related to properties, or by excluding scope 3 emissions and focusing on scope 1 and 2 emissions.
- Change the granularity level. For example, by gathering data on sector level rather than on individual positions.
- Fill in the gaps with statistical or machine learning techniques.
Conclusion
The increased attention to integrating ESG risks into existing risk frameworks has led to a need for FIs to collect and disclose meaningful data on ESG factors. However, there is still a lack of data availability, reliability, and comparability.
Several regulatory and political efforts are ongoing to tackle this data challenge, such as the EU taxonomy. More policy interventions, however, are required. Examples are additional mandatory disclosure requirements, an audit and validation framework for ESG data, and social and governance taxonomies that classify economic activities that contribute to social and governance goals.
In the meantime, FIs have to find ways to produce meaningful insights and comply with regulatory requirements related to ESG risks. Zanders has experienced that there is no one-size-fits-all solution for defining, selecting, implementing, and disclosing relevant data and metrics. It is dependent on the composition of the asset and loan portfolio, the use of the data, and the data that is (already) available. Regardless of how the lack of data is solved, it is important that FIs are transparent about their choices and methodologies, and that the related metrics and scorings are explainable and intuitive.
Sources:
https://www.ngfs.net/sites/default/files/medias/documents/progress_report_on_bridging_data_gaps.pdf
https://ec.europa.eu/info/business-economy-euro/banking-and-finance/sustainable-finance/eu-taxonomy-sustainable-activities_en
https://www.europarl.europa.eu/news/en/press-room/20220620IPR33413/new-social-and-environmental-reporting-rules-for-large-companies
https://zandersgroup.com/en/insights/blog/ebas-binding-standards-on-pillar-3-disclosures-on-esg-risks
https://www.eba.europa.eu/sites/default/documents/files/document_library/Publications/Reports/2021/1015656/EBA%20Report%20on%20ESG%20risks%20management%20and%20supervision.pdf
https://www.bankingsupervision.europa.eu/ecb/pub/pdf/ssm.202011finalguideonclimate-relatedandenvironmentalrisks~58213f6564.en.pdf
https://2degrees-investing.org/resource/pacta/
How to setup a Vendor Supply Chain Finance Process in SAP

Vendor Supply Chain Finance (SCF) constitutes the transfer of a (trade) payable position towards the SCF underwriter (i.e. the bank). The beneficiary of the payment can then decide either to receive an invoice payment on due date or to receive the funds before, at the cost of a pre-determined fee.
The debtor’s bank account will only be debited on due date of the payable; hence the bank finances the differential between the due date and the actual payment date towards the beneficiary for this pre-determined fee. This article elaborates on why and how corporates set-up an SCF scheme with their suppliers.
The Vendor SCF construction can be depicted as:
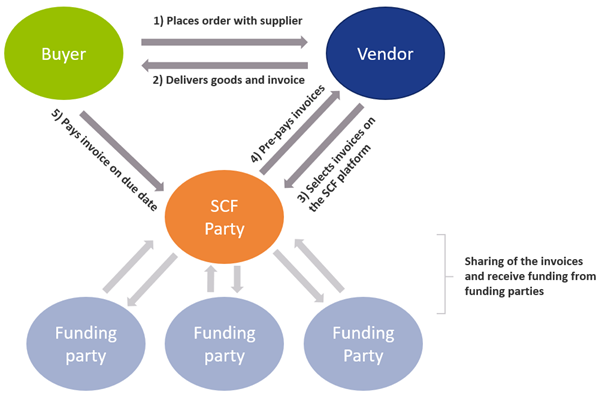
There are multiple business rationales behind Supply Chain Finance. Why would a corporate want to setup an SCF scheme with its suppliers? The most prominent rationales are:
- Reduction of the need of more traditional trade finance
The need for individual line of credits and bank guarantees for each trade transaction is removed, making the trade process more efficient. - Sellers can flexibly and quickly fund short term financing needs
If working capital or financing is needed, the seller can quickly request for outstanding invoices to be paid out early (minus a fee). - Sharing the benefits of better credit rating from buyer towards seller
Because the financing is arranged by the buyer, the seller can enjoy the credit terms that were negotiated between buyer and financier/bank. - Streamlining the AP process
By onboarding various vendors into the SCF process, the buyer can enjoy a singular and streamlined payment process for these vendors. - Strengthening of trade relations
Because of the benefits of SCF, more competitive terms on the trade agreement itself can be negotiated.
SCF is typically considered a tool to improve the working capital position of a company, specifically to decrease the cash conversion cycle by increasing the payment terms with its suppliers without weakening the supply chain.
Set-up and onboarding
Typically, a set-up and onboarding process consists of the following steps. First a financing for SCF is obtained from, for example, a bank. In addition, an SCF provider must be selected and contracted. Most major banks have their own solutions but there are many third parties, for example fintechs, that provide solutions as well. Consequently, the SCF terms are negotiated, and the suppliers are onboarded to the SCF process. Lastly, your system should of course be able to process/register it. Therefore, the ERP accounts payable module needs to be adjusted, such that the AP positions eligible for SCF are interfaced into the SCF platform. Besides, your ERP system needs to be adjusted to be able to reconcile the SCF reports and bank statements.
Design considerations and Processing SCF in SAP
In the picture below we provide a high-level example of how a basic SCF process can work using basic modules in SAP. Note that, based on the design considerations and capabilities of the SCF provider, the picture may look a bit different. For each of the steps denoted by a number, we provide an explanation below the figure, going a little deeper into some of the possible considerations on which a decision must be made.

- Invoice and credit note data entry; In the first step, the invoices/credit notes will be entered, typically with payment terms sometime in the future, i.e. 90 days. Once entered and approved, these invoices are now available to the payment program.
- Payment run: The payment run needs to be engineered such that the invoices that are due in the future (i.e. 90 days from now) will be picked up already in today’s run. Some important considerations in this area are:
- Payment netting logic: the netting of invoices and credit notes is an important design consideration. Typically, credit notes are due immediate and the SCF invoices are due sometime in the future, i.e. 90 days from now. If one would decide to net a credit note due immediate with an invoice due in 90 days, this would have some adverse impact on working capital. An alternative is to exclude credit notes from being netted with SCF invoices and have them settled separately (i.e. request the vendor to pay it out separately or via a direct debit). Additionally, some SCF providers have certain netting logic embedded in their platform. In this case, the SAP netting logic should be fully disabled and all invoices should be paid out gross. Careful considerations should be taken when trying to reconcile the SCF settled items report as mentioned in step 4 though.
- Payment run posting: When executing the SAP payment run it is possible to either clear the underlying invoices on payment run date or to leave them open until invoice due date. If the invoices are kept open, they will be cleared once the SCF reporting is imported in SAP (see step 4). This is decision-driven by the accounting team and depends on where the open items should be rolling up in the balance sheet (i.e. payable against the vendor or payable against the SCF supplier).
- Payment file transfer: At this step, the payment file will be generated and sent to the SCF supplier. The design considerations are dependent on the SCF supplier’s capabilities and should be considered carefully while selecting an appropriate partner.
- File format: Most often we advise to implement a best practice payment file format like ISO pain.001. This format has a logical structure, is supported out of the box in SAP, while most SCF partners will support it too.
- Interface technology: The payment files need to be transferred into the SCF platform. This can be done via a multitude of ways; i.e. manual upload, automatically via SWIFT or Host2Host. This decision is often driven internally. Often the existing payment infrastructure can be leveraged for SCF payments as well.
- Remittance information: By following ISO pain.001 standard, the remittance information that remits which invoices are paid and cleared, can be provided in a structured format, irrespective of the volume of invoices that got cleared. This ensures that the beneficiary exactly knows which invoices were paid under this payment. Alternatively, an unstructured remittance can be provided but this often is limited to 140 characters maximum.
- Payment status reporting: Some SCF supplier will support some form of payment status reporting to provide immediate feedback on whether the payments were processed correctly. These reports can be imported in SAP; SAP can subsequently send notifications of payment errors to the key users who can then take corrective actions.
- SCF payment clearing reporting: At this step, the SCF platform will send back a report that contains information on all the cleared payments and underlying invoices for that specific due date. Most typically, these reports are imported in SAP to auto reconcile against the open items sitting in the administration.
- Auto import: If import of the statement into SAP is required, the report should be in one of SAP’s standard-supported formats like MT940 or CAMT.053.
- Auto reconciliation: If auto reconciliation of this report against line items in SAP is required, the reports line items should be matchable with the open line items in the SAP administration. Secondly, a pre-agreed identifier needs to be reported such that SAP can find the open item automatically (i.e. invoice reference, document number, end2endId, etc.). Very careful alignment is needed here, as slight differences in structure in the administration versus the reporting structure of SCF can lead to failed auto reconciliation and tedious manual post processing.
- Pay out to the beneficiary: Onboarded vendors can access the SCF platform and report on the pending payments and invoices. The vendor has the flexibility to have the invoices paid out early (before due date) by accepting the deduction of a pre-agreed fee. The SCF provider should ensure payment is made.
- Debiting bank account: At due date of the original invoice, the SCF provider will want to receive the funds.
- Payment initiation vs direct debit: The payment of funds can in principle be handled via two processes; either the SCF customer initiates the payment himself, or an agreement is made that the SCF provider direct debits the account automatically.
- Lump debit vs line items: Most typically, one would make a lump payment (or direct debit) of the total amount of all invoices due on that day. Some SCF providers may support line by line direct debiting although this might result in high transaction costs. Line by line debiting might be beneficial for the auto reconciliation process in SAP though (see step 7)
- Bank statement reporting: The bank statement of the cash account will be received and imported into SAP. Most often, the statements are received over the existing banking interface.
- Bank statement processing: Based on pre-configured posting rules and reconciliation algorithms in SAP, the open items in the administration are cleared and the bank balance is updated appropriately.
To conclude
If the appropriate SCF provider is selected and the process design and implementation in SAP is sound, the benefits of SCF can be achieved without introducing new processes and therefore creating a burden on the existing accounts payable team. It is fully possible to integrate the SCF processes with the regular accounts payable payments processes without adding additional manual process steps or cumbersome workarounds.
For more information, contact Ivo Postma at +31 88 991 02 00.
WACC: Practical Guide for Strategic Decision- Making – Part 8

Vendor Supply Chain Finance (SCF) constitutes the transfer of a (trade) payable position towards the SCF underwriter (i.e. the bank). The beneficiary of the payment can then decide either to receive an invoice payment on due date or to receive the funds before, at the cost of a pre-determined fee.
The WACC is a calculation of the ‘after-tax’ cost of capital where the tax treatment for each capital component is different. In most countries, the cost of debt is tax deductible while the cost of equity isn’t, for hybrids this depends on each case.
Some countries offer beneficial tax opportunities that can result in an increase of operational cash flows or a reduction of the WACC.
This article elaborates on the impact of tax regulation on the WACC and argues that the calculation of the WACC for Belgian financing structures needs to be revised. Furthermore, this article outlines practical strategies for utilizing tax opportunities that can create shareholder value.
The eighth and last article in this series on the weighted average cost of capital (WACC) discusses how to increase shareholder value by utilizing tax opportunities. Generally, shareholder value can be created by either:
- Increasing operational cash flows, which is similar to increasing the net operating profit ‘after-tax’ (NOPAT);
- or Reducing the ‘after-tax’ WACC.
This article starts by focusing on the relationship between the WACC and tax. Best market practice is to reflect the actual environment in which a company operates, therefore, the general WACC equation needs to be revised according to local tax regulations. We will also outline strategies for utilizing tax opportunities that can create shareholder value. A reduction in the effective tax rate and in the cash taxes paid can be achieved through a number of different techniques.
Relationship Between WACC and Tax
Within their treasury and finance activities, multinational companies could trigger a number of different taxes, such as corporate income tax, capital gains tax, value-added tax, withholding tax and stamp or capital duties. Whether one or more of these taxes will be applicable depends on country specific tax regulations. This article will mainly focus on corporate tax related to the WACC. The tax treatment for the different capital components is different. In most countries, the cost of debt is tax deductible while the cost of equity isn’t (for hybrids this depends on each case).
The corporate tax rate in the general WACC equation, discussed in the first article of this series (see Part 1: Is Estimating the WACC Like Interpreting a Piece of Art?), is applicable to debt financing. It is appropriate, however, to take into consideration the fact that several countries apply thin capitalization rules that may restrict tax deductibility of interest expenses to a maximum leverage.
Furthermore, in some countries, expenses on hybrid capital could be tax deductible as well. In this case the corporate tax rate should also be applied to hybrid financing and the WACC equation should be changed accordingly.
Finally, corporate tax regulation can also have a positive impact on the cost of equity. For example, Belgium has recently introduced a system of notional interest deduction, providing a tax deduction for the cost of equity (this is discussed further in the section below: Notional Interest Deduction in Belgium).
As a result of the factors discussed above, we believe that the ‘after-tax’ capital components in the estimation of the WACC need to be revised for country specific tax regulations.
Revised WACC Formula
In other coverage of this subject, a distinction is made between the ‘after-tax’ and ‘pre-tax’ WACC, which is illustrated by the following general formula:
WACCPT = WACCAT / [1 – TC]
WACCAT : Weighted average cost of capital after-tax
WACCPT : Weighted average cost of capital pre-tax
TC : Corporate income tax rate
In this formula the ‘after-tax’ WACC is grossed-up by the corporate tax rate to generate the ‘pre-tax’ WACC. The correct corporate tax rate for estimating the WACC is the marginal tax rate for the future! If a company is profitable for a long time into the future, then the tax rate for the company will probably be the highest marginal statutory tax rate.
However, if a company is loss making then there are no profits against which to offset the interest. The effective tax rate is therefore uncertain because of volatility in operating profits and a potential loss carry back or forward. For this reason the effective tax rate may be lower than the statutory tax rate. Consequently, it may be useful to calculate multiple historical effective tax rates for a company. The effective tax rate is calculated as the actual taxes paid divided by earnings before taxes.
Best market practice is to calculate these rates for the past five to ten years. If the past historical effective rate is lower than the marginal statutory tax rate, this may be a good reason for using that lower rate in the assumptions for estimating the WACC.
This article focuses on the impact of corporate tax on the WACC but in a different way than previously discussed before. The following formula defines the ‘after-tax’ WACC as a combination of the WACC ‘without tax advantage’ and a ‘tax advantage’ component:
WACCAT = WACCWTA – TA
WACCAT : Weighted average cost of capital after-tax
WACCWTA : Weighted average cost of capital without tax advantage
TA : Tax advantage related to interest-bearing debt, common equity and/or hybrid capital
Please note that the ‘pre-tax’ WACC is not equal to the WACC ‘without tax advantage’. The main difference is the tax adjustment in the cost of equity component in the pre-tax calculation. As a result, we prefer to state the formula in a different way, which makes it easier to reflect not only tax advantages on interestbearing debt, but also potential tax advantages on common equity or hybrid capital.
The applicable tax advantage component will be different per country, depending on local tax regulations. An application of this revised WACC formula will be further explained in a case study on notional interest deduction in Belgium.
Notional Interest Deduction in Belgium
Recently, Belgium introduced a system of notional interest deduction that provides a tax deduction for the cost of equity. The ‘after-tax’ WACC formula, as mentioned earlier, can be applied to formulate the revised WACC equation in Belgium:
WACCAT = WACCWTA – TA
WACCWTA : Weighted average cost of capital without tax advantage, formulated as follows: RD x DM / [DM+EM] + RE x EM / [DM+EM] TA : Tax advantage related to interest-bearing debt and common equity, formulated as follows: TC x [RD x DM + RN x EB] / [DM+EM] TC : Corporate tax rate in Belgium
RD : Cost of interest-bearing debt
RE : Cost of common equity
RN : Notional interest deduction
DM : Market value of interest-bearing debt
EM : Market value of equity
EB : Adjusted book value of equity
The statutory corporate tax rate in Belgium is 33.99%. The revised WACC formula contains an additional tax deduction component of [RN x EB], which represents a notional interest deduction on the adjusted book value of equity. The notional interest deduction can result in an effective tax rate, for example, intercompany finance activities of around 2-6%.
The notional interest is calculated based on the annual average of the monthly published rates of the long-term Belgian government bonds (10-year OLO) of the previous year. This indicates that the real cost of equity, e.g. partly represented by distributed dividends, is not deductible but a notional risk-free component.
The adjusted book value of equity qualifies as the basis for the tax deduction. The appropriate value is calculated as the total equity in the opening balance sheet of the taxable period under Belgian GAAP, which includes retained earnings, with some adjustments to avoid double use and abuse. This indicates that the value of equity, as the basis for the tax deduction, is not the market value but is limited to an adjusted book value.
As a result, Belgium offers a beneficial tax opportunity that can result in an increase of shareholder value by reducing the ‘after-tax’ WACC. Belgium is, therefore, on the short-list for many companies seeking a tax-efficient location for their treasury and finance activities. Furthermore, the notional interest deduction enables strategies for optimizing the capital structure or developing structured finance instruments.
How to Utilize Tax Opportunities?
This article illustrates the fact that managing the ‘after-tax’ WACC is a combined strategy of minimizing the WACC ‘without tax advantages’ and, at the same time, maximizing tax advantages. A reduction in the effective tax rate and in the cash taxes paid can be achieved through a number of different techniques. Most techniques have the objective to obtain an interest deduction in one country, while the corresponding income is taxed at a lower rate in another country. This is illustrated by the following two examples.
The first example concerns a multinational company that can take advantage of a tax rate arbitrage obtained through funding an operating company from a country with a lower tax rate than the country of this operating company. For this reason, many multinational companies select a tax-efficient location for their holding or finance company and optimize their transfer prices.
Secondly, country and/or company specific hybrid capital can be structured, which would be treated differently by the country in which the borrowing company is located than it would be treated by the country in which the lending company is located. The potential advantage of this strategy is that the expense is treated as interest in the borrower’s country and is therefore deductible for tax purposes.
However, at the same time, the country in which the lender is located would treat the corresponding income either as a capital receipt, which is not taxable or it can be offset by capital losses or other items; or as dividend income, which is either exempt or covered by a credit for the foreign taxes paid. As a result, it is beneficial to optimize the capital structure and develop structured finance instruments.
There is a range of different strategies that may be used to achieve tax advantages, depending upon the particular profile of a multinational company. Choosing the strategy that will be most effective depends on a number of factors, such as the operating structure, the tax profile and the repatriation policy of a company. Whatever strategy is chosen, a number of commercial aspects will be paramount. The company will need to align its tax planning strategies with its business drivers and needs.
The following section highlights four practical strategies that illustrate how potential tax advantages and, as a consequence, an increase in shareholder value can be achieved by:
- Selecting a tax-efficient location.
- Optimizing the capital structure.
- Developing structured finance instruments.
- Optimizing transfer prices.
Selecting a tax-efficient location
Many companies have centralized their treasury and finance activities in a holding or separate finance company. Best market practice is that the holding or finance company will act as an in-house bank to all operating companies. The benefit of a finance company, in comparison to a holding, is that it is relatively easy to re-locate to a tax-efficient location. Of course, there are a number of tax issues that affect the choice of location. Selecting an appropriate jurisdiction for the holding or finance company is critical in implementing a tax-efficient group financing structure.
Before deciding to select a tax-efficient location, a number of issues must be considered. First of all, whether the group finance activities generate enough profit to merit re-locating to a low-tax jurisdiction. Secondly, re-locating activities affects the whole organization because it is required that certain activities will be carried out at the chosen location, which means that specific substance requirements, e.g. minimum number of employees, have to be met. Finally, major attention has to be paid to compliance with legal and tax regulation and a proper analysis of tax-efficient exit strategies. It is advisable to include all this information in a detailed business case to support decision-making.
When selecting an appropriate jurisdiction, several tax factors should be considered including, but not limited to, the following: The applicable taxes, the level of taxation and the availability of special group financing facilities that can reduce the effective tax rate.
- The availability of tax rulings to obtain more certainty in advance.
- Whether the jurisdiction has an expansive tax treaty network.
- Whether dividends received are subject to a participation exemption or similar exemption.
- Whether interest payments are restricted by a thin capitalization rule.
- Whether a certain controlled foreign company (CFC) rule will absorb the potential benefit of the chosen jurisdiction.
Other important factors include the financial infrastructure, the availability of skilled labor, living conditions for expatriates, logistics and communication, and the level of operating costs.
Based on the aforementioned criteria, a selection of attractive countries for locating group finance activities is listed below:
Belgium: In 2006, Belgium introduced a notional interest deduction as an alternative for the ‘Belgian Co-ordination Centres’. This regime allows taxefficient equity funding of Belgian resident companies and Belgian branches of non-resident companies. As a result, the effective tax rate may be around 2-6%.
Ireland: Ireland has introduced an attractive alternative to the previous ‘IFSC regime’ by lowering the corporate income tax rate for active trading profits to 12.5%. Several treasury and finance activities can be structured easily to generate active trading profit taxed at this low tax rate.
Switzerland: Using a Swiss finance branch structure can reduce the effective tax rate here. These structures are used by companies in Luxembourg. The benefits of this structure include low taxation at federal and cantonal level based on a favorable tax ruling – a so called tax holiday – which may reduce the effective tax rate to even less than 2%.
The Netherlands: Recently, the Netherlands proposed an optional tax regulation, the group interest box, which is a special regime for the net balance of intercompany interest within a group, taxed at a rate of 5%. This regulation should serve as a substitute for the previous ‘Dutch Finance Company’.
Optimizing the capital structure
One way to achieve tax advantages is by optimizing not only the capital structure of the holding or finance company but that of the operating companies as well. Best market practice is to take into account the following tax elements:
Thin capitalization: When a group relationship enables a company to take on higher levels of debt than a third party would lend, this is called thin capitalization. A group may decide to introduce excess debt for a number of reasons. For example, a holding or finance company may wish to extract profits tax-efficiently, or may look to increase the interest costs of an operating company to shelter taxable profits.
To restrict these situations, several countries have introduced thin capitalization rules. These rules can have a substantial impact on the deductibility of interest on intercompany loans.
Withholding tax: Interest and dividend payments can be subject to withholding tax, although in many countries dividends are exempt from withholding tax. As a result, high rates of withholding tax on interest can make traditional debt financing unattractive. However, tax treaties can reduce withholding tax. As a consequence, many companies choose a jurisdiction with a broad network of tax treaties.
Repatriation of cash: If a company has decided to centralize its group financing, then it is relevant to repatriate cash that can be used for intercompany financing. In most countries, repatriation of cash can be performed through dividends, intercompany loans or back-to-back loans. It depends on each country what will be the most tax-efficient method.
Developing structured finance instruments
Developing structured finance instruments can be interesting for funding or investment activities. Examples of structured finance instruments are:
Hybrid capital instruments: Hybrid capital combines certain elements of debt and equity. Examples are preferred equity, convertible bonds, subordinated debt and index-linked bonds. For the issuers, hybrid securities can combine the best features of both debt and equity: tax deductibility for coupon payments, reduction in the overall cost of capital and strengthening of the credit rating.
Tax sparing investment products: To encourage investments in their countries, some countries forgive all or part of the withholding taxes that would normally be paid by a company. This practice is known as tax sparing. Certain tax treaties consider spared taxes as having been paid for purposes of calculating foreign tax deductions and credits. This is, for example, the case in the tax treaty between The Netherlands with Brazil, which enables the structuring of tax-efficient investment products.
Double-dip lease constructions: A double-dip lease construction is a cross-border lease in which the different rules of the lessor’s and lessee’s countries let both parties be treated as the owner of the leased equipment for tax purposes. As a result of this, a double interest deduction is achieved, also called double dipping.
Optimizing transfer prices
Transfer pricing is generally recognized as one of the key tax issues facing multinational companies today. Transfer pricing rules are applicable on intercompany financing activities and the provision of other treasury and finance services, e.g. the operation of cash pooling arrangements or providing hedging advice.
Currently, in many countries, tax authorities require that intercompany loans have terms and conditions on an arm’s length basis and are properly documented. However, in a number of countries, it is still possible to agree on an advance tax ruling for intercompany finance conditions.
Several companies apply interest rates on intercompany loans, being the same rate as an external loan or an average rate of the borrowings of the holding or finance company. When we apply the basic condition of transfer pricing to an intercompany loan, this would require setting the interest rate of this loan equal to the rate at which the borrower could raise debt from a third party.
In certain circumstances, this may be at the same or lower rate than the holding or finance company could borrow but, in many cases, it will be higher. Therefore, whether this is a potential benefit depends on the objectives of a company. If the objective is to repatriate cash, then a higher rate may be beneficial.
Transfer pricing requires the interest rate of an intercompany loan to be backed up by third-party evidence, however, in many situations this may be difficult to obtain. Therefore, best market practice is to develop an internal credit rating model to assess the creditworthiness of operating companies.
An internal credit rating can be used to define the applicable intercompany credit spread that should be properly documented in an intercompany loan document. Furthermore, all other terms and conditions should be included in this document as well, such as, but not limited to, clauses on the definition of the benchmark interest rate, currency, repayment, default and termination.
Conclusion
This article began with a look at the relationship between the WACC and tax. Best market practice is to revise the WACC equation for local tax regulations. In addition, this article has outlined strategies for utilizing tax opportunities that can create shareholder value. A reduction in the effective tax rate, and in the cash taxes paid, can be achieved through a number of different techniques.
This eight-part series discussed the WACC from different perspectives and how shareholder value can be created by strategic decision-making in one of the following areas:
Business decisions: The type of business has, among others, a major impact on the growth potential of a company, the cyclicality of operational cash flows and the volume and profit margins of sales. This influences the WACC through the level of the unlevered beta.
Treasury and finance decisions: Activities in the area of treasury management, risk management and corporate finance can have a major impact on operational cash flows, capital structure and the WACC.
Tax decisions: Utilizing tax opportunities can create shareholder value. Potential tax advantages can be, among others, achieved by selecting a taxefficient location for treasury and finance activities, optimizing the capital structure, developing structured finance instruments and optimizing transfer prices.
Based on this overview we can conclude that the WACC is one of the most critical parameters in strategic decision-making.
WACC: Practical Guide for Strategic Decision- Making – Part 3
Vendor Supply Chain Finance (SCF) constitutes the transfer of a (trade) payable position towards the SCF underwriter (i.e. the bank). The beneficiary of the payment can then decide either to receive an invoice payment on due date or to receive the funds before, at the cost of a pre-determined fee.
Hybrids are financial instruments that combine certain elements of debt and equity. Examples are preferred equity, convertible bonds, subordinated debt and index-linked bonds. For the issuers, hybrid securities can combine the best features of both debt and equity: tax deductibility for coupon payments, reduction in the overall cost of capital, and a strengthening of senior credit ratings.
This article describes the reasons behind the increased interest among corporates in using hybrid instruments to optimize their capital structure and the impact of hybrids on the WACC and shareholder value. It also takes a look at treatment by accountants, tax regulation and rating agencies.
Over €8bn of capital was raised in 2005 by corporates in Europe in the hybrid category, according to The Treasurer, April 2006. Over the past decade, it has primarily been financial institutions who have been frequent issuers of hybrids to optimize their capital structure. However, corporates are now also increasingly tapping this segment.
This growing interest can be explained both by new insights regarding the accounting and rating benefits of these instruments, as well as an increased appetite by investors who are drawn by the opportunity to make an additional yield in the current low-interest rate and credit spreads environment.
Accounting Treatment
A hybrid instrument can be structured to achieve equity treatment from an IFRS perspective. IAS 32 (Financial Instruments: Disclosure and Presentation) requires a hybrid to have optional payment for all coupons and that the instrument should have no defined economic maturity.
If the instrument is structured to achieve equity accounting, the coupon is accounted for as a ‘preferred’ dividend distribution. This way, there is no interest expense and the reported net income is not affected. Likewise, earnings per share (EPS) are unchanged as for the purposes of the EPS calculation, preferred dividends are deducted from earnings.
However, if the instrument is treated as equity there is no IAS 39 (Financial Instruments: Recognition and Measurement) hedge accounting available for any associated swaps. The resulting P&L volatility may lead issuers to choose to have the instruments structured so that they are accounted for as debt.
View of Rating Agencies
Credit rating agency Moody’s published its Tool Kit for Assessing Hybrid Securities, a framework to determine the relative debt and equity characteristics of hybrid instruments, in December 1999. Since then, the rating agency has assessed hundreds of instruments, positioning them along the debtequity continuum in baskets from A (more debtlike) to E (more equity-like). Each basket on this continuum translates into the following percentages of equity and debt for the purpose of financial ratio calculations:
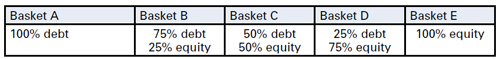
To illustrate, a €100m hybrid placed by Moody’s in Basket D will result in a €75m increase in equity and a €25m increase in debt. All relevant ratios, which include either debt or equity, will be adjusted accordingly by the agency.
In February 2005, Moody’s announced its revised methodology for the category, significantly increasing the acknowledgement of the equity-like features of the instruments and rewarding higher equitycredit to structures which meet specifically required features, particularly regarding subordination, coupon deferral and permanence in the capital structure. Moody’s revision has made it possible for corporates to achieve meaningful equity-credit of 50 per cent or more, and has prompted increased corporate activity in this area.
Standard & Poor’s and Fitch Ratings have also clarified their thinking on hybrids, and the three big rating agencies are now roughly in line in their treatment of hybrid capital.
Tax Treatment
The recent flow of corporate transactions has started in Europe thanks to favourable tax legislation in several European countries that makes it easier than in the US to develop new hybrid products that both improve rating treatment and qualify as debt for tax purposes. In the UK, however, the corporate tax law contains several provisions that challenge the tax deduction on interest paid on debt with ‘excessive’ equity characteristics.
The potential to achieve a more robust tax opinion may lead issuers choosing to have the instrument structured to be accounted for as debt. In article seven of this series on the WACC, ‘Reducing the WACC by Utilizing Tax Opportunities’; more tax angles related to this topic will be covered.
Impact on the WACC and Shareholder Value
Optimizing the WACC and maximizing returns to shareholders is a top priority for corporate treasurers.
Hybrid instruments strengthen the capital base by creating a buffer between senior creditors and shareholders. Hybrid capital offers an opportunity, when correctly structured and used as a substitute for more expensive and less flexible common equity, to lower the WACC.
Hybrid issues typically price between 50 and 200 basis points over senior debt. This means that the marginal cost of funding can be significantly lower than funding achieved through traditional debt and equity funding sources. This cost-effectiveness can be illustrated with the following example.
A company wants to raise €100m of capital with half of it qualifying as equity for rating purposes. It has, simply put, two options:
- €50m each of traditional debt and equity.
- €100m of hybrid capital with an equity treatment by the rating agencies of 50 per cent.
We assume the following rates apply to this company:
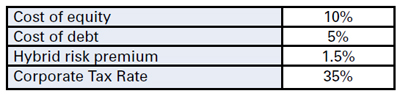
The marginal cost of capital for option 1 (traditional capital) would be:
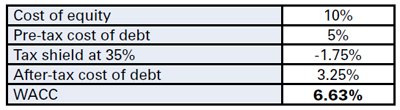
The marginal cost of capital for option 2 (hybrid capital) would be
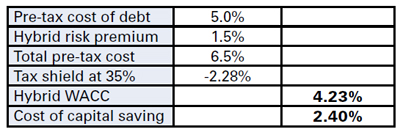
Please note: this calculation assumes full tax deductibility of the hybrid instrument.
By issuing hybrid capital with 50 per cent equity treatment the company achieves a cost of capital saving of 2.4 per cent. The advantage could be bigger still with 75 per cent equity treatment. The example shows that when hybrids are applied to substitute expensive equity, they offer an opportunity to lower the WACC of the issuer.
Conclusion
Hybrids offer corporates the opportunity to strengthen or maintain their credit ratings and balance sheet ratios, while funding acquisitions, share repurchases or pension deficits.
The economics achievable in current markets are an additional driving factor in the continuing rise in the number of hybrid instruments issued by corporates.
As a non-dilutive instrument, hybrid capital is particularly suitable for issuers who have limited access to equity or have dilution concerns. Raising hybrid capital offers the opportunity to lower the marginal cost of capital and therefore increase the return to shareholders.
To return to the question in the title of this article, hybrid capital can indeed be considered cheap equity. The additional cost on top of the normal cost of senior debt does not preclude the potential overall reduction in the cost of capital.
For companies with sufficient debt capacity within their current ratings, however, raising cheaper financing (not only in terms of spreads but also in terms of upfront fees) through traditional debt markets could still be a more attractive option. Possible changes in tax regimes and rating methodologies should also be taken into account when deciding on which funding instrument to choose.
WACC: Practical Guide for Strategic Decision- Making – Part 6

Vendor Supply Chain Finance (SCF) constitutes the transfer of a (trade) payable position towards the SCF underwriter (i.e. the bank). The beneficiary of the payment can then decide either to receive an invoice payment on due date or to receive the funds before, at the cost of a pre-determined fee.
One can think of inflation, a lack of reliable and consistent information, illiquid and ineff icient financial markets and sovereign risks. The article also discusses how the WACC application for evaluation of investment appraisals in emerging markets has to be done with care.
Best Practice for WACC Estimation in Emerging Markets
The prospect of emerging markets, mainly driven by high growth potential, draws the attention of a corporate in search for investment opportunities. But often there is a lack of correct appraisal of both these investment opportunities, and the risks involved with the execution of the projects.
The CFO and treasurer play a vital role in assessing the quality of the investment proposals by setting the appropriate hurdle rate for project selections, to make sure shareholder value will be created given the risks involved.
The first article in the WACC series extensively describes the components that comprise the weighted average cost of capital and how to estimate the WACC.
Part six of the WACC guide will now show methods of how to deal with, and quantify, risks and features of emerging markets when estimating the WACC for foreign investment decisions and appraisals.
Which Discount Rate to Use?
One question that a company investigating a foreign investment in an emerging market should ask is: which hurdle rate should be used? Should a separate project WACC be calculated for this operation? Or, can just the corporate WACC be applied, added with a premium or discount to compensate for different inflation levels?
There are basically three different types of discount rate:
The first method is to use the corporate WACC. Supporters in favor of using one single corporate WACC argue that a multinational company can be considered as a portfolio of multiple (global) investments and therefore each investment can be treated with the same cost of capital, which reflects the company’s total aggregated portfolio risks.
This approach acknowledges the advantage of a multinational, which is able to diversify country specific risks somewhat when volatilities in different countries are partly off-set by each other due to their low correlation. The appropriate WACC for operating in an emerging market this way is the corporate WACC adjusted for the marginal contributing effect of the operation in the emerging market (based on the specific financial and operational leverage). When calculating of the nominal WACC in the foreign currency, a compensation for the different levels of inflation between the home and foreign currency will have to be added or deducted.
The second method is to consider each investment project as a stand-alone investment and value each of them according to a local WACC that reflects the risks of the local country and project. In that respect there is one major argument that demonstrates the need to calculate an individual WACC for an emerging market – emerging markets are, to some extent, non-integrated markets (not integrated with the global market). It is therefore said to be a segmented market.
The characteristic of a segmented market is that real returns (compensated for different levels of inflation) are also determined by domestic risk factors. These are characterized by inefficiencies caused by regulatory, legal and tax barriers in emerging markets.
These inefficiencies have an impact on the cost of equity. In such a case, the company determines a local project WACC, with a local cost of equity the measure of a country’s equity risk levels for the operations in the emerging markets, rather than the corporate WACC.
The third method is a ‘middle-of-the-road’ approach, which acknowledges the need to account for the additional sovereign risk factors in the country of the investment in the WACC. This is achieved by simply adding a sovereign risk premium to the corporate WACC as a markup.
Sovereign risk represents the country risk and the credit risk of the country. Simply put, the sovereign risk premium is the difference between the yield of the risk-free triple-A rated government bond and a bond issued by the local government (with the sovereign risk embedded in it) minus the inflation differential of the two currencies involved. If local bonds are issued in US$, the inflation differential should not be deducted.
The major disadvantage of adding a sovereign risk premium is that it primarily reflects the sovereign default risk and can hence serve little to quantify the exact measure of equity risk in that country. To some extent it will cover the additional market risk premium (MRP) for an emerging market, but not the total MRP.
The preferred method out of the three presented is therefore the second method that calculates a separate cost of equity and consequently a separate local WACC for the investment in the emerging market.
How is Risk Reflected in the WACC and in Cash Flow?
We have established that the preferred discount rate requires a separate WACC to be calculated for investments in emerging markets to reflect the additional risks.
The question is, which of all these additional risk factors in emerging markets are included in the cost of equity (Re) and the cost of debt (Rd) of the WACC, and which risk factors should be reflected in the projected cash flows?
Best practice is that operational risk, which is diversifiable (non-systematic), should be accounted for in the cash flow projections. Industry and country risk, which can not be eliminated by diversification (systematic risk), should be incorporated in the WACC. The industry risk is captured in the beta of the company (adjusted for the capital structure of the company).
Typical non-systematic risks include many operational challenges associated with investments in emerging markets. Included in the cash flow will also be incremental costs associated with investments in emerging markets, like insurance costs, legal costs and costs for currency repatriation and hedging.
Typical systematic risks in an emerging market include default, political and country specific economic risks and, in case of equity investments, one will also have to account for inefficient markets.
Expected inflation should be treated separately from the aforementioned sovereign risk and market inefficiencies. Whether inflation should be taken into account depends on whether the WACC is calculated in the base currency of the company or in the local currency. In the case of the latter the inflation differential will have to be added on top of the sovereign risk premium.
It is important to mention that inflation rates should be included in the discount rate as well as in the cash flow. Numerator and denominator calculations should be based on the same inflation rates, to avoid any mismatches.
Specific Risk Adjustments in the WACC
Calculating the WACC in developed markets can be a difficult exercise, but the calculation in emerging market environments is even more challenging. As well as the different and additional risks mentioned, emerging markets are also less developed, liquid and consequently less efficient. In other words, reliable information for the determination of the WACC will be harder to obtain. The next section will discuss the specific adjustments for additional risks and uncertainties in the components that comprise the WACC, which need to be taken into account
1. Cost of equity (Re):
The first component of the WACC is the cost of equity. In developed markets the capital asset pricing model (CAPM) is mostly applied to estimate the cost of equity of an investment. But CAPM has one important underlying theoretical assumption, which is that it assumes that markets are fully integrated and efficient. However, there is evidence to conclude that emerging markets are not efficient.
For fully segmented emerging markets it can even be argued that CAPM is unsuitable for estimating the cost of equity, as the equity prices are not determined by equilibrium situations due to inefficiencies and poor liquidity. However, since there is a lack of alternative methodologies to determine Re in emerging markets, CAPM is still mostly applied. In order to make CAPM suitable for emerging markets, the following factors in CAPM should be taken with care and will have to be adjusted to represent the additional risks of the partly segmented emerging markets:
Risk-free rate (Rf):
In developed markets, the 10 year government bond is the basis for CAPM calculation. But since emerging markets have a rating below triple-A, the government bonds themselves are not risk-free and they incorporate a sovereign risk premium. Another issue, which especially exists in high inflation environments, is that long-term government bonds are usually unavailable.
Beta (β):
The β in the CAPM equation provides a quantification of the sensitivity (systematic risk) of an investment project to market movements. When a beta is unknown, it is hard to properly determine in emerging markets. Sometimes companies or industries beta’s are not calculated locally, since it is likely that betas and stock returns are less correlated due to a lack of information and market inefficiencies. But there is an alternative, namely to use the global industry β, re-levered to the company’s appropriate target leverage.
Market risk premium (MRP):
The MRP is the extra return that the stock market provides over the risk-free rate to compensate for market risk.
In developed integrated markets historically derived market risk premium is estimated to be around 5%. The problem in emerging markets is that reliable data records to determine the return rates are unavailable in many cases.
Then, once you have determined the historic risk premium based on the recorded data, you also have to question whether these records are a reliable predictor for the long-term future.
Historic averages in emerging markets are often influenced by periods of high volatility. In case that historic data series show periods of extreme volatility in premiums, a downward adjustment is recommendable. Therefore these premiums should be taken with care and the historic riskpremium should subsequently be adjusted according to the prospects. There is an alternative approach often used to determine the additional market risk premium for an emerging market.
Take the market risk premium of the developed domestic market and add the sovereign risk premium, multiplied by the ratio of the standard deviation on returns of the country’s equity market, divided by the standard deviation on the local government bond.
2. Cost of debt (Rd):
The cost of debt is the second component in the WACC. It is the marginal cost that needs to be offered to raise additional capital in the form of debt, including the issuance costs of the concerning debt. Additionally, the local capital market for debt in an emerging market will show inefficiencies, and is often regulated. Consequently, in case local debt sources are used, the actual cost of debt can be substantially different to what it would have been according to the company’s credit rating.
Reliable long-term interest rates in emerging markets are rarely available and, as a result, only short-term debt will be available as a reference. Sometimes in a high inflation environment, debt instruments are dollarized or inflation indexed.
In some emerging countries it might even be impossible to obtain debt financing. This implies that a company can only invest through equity.
The chosen capital structure in an emerging market is rarely based on a free will. Restrictions to foreign ownership and a lack of availability of debt instruments or borrowing restrictions from local banks will all have an impact on the actual capital structure.
Project Appraisals
The WACC is widely applied as the discount rate to measure the quality of investments with help of the discounted cash flow method (DCF). The WACC is the proper discount rate for discounting future cash flows into a present value.
In normal circumstances, a company must seek to make a return on its investments in excess of, or at least equal to, the WACC (or a positive net present value).
The DCF-method applied for valuations in emerging markets deviates from the same method in developed markets, as in emerging markets you also have to deal with additional risks that may affect the certainty of future cash flows. It is therefore recommended to model a scenario or sensitivity based DCF for emerging market valuations. This should explicitly incorporate the non-systematic risks involved in the operation in the emerging market.
The impact of future cash flow risk should be carefully assessed, as some risks do not apply equally to industries or companies. An example can be the depreciation or appreciation of a currency. An importing company will be impacted differently by an appreciation than an exporting company.
Apart from exchange rates, the development of other economic variables can heavily impact future cash flow. This can include inflation, GDP and interest. In order to identify the impact of these variables, one can conduct a sensitivity analysis.
Next to the systematic and the non-systematic risks discussed earlier, another important feature of emerging markets are the often high levels of inflation.
There are in principle two methods how to cope with inflation in a DCF-calculation:
1. Nominal prices method:
In this method the inflation is both accounted for in the cash flows and in the discount rate.
2. Real prices method:
This approach takes into account the financial statements in real terms and consequently discounts the cash flows in real terms against the real discount rate.
The major benefit here is that it is somewhat easier to forecast future cash flows in real terms than in nominal terms, especially in environments that face high and variable levels of inflation. It is sometimes said that when inflation levels reach double digit figures it is preferable to model the forecast on real terms. Obviously when cash flows are calculated in real terms, the discount rate should be on real terms as well to avoid a mismatch.
Exchange rates are another element that need to be taken into account in a nominal forecast. In the case of imports and exports of goods in foreign currencies, there are exchange rates involved in the valuation.
You will have to take into account that the exchange rates in your valuations are impacted by the inflation rates among other items (according to purchasing power theory), although exchange rates might only be adjusted for the interest differential in the longrun.
A single discount factor (WACC) for DCF calculation in emerging markets will lead to an over-simplistification that ignores the dynamics of an emerging market. In emerging markets, with high levels of uncertainty and variability of inflation and capital structure, it’s recommended to calculate a nominal WACC per year reflecting the developments in inflation and capital structure and risk premiums. The level of inflation applied in the WACC should also be reflected in the discounted cash flows.
Conclusions
The major distinction between developed markets and emerging markets is the increased level of risk, caused by macro economic variables, volatility and inefficiencies in capital markets and political situations. There are many different ways to incorporate and account for these additional risks.
A mark-up on the domestic corporate WACC, for the sovereign risks and inflation differential, will not be sufficient to calculate the required compensation for the additional equity risks involved. Best practice is therefore to calculate a local WACC, which not only fully reflects the company specific risks but also the equity and debt market risk of the country of investment. The different components of the WACC will have to be adjusted for the risks involved.
Since emerging markets are rapidly changing, the WACC will consequently also change over time. A point estimation of the WACC should therefore be taken with care, especially when used in DCF’s for project appraisals.
The CFO and treasurer will play an important role in the strategic process of project analysis in emerging markets, not only by quantifying the specific risks involved with investment in a particular country in the estimation of the WACC, but also by determining and quantifying the risks on the foreign cash flows.
WACC: Practical Guide for Strategic Decision- Making – Part 5
Vendor Supply Chain Finance (SCF) constitutes the transfer of a (trade) payable position towards the SCF underwriter (i.e. the bank). The beneficiary of the payment can then decide either to receive an invoice payment on due date or to receive the funds before, at the cost of a pre-determined fee.
Treasury, as the custodian of risk management, could reinforce its role as an internal consultant on cash flow and help management prepare and substantiate decisions in allocating limited resources within the company.
In business, success and failure are never far apart. Among the many different options available, management has to select those initiatives that can be managed with (limited) corporate resources in terms of capital, people and time available. The aim of the game is to maximize shareholder or stakeholder value.
Estimating the potential for the creation of shareholder value or economic ‘value add’ of a project is not rocket science. Any project with a positive net present value (NPV), where the cash flow is discounted at the weighted average cost of capital (WACC), should increase shareholder or economic value. However, experienced business managers know that in reality this is not that easy.
Management has always tried to include some objectivity in project selection in order to avoid personal risk. There are a wide range of methods and models for calculating and ranking the NPVs of projects under review, but most models are a variation on discounted cash flow or real option methods. While many of these are complex and cumbersome to use, if not ineffective in day-to-day business, others in contrast are far too simple.
The model selected will affect the estimated shareholder value created as well as the ranking of projects. Without careful examination, a model or method could provide a false objective measure to determine the value created. This is not because the formulae are incorrect, but because the input assumptions applied by the analyst are often taken for granted and not properly understood.
This article examines to what extent input, assumptions and models used for project selection could create a biased opinion of the creation of shareholder value. Companies should also make sure that the investment proposals allow management to compare individual projects and select those that make the best contribution to the creation of shareholder value. Treasury, as a custodian of risk management, could be the internal consultant to management in preparing and substantiating decisions on the allocation of a company’s limited resources.
Scope of Projects
Projects are different from business operations because they require a team of (hand-picked) people to achieve pre-defined objectives within an agreed timeframe, as well as an (upfront) agreed investment.
Once the objectives are achieved and the output is handed back to the business, the project and its organization is dissolved.
Typically, projects are created to improve or expand business operations but the nature and effect of a project can vary widely. For instance, a project on the acquisition and integration of new business is different to a project to develop and introduce a new product. A calculation of the shareholder value created can, of course, help to prioritize all these projects but because the effort, scope and risk of each project are different, companies must make sure they make accurate and meaningful comparisons between projects.
1. Cash flow projections
Each model starts with a forecast of project cash inflow and outflow. By its very nature, the validity of a forecast is highly dependent on the underlying assumptions, and most models recognize that cash flow projections cannot be 100% accurate.
More complex models include a sensitivity testing function but this takes considerable effort to build.
Many companies take shortcuts by varying the net or gross cash flows as calculated for the base case. These shortcuts might give an inaccurate view because varying the value of (net) cash flow does not recognize the fact that delayed projects could incur not only higher cost but also costs over a prolonged period. As a result, revenues could be lower than anticipated or the expected cash inflows from that project may be delayed. In fact, any delay to the anticipated cash inflow can have a disproportionate effect on the NPV of the project.
A second issue related to cash flow projection is what elements should be included. Some companies include only ‘hard dollar savings’, ignoring ‘soft dollar savings’, such as unlocking partial full-time equivalents (FTEs) allowing staff to focus on (other) value adding activity, or existing cash flow that might be jeopardized if the project is not accepted.
Other benefits, such as security, market perception or quality of data, are even more difficult – if not impossible – to quantify. And, even if they were, it would still be difficult to quantify their contribution to individual projects.
The more companies focus on ‘hard dollar savings’, the more projects will need to focus on core business operations. As a result, projects that would significantly improve the quality of management information systems without reducing headcount might be overlooked. Short and low risk projects with a small upfront investment will be considered a higher priority than larger, more risky projects. For instance, projects building on existing infrastructure to create incremental benefits will typically be favoured above projects that result in a paradigm shift within the organisation.
A third issue is the horizon of the cash flow projection.
For comparison purposes, companies often have standard projection horizons of three or five years. However, the longer the project implementation takes, the longer it will take for the benefit to materialize.
Prefixed horizons favour projects with ‘quick wins’, low investments and short implementation. Important infrastructure projects might not return a significant positive NPV over a three-year period. On the other hand, projects with lasting ‘quick wins’ contribute a benefit after three, four or even 10 years – long after anybody would even remember the objectives!
If one sets the horizon of projections in a different way for each project, comparing the projects will not be straightforward. If one assumes that projects are considered only to the extent that they enhance shareholder or stakeholder value, the relevant horizon should be adjusted to the profile of stakeholders.
2. Discount factor
After the projections have been validated, the next step is to discount cash flows in order to make the NPV comparable. In theory, the WACC represents the rate at which projects will start generating shareholder value. The WACC is the weighted average cost of capital though and if a company is treated as a portfolio of projects, the WACC is a reflection of all activities and risks inherent in the company’s businesses.
Furthermore, the WACC is not constant over time. Among other factors, the WACC depends on the risk free rate, the company’s funding strategy (leverage) and risk profile. Each of these factors will change over time and can be different for each business line or project. The cost of capital should therefore be agreed individually for each project, and there are a number of issues that need attention.
Allocation of equity and debt
The allocation of equity and additional funding to projects is an important factor for the calculated NPV.
Using the current WACC for the calculation disregards the effect a project might have on company leverage when approved. Using the current WACC will also underestimate the shareholder value created by the project if additional (senior) funding is put in place.
However, in a similar case, the marginal approach to the project cost of capital would allocate all new (senior) funding disproportionately to the new project and thus overestimate the shareholder value to be created.
Another approach to this issue is to estimate the risk profile of an individual project and allocate equity accordingly. Depending on the magnitude and profile of projects in the portfolio, this might imply that a company could have a temporary or permanent equity surplus (or shortage). All projects should then compensate for this difference in order to satisfy stakeholders’ requirements.
A project cost of capital curve
The WACC will change over time as a result of market fluctuations and funding strategies. It is therefore not unreasonable to discount the first year cash flow at a different rate than that of the fourth or fifth year. The curve for the cost of capital for an individual project does not have to correlate to a risk-free yield curve.
The leverage strategy and change in the company’s risk profile will also affect this curve.
3. Identifying project risk
Each project will have a specific risk profile. The real option method tries to treat each risk component as a decision ‘option’ and estimates the value of each one using standard option calculation methods. The result of this approach to project risk is dependent on the predicted accuracy of the decisions, likelihood of each option available and timing of such occasions.
The more options involved in each decision, the more difficult it will be to verify the assumptions and thus validate the outcome.
Other simpler and widely used models will increase the discount factor with a risk premium. This approach will not favour projects with a high upfront investment and long impact horizon. Outsourcing projects that convert fixed investments into variable cost might also benefit disproportionately from this approach to project selection.
Risk is project specific and sometimes even option specific, i.e. two alternative approaches to the same project might have different risk profiles. The case for outsourcing a project to two different countries might have an identical cash flow; however, the market might see one as a higher risk than the other (e.g. as a result of additional country risk). Allocating additional equity to one project or adjusting the company WACC with a country specific outlook are alternative approaches for incorporation of such risk elements.
Individual projects can potentially affect the overall company risk profile. Acquisitions or major investments could affect the company beta and change the overall cost of capital. If these changes are not incorporated in the project NPV, the contribution to shareholder value can easily be misjudged. A marginal approach to allocating the cost (or benefit) of changing the company risk profile is tempting, especially when companies execute a diversification strategy. However, quite a few companies do feel the pressure of trying to capitalize on a break-up premium.
To address the element of risk, some methods will use a less complex approach by increasing the standard project discount factor. This risk factor might vary from project to project and this approach to risk favours projects with ‘quick wins’ early on in the project. This can be at the expense of projects with long-term structural impact because of the reduced NPV of cash flows over a long period of time. For the same reason, the method also favours projects with small upfront investments.
A Role for Treasury
In order to substantiate and motivate the value created by projects, companies need to ensure that cash flow projections and project risk are modelled in such a way that the outcome is comparable. Project support offices (if available) are hardly ever equipped for this task.
Treasury as the custodian of cash forecasting, risk management and fair value calculation, is ideal for this job. It would make perfect sense for treasury to develop useful models for project managers and evaluate the business case documents for executive management. In this way, treasury would be able to reinforce its role as an internal consultant on cash flow and risk management.
Conclusion
Many companies put a lot of effort into modelling the benefits of projects prior to approval. Allocating scarce resources in order to ensure a successful project is an important responsibility of management and they should understand how an adopted model is applied within a project.
Validating the motivation behind input and stress testing of cash flow projections is probably more important than the fact that, on paper, projects will return the value that makes them eligible for approval. Treasury can use its expertise to assist management and make sure the company chooses the best projects.
It is important to look beyond mere numbers and not focus on the difference of 1% or 2% in the NPV; remember there is always an element of art and ‘gut instinct’ in project selection. Management should therefore treat project analysis as a tool to support their strategic decision-making within the company.
WACC: Practical Guide for Strategic Decision-Making – Part 1

Vendor Supply Chain Finance (SCF) constitutes the transfer of a (trade) payable position towards the SCF underwriter (i.e. the bank). The beneficiary of the payment can then decide either to receive an invoice payment on due date or to receive the funds before, at the cost of a pre-determined fee.
This seven-part series, authored by Zanders consultants, provides CFOs and corporate treasurers with a better understanding of the weighted average cost of capital (WACC), which is recognized as one of the most critical parameters in strategic decision-making. The series highlights strategies to optimize the capital structure and maximize shareholder value.
This article, the first in the series, describes how to estimate the weighted average cost of capital (WACC) and the issues that need to be considered when doing so.
If companies were entirely financed with equity, there would be little difficulty in determining its cost of capital: it would be the expected return required by shareholders. Most companies, however, are not wholly financed with equity. They tend to issue a variety of financing instruments, including debt, equity and hybrids. Due to this financing mix, companies usually calculate a weighted average cost of capital (WACC).
Overview of WACC Estimation
The WACC is recognized as one of the most critical parameters in strategic decision-making. It is relevant for business valuation, capital budgeting, feasibility studies and corporate finance decisions. When estimating the WACC for a company, there is a clear trade-off between theoretical purity and actual circumstances faced by a company. The decision in this context should reflect the actual environment in which a company operates. In general, the WACC is estimated using the following equation:

D: Market value of interest-bearing debt
E: Market value of common equity
H: Market value of hybrid capital
RD: Cost of interest-bearing debt
RE: Cost of common equity
RH: Cost of hybrid capital
Ô: Corporate tax rate
The estimation of the WACC is based on several key assumptions:
- It is market driven. It is the expected rate of return that the market requires to commit capital to an investment.
- It is a function of the investment, not the investor.
- It is forward looking, based on expected returns.
- The base against which the WACC is measured is market value, not book value.
- It is usually measured in nominal terms, which includes expected inflation.
- It is the link, called a discount rate, which equates expected future returns for the life of the investment with the present value of the investment at a given date.
The WACC seems easier to estimate than it really is. Just as two people will rarely interpret a piece of art the same way, neither will two people calculate the same WACC. Even if two people do reach the same WACC, all the other applied judgments and valuation methods are likely to ensure that each has a different opinion regarding the components that comprise the company value.
Therefore, the following sections of this article will discuss the different WACC components in more detail. Errors that are frequently encountered in practice will be highlighted as well as best market practice as a guide for estimating the WACC.
Capital Structure
The first step in developing an estimate of the WACC is to determine the capital structure for the company or project that is being valued. This provides the market value weights for the WACC formula. Best market practice is to define a target capital structure and this is for several reasons.
First, the current capital structure may not reflect the capital structure that is expected to prevail over the life of the business.
The second reason for using a target capital structure is that it solves the potential problem of circularity involved in estimating the WACC, which arises when calculating the WACC for private companies. For instance, we need to know market value weights to determine the WACC but we cannot know the market value weights without knowing what the market value is in the first place.
To develop a target capital structure, a combination of three approaches is suggested:
1. Estimate the current capital structure.
A capital structure can comprise three categories of financing: interest-bearing debt, common equity and hybrid capital. The best approach for estimating the current ‘market value-based’ capital structure is to identify the values of the capital structure elements directly from their prices in the marketplace, if available. For equity, market prices are available for public companies, but it is more difficult to identify the market value of equity for private companies, business units and also for illiquid stocks.
The same applies for public debt, such as bonds, where the market value can be identified from available market prices. In the case of private debt, however, such as bank loans and private placements, the current value needs to be calculated. (For discussion about the difficulties of calculating the market value of hybrid capital, please refer to the third article in this series on the WACC.) The conclusion is that estimating the current capital structure based on market values could be difficult when market prices are not available. The next approach could assist in solving this difficulty, by estimating a target capital structure based on information from comparable companies.
2. Review the capital structure of comparable companies.
In addition to estimating the market value-based capital structure currently and over time, it is useful to review the capital structures of comparable companies as well.
There are two reasons for this. First, comparing the capital structure of the company with those of similar companies will help to understand if the current estimate of the capital structure is unusual. It is perfectly acceptable that the company’s capital structure is different, but it is important to understand the reasons behind this.
The second reason is a more practical one because in some cases it is not possible to estimate the current financing mix for the company. For privately held companies, a market-based estimate of the current value of equity is not available.
3. Review senior management’s approach to financing.
It is important to discuss the company’s capital structure policy with senior management to determine their explicit or implicit target capital structure for the company and its businesses.
This discussion could give an explanation why a company’s capital structure may be different from comparable companies. For instance, is the company by philosophy more aggressive or innovative in the use of debt financing? Or is the current capital structure only a temporary deviation from a more conservative target?
Often companies finance acquisitions with debt they plan to amortize rapidly or refinance with equity in the near future. Alternatively, there could be a difference in the company’s cash flow or asset intensity, which results in a target capital structure that is fundamentally different from comparable companies.
Corporate Tax Rate
The WACC is a calculation of the ‘after tax’ cost of capital. The tax treatment for the different capital components – such as interest-bearing debt, common equity and hybrid capital – is different. The corporate tax rate in the earlier mentioned WACC equation is applicable to debt financing because in most countries interest expense on debt is a tax-deductible expense to a company.
It is appropriate, however, to take into consideration the fact that several countries apply thin capitalization rules that may limit tax deductibility of interest expenses to a maximum leverage.
Furthermore, in some countries, expenses on hybrid capital could be tax deductible as well. In that case the corporate tax rate should also be applied to hybrid financing and the WACC equation should be changed accordingly. (For more information on hybrid capital please refer to the third article of this series on the WACC.)
Finally, corporate tax can also have a positive impact on the cost of equity. An example is Belgium, which recently introduced a system of notional interest deduction, providing a tax deduction for the cost of equity. This system will be further explained in the fifth article of this series, which elaborates on the impact of notional interest deduction on the WACC. In other words, the calculation of the WACC for Belgian financing structures needs to be revised.
The main conclusion is that the application of the corporate tax rate in the WACC equation will differ per country. As mentioned before, when estimating the WACC for a company, there is a clear trade-off between theoretical purity and actual circumstances faced by the company. Best market practice is to reflect the actual environment in which a company operates. Therefore the WACC equation needs to be revised accordingly.
Cost of Interest-bearing Debt
The cost of interest-bearing debt can be estimated using the following equation:
RD = RF + DRP
RD: Cost of interest-bearing debt
RF: Risk-free rate
DRP: Debt risk premium
The category of interest-bearing debt consists of short-term debt, long-term debt and leases. Many companies have floating-rate debt, as an original issue or artificially created by interest rate derivatives. If floating-rate debt has no cap or floor, then it is best market practice to use the long-term debt interest rate. This is because the short-term rate will be rolled over and the geometric average of the expected short-term rates is equal to the long-term rate.
The cost of debt is calculated using the marginal cost of debt, i.e. the cost the company would incur for additional borrowing, or refinancing its existing interest-bearing debt. This cost is a combination of the risk-free rate and a debt risk premium. Credit ratings are the primary determinants of the debt risk premium. (More information on the relationship between the WACC, shareholder value and credit ratings can be read in the second article of this series on the WACC.)
The risk-free rate is the theoretical rate of return attributed to an investment with zero risk. The risk-free rate represents the interest that an investor would expect from an absolutely risk-free investment over a specified period of time. In theory, the risk-free rate is the minimum return an investor should expect for any investment.
In practice, however, the risk-free rate does not technically exist, since even the safest investments carry a very small amount of risk. Therefore best market practice for WACC estimations is to use the yield on a 10-year government bond as a proxy for the risk-free rate.
Estimating the WACC can be a challenging exercise, however, because a risk-free government bond is not always available in emerging markets. (This will be discussed further in article seven of this series.)
The cost of debt is the yield-to-maturity on publicly traded bonds of the company. Failing availability of that, the rates of interest charged by banks on recent loans to the company would also serve as a good cost of debt. When using yield-to-maturity to estimate the cost of debt it is important to make a distinction between investment and non-investment grade debt. Investment grade debt has a credit rating greater than or equal to BBB- (Standard & Poor’s). For investment grade debt, the risk of bankruptcy is relatively low.
Therefore, yield-to-maturity is usually a reasonable estimate of the opportunity cost. The coupon rate, which is the historical cost of debt, is irrelevant for determining the current cost of debt. Best market practice is to use the most current market rate on debt of equivalent risk. A reasonable proxy for the risk of debt is a credit rating.
When dealing with debt that is less than investment grade, pay attention to the difference between the expected yield-to-maturity and the promised yield-to-maturity. The latter assumes that all payments (coupon and principal) will be made as promised by the issuer. Therefore it is necessary to compute the expected yield-to-maturity, not the quoted, promised yield. This can be done based on the current market price of a low-grade bond and estimates of its expected default rate and value in default.
If the necessary data is not available, use the yield-to-maturity of BBB-rated debt, which reduces most of the effects of the differences between promised and expected yields.
Leases, both capital and operating, are substitutes for other types of debt. In many cases it is reasonable to assume that their opportunity cost is the same as for the company’s other long-term debt. Since capital leases are already shown as debt on the balance sheet, their market value can be estimated just like other debt.
Operating leases should also be treated like other forms of debt. As a practical matter, if operating leases are not significant, it could be decided not to treat them as debt. They can be left out of the capital structure and the lease payments could be treated as an operating cost.
Cost of Common Equity
For estimating the opportunity cost of common equity, best market practice is to use the expanded version of the capital asset pricing model (CAPM). The equation for the cost of equity is as follows:
RE = RF + [βL * MRP] + SRP
RE: Cost of common equity
RF: Risk-free rate
βL: Levered beta of equity
MRP: Market risk premium
SRP: Specific risk premium
The market risk premium is the extra return that the stock market provides over the risk-free rate to compensate for market risk. The estimate of the historically derived market risk premium is about 5 per cent. This estimate depends on how much history is used. Structural changes in the economy and markets, however, suggest that more recent data provides a better basis for predicting the future. Therefore, best market practice is to use data from the second half of the last century. This is a sufficiently long period to achieve statistical reliability, while avoiding the potentially less relevant market returns.
The historically derived market risk premium can be benchmarked against the implied market risk premium of today’s market capitalization and earnings. This can be done under different assumptions for future earnings growth and reinvestment. Recent studies show an implied market risk premium of 5-5.5 per cent, which is comparable to the historical derived estimate.
Beta is the measurement for the systematic risk of a company and is typically the regression coefficient between historical dividend-adjusted stock returns and market returns. For decades, investors were only concerned with one factor, beta, in their portfolio selection. Beta was considered to explain most of a portfolio’s return.
This one-factor model, otherwise known as standard CAPM, implies that there is a linear relationship between a company’s expected return and its corresponding beta. Beta is not the only determinant of stock returns though so CAPM has been expanded to include two other key risk factors that together better explain stock performance: market capitalization and book-to-market (BtM) value.

Recent empirical studies indicate that three risk factors – market (beta), size (market capitalization) and price (BtM value) – explain 96 per cent of historical equity performance. These three-factor models go further than CAPM to include the fact that two particular types of stocks outperform markets on a regular basis: small caps and value stocks (high BtM value).
The approach to estimate beta depends on whether the company’s equity is traded or not. Therefore the beta of a company can be estimated in two ways. The first and preferred solution for public companies is to use direct estimation, based on historical returns for the company in question.
The second way is to use indirect estimation. This solution is mainly applicable to business units and private companies, but also for illiquid stocks or public companies with very little useful historical data. This estimation is based on betas from comparable companies, which are used to construct an industry beta. When constructing the industry beta, it is important to ‘unlever’ the company betas and then apply the leverage of the specific company.
Best market practice is to incorporate a specific risk premium for small caps and value stocks when estimating the cost of equity. As mentioned earlier, this premium may be applicable to a specific company, based on its market capitalization and BtM value.
Cost of Hybrid Capital
Hybrids are financial instruments that combine certain elements of debt and equity, such as preferred equity, convertible bonds and subordinated debt. WACC estimations are complicated by the introduction of hybrid capital into the capital structure.
This is most easily resolved through an effective split of the instrument’s value into debt and equity to reflect the true debt-equity mix. (The fifth article of this series describes how issuing hybrids can optimize the WACC. The article outlines how hybrids are analyzed on their impact on shareholder value, but they are also analyzed from the perspective of treatment by accountants/IFRS and rating agencies.)
Conclusion
There are many ways to make errors both in estimating the WACC and applying it in practice and this article discussed the different WACC components in more detail. Attention was given to some of the errors frequently encountered in practice. Best market practice was provided as a guide for estimating the WACC while more practical guidance on estimation and application of the WACC will be discussed in the rest of the articles in this series.
Let’s return to the analogy at the beginning of this article. Is estimating the WACC comparable to interpreting a piece of art?
Again, just as two people will rarely interpret a piece of art the same way, neither will two people calculate the same WACC. The key message of this article is that both are based on assumptions before reaching a final estimation or interpretation.
The more time you spend on defining good assumptions for estimating the WACC, the better the quality of business valuation, capital budgeting and other financial decision-making will be. It is like discovering the real value of art; it all starts with a good interpretation.


