Boosting MVA Calculation efficiency: the power of GPU computing

We explore the main challenges of computing Margin Value Adjustment (MVA) and share our insights on how GPU computing can be harnessed to provide solutions to these challenges.
With recent volatility in financial markets, firms need increasingly faster pre-trade and risk calculations to react swiftly to changing markets. Traditional computing methods for these calculations, however, are becoming prohibitively expensive and slow to meet the growing demand. GPU computing has recently garnered significant interest, with advances in the fields of advanced machine learning techniques and generative AI technologies, such as ChatGPT. Financial institutions are now looking at gaining an edge by using GPU computing to accelerate their high-dimensional and time-critical computing challenges.
The MVA Computing Challenge
The timely computation of MVA is essential for pre-trade and post-trade modelling of bilateral and cleared trading. Providing an accurate measure of future margin requirements over the lifetime of a trade requires the frequent revaluation of derivatives with a large volume of intensive nested Monte Carlo simulations. These simulations need to span a high-dimensional space of trades, time steps, risk factors and nested scenarios, making the calculation of MVA complex and computationally demanding. This is further complicated by the need for an increasing frequency of intra-day risk calculations, due to recent market volatility, which is pushing the limits of what can be achieved with CPU-based computing.
An Introduction to GPU Computing
GPU computing utilizes graphics processing units, which are specifically designed to handle large volumes of parallel calculations. This capability makes them ideal for solving programming challenges that benefit from high levels of parallelization and data throughput. Consequently, GPUs can offer substantial benefits over traditional CPU-based computing, thanks to their architectural differences, as outlined in the table below.
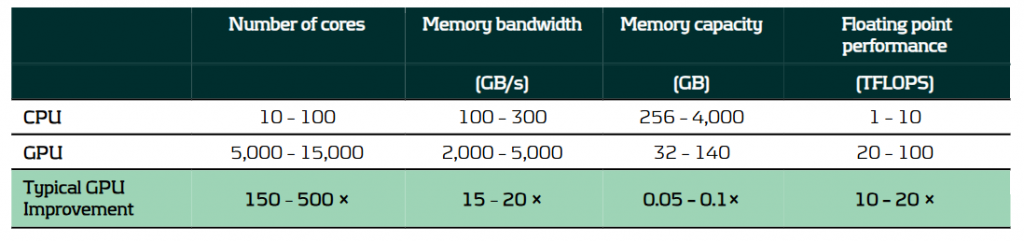
A comparison of the typical capabilities of enterprise-level hardware for CPUs and GPUs.
It is because of these architectural differences that CPUs and GPUs excel in different areas:
- CPUs feature fewer but more powerful cores, optimized for general-purpose computing with complex, branching instructions. They excel in performing serial calculations with high single-core performance.
- GPUs consist of a large number of less powerful cores and with higher memory bandwidth. This makes them ideal for handling large volumes of parallel calculations with high throughput.
Solving the MVA Computational Challenge with GPU Computing
The requirement to calculate large volumes of granular simulations makes GPU computing especially well-suited to solving the MVA computational challenge. The use of GPU computing can lead to significant improvements in performance for not only MVA but a range of problems in finance, where it is not uncommon to see improvements in calculation speed of 10 – 100x. This performance increase can be harnessed in several ways:
- Speed: The high throughput of GPUs provides results more quickly, providing faster risk calculations and insights for decision-making, which is particularly important for pre-trade calculations.
- Throughput: GPUs can more quickly and efficiently process large calculation volumes, providing institutions with more peak computing bandwidth, reducing workloads on CPU-grids that can be used for other tasks.
- Accuracy: With greater parallel processing capabilities, the accuracy of models can be improved by using more sophisticated algorithms, greater granularity and a larger number of simulations. As illustrated below, the difference in the number of Monte Carlo simulations that can be achieved by GPUs in the same time as CPUs can be significant.
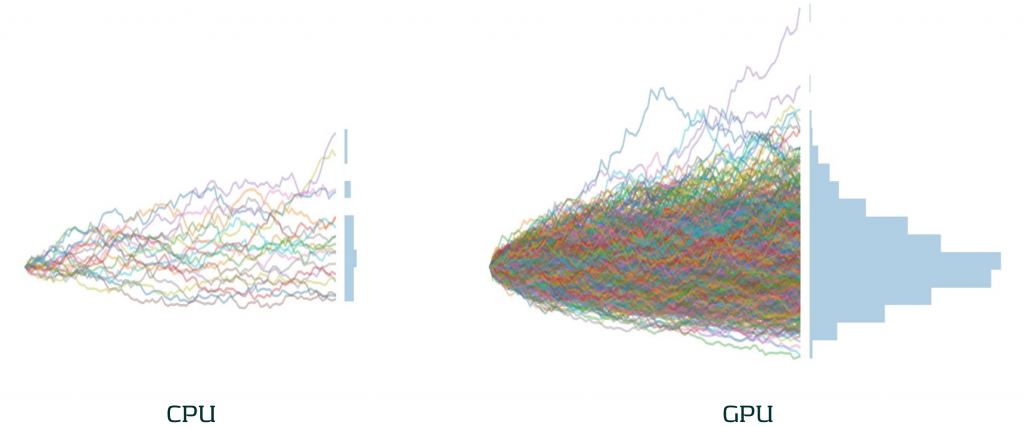
The difference in the number of Monte Carlo paths than can be simulated in the same time between an equivalent enterprise-level CPU and GPU.
Case Study: Our approach to accelerating MVA with GPUs
To illustrate the impact of GPU computing in a real situation, we present a case study of our work accelerating MVA calculations for a major bank.
Challenge: A large investment bank was seeking to improve the performance of their pre-trade MVA for more timely calculations. This was challenging as they needed to compute their MVA exposures over long time horizons, with a large number of paths. Even with a sensitivity-based approach, this process took close to 10 minutes using a single-threaded CPU calculation.
Solution: Zanders analyzed the solution and identified several bottlenecks. We developed and optimized a GPU-accelerated solution to ensure efficient GPU utilization, parallelizing the calculations across scenarios and risk factors.
Performance: Our GPU implementation improved MVA calculation speed by 51x. Improving calculation time from just under 10 minutes to 10 seconds. This significant increase in speed enabled more timely and frequent assessments and decisions on MVA.
Our Recommendation: A strategic approach to GPU computing implementations
There are significant benefits to be achieved with the use GPU computing. However, there are some considerations to ensure an effective use of resources:
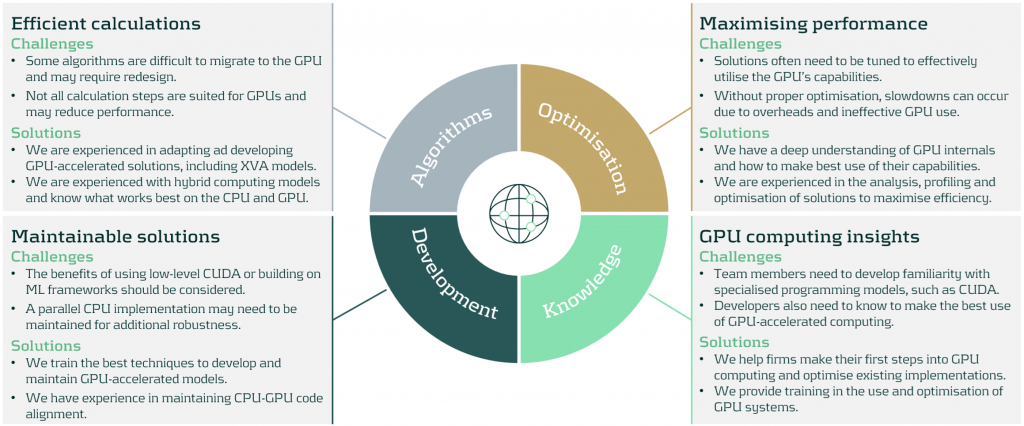
We work with firms to develop bespoke solutions to meet their high-performance computing needs. Zanders can help in all aspects of GPU computing implementation, from initial design to the analysis, development and optimization of your GPU computing implementation.
Conclusion
GPU computing offers significant improvements in the speed and efficiency of financial calculations, typically boosting calculation speeds by factors of 10-100x. This enables financial institutions to manage their risk more effectively, including the computationally demanding calculations of MVA. By replacing CPU-based calculations with GPU computing, banks can dramatically improve their capacity to process greater volumes of calculations with higher frequency. As financial markets continue to evolve, GPU computing will play an increasingly vital role in their calculation infrastructure.
To find out more on how GPU computing can enhance your institution's risk management processes, please contact Steven van Haren (Director) or Mark Baber (Senior Manager).
The EBA’s new IRRBB heatmap implementation: reporting on key objectives

Following the publication of its focus areas for IRRBB in 2024 and 2025, the European Banking Association (EBA) has now published an update regarding the implementation and explains the next steps.
The implementation update covers observations, recommendations and supervisory tools to enhance the assessment of IRRBB risks for institutions and supervisors.1 Main topics include non-maturing deposit (NMD) behavioral assumptions, complementary dimensions to the SOT NII, the modeling of commercial margins for NMDs in the SOT NII, as well as hedging strategies.
Some key highlights and takeaways from the results of sample institutions as per Q4 2023:
- Large dispersion across behavioral assumptions on NMDs is observed. The significant volume of NMDs as part of EU banks’ balance sheets, differences in behavior between customer / product groups and developments in deposit volume distributions, however, underline the need for more solid and aligned modeling. The EBA hence suggests NMD modeling enhancements and recommends (1) banks to consider various risk factors related to the customer, institution and market profile, as well as (2) a supervisory toolkit to monitor parameters / risk factors. Segmentation and peer benchmarking, (reverse) stress testing as well as (combining) expert judgment and historical data are paramount in this regard. The recommendations spark banks to reevaluate forward looking approaches, as shifting deposit dynamics render calibration solely based on historical data insufficient. Establishing a thorough expert judgment governance including backtesting is vital in this respect. Moreover, assessing and substantiating how a bank’s modeling relates to the market is more important than ever.
- Next to the NII SOT that serves as a metric to flag outlier institutions from an NII perspective, the EBA proposes additional dimensions to be considered by supervisors. These dimensions, which aim to reflect internal NII metrics, must complement the assessment and enhance the understanding of IRRBB exposures and management. The proposed dimensions include (1) market value changes of fair value instruments, (2) interest rate sensitive fees/commissions & overhead costs, and (3) interest rate related embedded losses and gains. It is important to note that it is not intended to introduce new limits or thresholds associated with these dimensions.
- Given concerns and dispersion regarding the modeling of commercial margins for NMDs in the NII SOT (38% of sample institutions assumed constant commercial margins versus the remainder not applying constant margins), the EBA now provided additional guidance on the expected approach. They recommend institutions to align the assumptions with those in their internal systems, or apply a constant spread over the risk-free rate when not available. Key considerations include the current spread environment, the context of zero or negative interest rates and lags in pass-through. The EBA’s clarification indicates that banks are allowed to apply a non-constant spread. This serves as an opportunity for banks still applying constant ones, as using non-constant spreads enhances the ability to quantify NII risk under an altering interest rate environment.
- Hedging practices vary significantly across institutions, although hedging instruments (i.e. interest rate swaps) to manage open IRRBB positions are aligned. Hedging strategies have significantly contributed to meeting regulatory requirements, with all institutions meeting the SOT EVE as per Q4 2023, compared to 42% that would not have complied if hedges were disregarded. For the SOT NII, however, 13% of the sample institutions would have been considered outliers if this regulatory measure had been applied in Q4 2023 (versus 21% when disregarding hedges). This result shows that it is key for banks to find a balance between value and earnings stability, and apply hedging strategies accordingly. As compliance with SOTs must be ensured under all circumstances, stressed client behavior and market dynamics must be accounted for.
In the upcoming years, the EBA will continue monitoring the impact of the IRRBB regulatory package, focusing on NMD modeling, hedging strategies, and potential scope extensions to commercial margin modeling. It will also assess Pillar 3 disclosure practices and track key regulatory elements such as the 5-year cap on NMD repricing maturity and Credit Spread Risk in the Banking Book (CSRBB)-related aspects. Additionally, the EBA will contribute to the International Accounting Standards Board’s (IASB's) Dynamic Risk Management (DRM) project and evaluate the impact of recalibrated shock scenarios from the Basel Committee.
The EBA publication triggers banks to take action on the four topics outlined above, as well as on hedge accounting (DRM) in the near future. Zanders has extensive relevant experience, and supported on:
- Numerous NMD topics, including modeling, validation and benchmarking. Furthermore, we published a series of whitepapers regarding NMD modeling concepts and approaches, deposit rate dynamics, forward looking perspectives and migration dynamics in deposits that is particularly relevant following this EBA publication.
- Drafting an IRRBB strategy, advising on coupon stripping and developing a hedging strategy, thereby carefully balancing value and NII risks (SOT EVE / NII).
- Validating a hedge accounting framework, developing a hedge account model and hedge accounting outsourcing. Zanders moreover held a survey on DRM as well as published an extensive series of articles on the DRM project of the IASB and its implications for banks.
Contact Jaap Karelse, Erik Vijlbrief (Netherlands, Belgium and Nordic countries) or Martijn Wycisk (DACH region) for more information.
When will savings rates go up to match global interest rate rises?

The recent rises in global interest rates mark the first raise in a long time, as the loose monetary policies and quantitative easing (QE) introduced after the 2008 crash and Covid-19 pandemic abate.
There is now a clear trend break that is likely to significantly impact financial markets. Rate hikes have already caused rises in the mortgage rates offered by banks, but variable rate savings are still negligible in the eurozone. However, when you look further east, the first glimpses of positive compensations for client deposits are evident. What can we learn from Poland in this new and recently uncharted market territory?
Since the beginning of this year, interest rates are increasing at a fast pace after a long period of low rates. The Bank of England and the US Federal Reserve have already hiked their rates in an effort to tame high inflation, while the European Central Bank (ECB) has just announced it plans to up rates after 11 years of historically low or even negative interest rates. The consensus on financial markets is that positive rates will return in the eurozone towards the end of this year.
Looking towards Eastern Europe might offer a glimpse into the future for banks and their clients, as they are already ahead of the curve in terms of rising interest rates.
THE POLISH EXEMPLAR
Where interest rate hikes have only just been announced within the 19-nation eurozone, the markets in Hungary, Romania, Poland and other parts of Eastern Europe that remain outside the single currency are already in front of the trend. In Poland, for example, interest rates decreased to near-zero after the 2020 Covid-19 pandemic, driving down mortgage and savings rates to historically low levels. Due to high inflation, however, the Polish central bank has increased rates sharply since October of last year. As a result, short term rates in Poland have risen by almost 7% since the end of 2021, while the eurozone rates are only expected to increase in the coming months (see Figure 1).
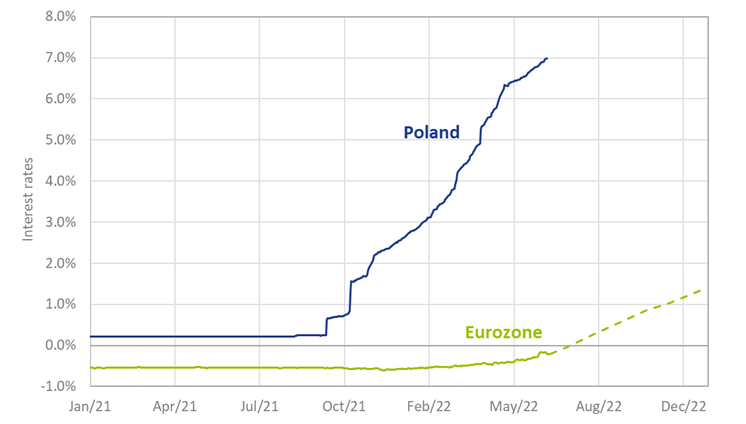
Figure 1: Three-month interest rate in Poland v the eurozone, including implied future rates for the eurozone (dashed line)
Polish consumers hoping for a similarly fast increase in their savings rate were left disillusioned. Since interest rates started to rise nine months ago in the country, savings rates have remained at a constant level of 0.5%, resulting in an extreme increase in margins for Polish banks. Since the majority of Polish mortgage owners pay a variable mortgage rate, rising interest rates have put a squeeze on many households.
As a reaction, the Polish government publicly urged banks to further increase the savings rate paid to consumers. Indeed, the National Bank of Poland recently began offering its own savings bonds directly to consumers. Retail clients are able to invest their savings for a fixed term against a coupon which tracks the central bank’s rate. As hoped, this has encouraged a response from the Polish banks. They are now providing similar fixed term deposits to clients.
Upward pricing pressure on savings rates is now evident. Recently, multiple banks announced a small raise of the general savings rate, towards 1%, slowly passing on some of the additional margin to clients. However, savings rates on offer in Poland still significantly lag the short-term interest rates in the market.
ARE POLISH TRENDS APPLICABLE TO EURO MARKETS?
Although Eastern European markets provide interesting insights into interest rate developments, it doesn’t necessarily provide a clear roadmap for Western European markets. Eastern markets on the continent have experienced a relatively low interest rate environment for a long time, but historically interest rates have been significantly higher when compared to the eurozone. Since the introduction of the Euro, interbank offered rates have hardly ever risen above 5% (see Figure 2). It remains to be seen, therefore, whether euro yields will rise to the same extremes currently observed in Eastern Europe.
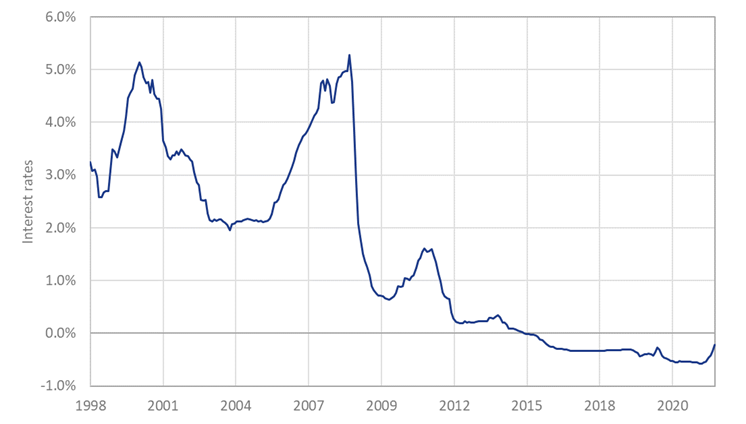
Figure 2: Historical interbank rates for the eurozone
Banks in the euro area face more competition making it challenging to maintain a savings margin that is similar to the Polish banks. Eurozone banks face more competition from peers within their own country and from foreign banks that can more easily operate in the single currency area. Those with their own domestic currencies face less displacement risk. Next to that, eurozone backs face more competition from newer Fintech-enabled banks that spy an opportunity to conquer market share by offering higher savings rates. Waiting too long to raise the compensation of depositors could lead to a large exodus of retail clients from traditional institutions.
It is unlikely that the ECB will take a similarly active role to the National Bank of Poland in pressuring banks to increase savings rates. ECB policies must be appropriate for all the 19 nation marketplaces within the eurozone, which generally exhibit less uniformity than the Polish market.
For example, the intervention of the National Bank of Poland resulted from the large portion of variable rate mortgages in Poland, but the eurozone market is much more diversified in this respect . It is therefore not expected that the ECB will start offering retail products to increase savings rates.
Although the ECB is planning to hike its interest rates in common with its Eastern European neighbors, a continuous series of significant rate hikes is less likely because financial markets tend to react stronger to expectations or announcements from the ECB, which necessitates a more graduated approach. The point is illustrated by the significant increase in the spread between Italian and German obligations seen following the recent announcement that the ECB will raise interest rates for the first time in 11 years. The foreshadowed change decreased the value of Italian obligations immediately. Some divergence with the trend observed in Poland is therefore inevitable, but the over-arching pattern of rising global rates is evident and over time this will course feed into savings rates with some local variations.
WHAT CAN WE LEARN FROM SAVINGS MARKETS IN OTHER COUNTRIES?
Despite the differences between savings markets in Eastern Europe and the eurozone, there are plenty of lessons that we can still learn from the Polish situation. Interest rate hikes in the market will likely predate the increasing of deposit rates, although the lag between the two is likely to vary due to differences in the competitive environment.
In Poland, the savings rates offered by banks are slowly rising after more than six months of high short-term interest rates. This makes it unlikely that we will see large increases in deposit rates in the eurozone before the end of the year if we map that trend across the currency border.
While the approach of the ECB to interest rate hikes is less hawkish compared to the Eastern European central banks, there will still be multiple rate increases over the coming year. In the Polish market, the pressure to increase rates on savings deposits mostly came from a competitive price on fixed term deposits – in this case offered by the central bank itself. Although the ECB is unlikely to adopt such an active approach, the pricing pressure in the eurozone is likely to come from term deposits as well. Once the difference between short term rates, which are typically reflected in fixed term deposits, and rates on savings becomes large enough, banks are likely to increase their compensation on savings – or face a declining customer base.
From the banks point of view, it is critical to accurately capture the pricing dynamic between fixed term deposits and saving rates. This dynamic could be modeled explicitly when forecasting deposit rates to capture the risk in variable rate savings.
One approach is to consider the forward-looking behavior of savings while calibrating the models by formulating specific scenarios and the expected pricing strategy in these scenarios. Lessons from Poland and other parts of Eastern Europe offer an interesting case study to challenge the way the bank approaches increasing interest rates.


