Gaining Insights from Shorter Horizons: NGFS’s New Short-Term Scenarios

To help banks manage climate risk over a more relevant time horizon, the NGFS has introduced scenarios focused on the next three to five years.
With extreme weather events becoming more frequent and climate policy tightening across jurisdictions, banks are under increasing pressure to understand how climate change will impact their portfolios. Previously, most climate scenario analyses have focused on long-term trajectories, stretching out to 2050 or beyond. However, these long-term analyses have often been far too abstract for day-to-day risk management.
The new NGFS short-term scenarios investigate the impact of climate risks over the next five years, offering a more practical solution. By isolating the individual impacts from physical and transition risk, and by providing better granularity at both temporal and sectoral levels, the new scenarios provide a new and valuable tool for climate risk modelling.
In this article, we explore what makes these scenarios unique, their benefits and limitations, their impact on future macroeconomic and market trends, and importantly, how banks can utilize them to fulfil regulatory requirements.
Physical and transition risks in the scenarios
The short-term scenarios capture four possible futures, each reflecting a different mix of physical and transition risks. The scenarios show how varying levels of climate policy and climate-related events could shape the economic and financial outcomes over the next 5 years. The four scenarios are summarized in the figure below.

Figure 1: The four NGFS short-term scenarios.
Key benefits and limitations of the new scenarios
The scenarios offer several benefits, including a more practical time horizon and better isolation of physical and transition risks. However, they also come with inherent limitations that should be acknowledged when being used. Below, we summarise the main benefits and limitations of the new scenarios.
Benefits
- Time horizon
- Although NGFS has already released several versions of their long-term scenarios, this is the first release of climate scenarios whose narratives focus on the next few years. Short-term scenarios cover time horizons that are typically more relevant for risk assessment management in banks, such as capital planning, liquidity assessments, and regulatory stress testing exercises. In addition, the uncertainty of climate and macroeconomic variables increase over longer horizons, making the short-term scenarios more dependable.
- Calibrated using recent data
- As with any model which has been recalibrated using the latest data, by incorporating the most recent economic conditions, market trends, and climate policy commitments, the short-term scenarios provide more reliable and accurate forecasts. This allows banks to run more credible stress tests, develop informed strategies, and leads to outputs that are more aligned with current market and policy conditions.
- Isolation of physical and transition risk
- Three of the four scenarios isolate only physical or transition risk, which can provide more targeted insights for climate risk assessment. By separating these risks, banks can identify the specific drivers of financial impact more accurately, whether from policy changes or climate-related events. Unlike scenarios that contain a combination of transition and physical risks, isolating only one of the risks can make the results easier to interpret and act upon.
- Variation across sectors and regions
- NGFS short-term outputs cover up to 15 macro-regions (e.g. EU27, Asia and North America) and up to 46 countries, which is similar to the long-term scenario results. The biggest improvement is found on the temporal granularity: while most of the variables for the long-term scenarios are provided in 5-year intervals, the short-term scenarios are mostly provided on a yearly basis.
Limitations
- Still not short enough?
While the NGFS short-term scenarios aim to address near-term climate-related risks, even shorter time horizons may be necessary for accurate and practical modelling in both credit and, in particular, market risk. More granular timeframes, such as a quarterly projection interval, would support banks to rapidly react to policy changes, market reactions, or acute physical climate events, which can unfold within weeks or months and not years.
- Lack of dispersion within regions or sectors
In some cases, the results show limited differentiation between sectors and regions. This can make it difficult to accurately capture sector-specific or country-specific vulnerabilities. For example, countries with significant geographical and socioeconomic differences, such as Switzerland, Iceland, and Ukraine, are grouped together under the region "Rest of Europe". Similarly, the sector "Market Services" includes a wide range of distinct industries, such as Real Estate, Telecommunications, and Waste and Water Collection.
- Physical risk is still difficult to accurately model
Accurately capturing physical climate risk within a short-term horizon remains methodologically challenging. Acute events like floods or wildfires are based on the estimation of tail risks (e.g. return periods) which can be difficult to model accurately. In addition, physical risks exhibit high spatial variability. For instance, coastal areas can be more vulnerable to hurricanes than inland areas, even if they are in the same country. Therefore, aggregating scenario data on the country or regional level can potentially underestimate the risks in specific areas.
- Over-simplification of policy implementation
Policy pathways in the short-term scenarios tend to assume smooth, linear implementation and immediate effectiveness. In reality, climate policies often face political, social, and economic frictions that delay or prolong their impact. Hence, these assumptions may lead to the underestimation of transition shocks, particularly where abrupt or uncoordinated policy actions could trigger market volatility.
Impact of the new scenarios on important modelling variables
To take a look at the NGFS short-term scenarios in action, we can examine the impact of the scenarios on key macroeconomic variables. Figure 2 shows the behavior of GDP and carbon price (with respect to baseline values) within Europe and Asia for all four scenarios. There are clear negative shocks which are seen in the GDP for all the scenarios. Similarly, we see a positive spike in the carbon price for both regions, however the effect in Asia is much greater than in Europe. Asia experiences a sharper percentage increase in carbon prices because it starts from a much lower baseline compared to Europe, where carbon prices are already high and policies have been in place for years. Additionally, in general, Asia is more emissions-intensive and heavily reliant on fossil fuels (particularly coal) which means more aggressive changes to carbon pricing are required to reduce emissions.
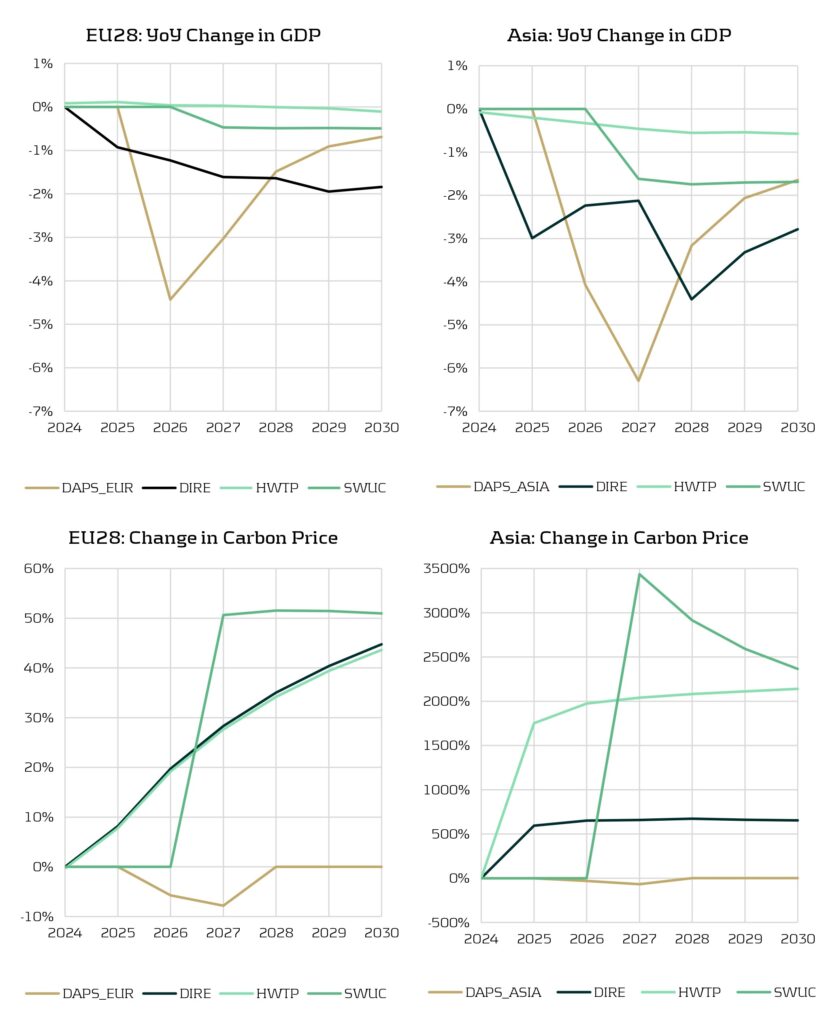
Figure 2: Top – YoY change in GDP (compared to baseline). Bottom – change in carbon price (compared to baseline).
Although the impact to variables such as macroeconomic indicators, emissions trends, and shifts in production offer essential context, they are usually only the first step in climate risk modelling. Ultimately, we are interested in how these variables translate into changes in market-based metrics, such as corporate bond spreads or PDs, which directly affect portfolio valuation. For example, for stress testing purposes, macro and sectoral outputs must be mapped onto these market-based metrics to assess potential losses and capital impacts.
Figure 3 compares the corporate bond spread adjustments for the Oil, EV Transport Equipment, and Hydroelectric sectors under the HWTP scenario. The results illustrate a shifting investor sentiment in the corporate bond market. The Oil sector experiences a significant increase in spread adjustments over the time horizon due to an increase in perceived risk and a decline in investor favorability. In contrast, the EV Transport Equipment and Hydroelectric sectors maintain negative spread adjustments, highlighting that they are viewed more favorably. Overall, these results capture a market preference for cleaner and more sustainable industries and the scenarios clearly distinguish between sectors that are carbon-intensive and those aligned with low-carbon technologies.
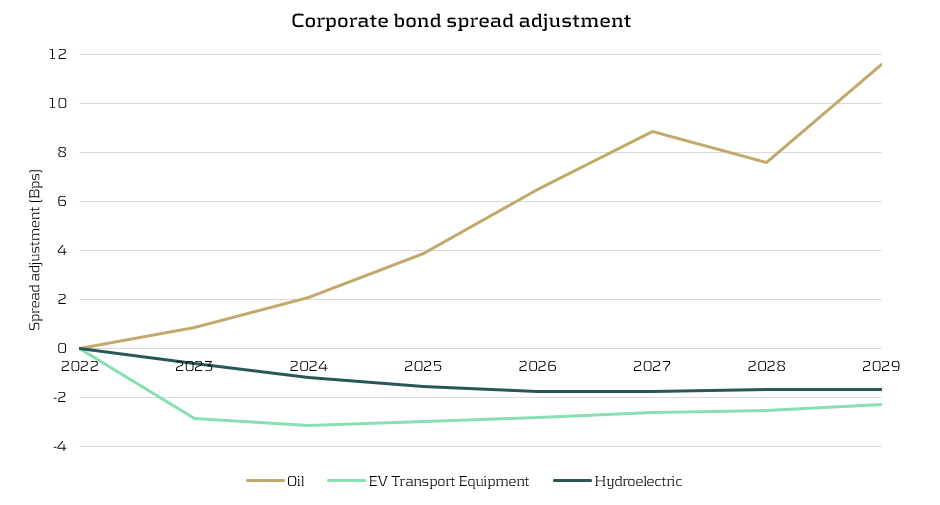
Figure 3: Adjustment to corporate bond spreads for the Oil, EV Transport Equipment, and Hydroelectric sectors (HWTP scenario).
Zanders’ opinion
Although the five-year horizon of the new scenarios is still somewhat too long for direct application to market risk modelling (where exposures fluctuate on much shorter timescales), it aligns far better with the lifecycle of most credit products, especially those with relatively short maturities such as personal loans. Banks should utilise the scenarios as starting points for modelling the effects of near-term climate shocks on the performance of their credit products. However, the new scenarios can still provide valuable insights for market risk modelling. The scenarios can help identify sectoral sensitivities, adjust volatility and correlation assumptions, and enrich the narratives of existing scenarios.
The scenarios also help to standardise climate stress testing by providing a consistent set of assumptions, variables, and modelling frameworks that financial institutions can use as a common reference. This alignment reduces discrepancies in inputs and methodologies, enabling more comparable results across banks and jurisdictions. As a result, institutions and supervisors can more effectively benchmark climate-related risks, identify outliers, and support coordinated regulatory responses, ultimately improving the credibility and usefulness of climate stress tests.
Importantly, the new scenarios are well-suited to meet the needs of regulatory frameworks like the Internal Capital Adequacy Assessment Process (ICAAP), which typically considers a 3-to-5-year horizon. This makes them far more applicable than traditional long-term scenarios, which typically look out to 2050. Similarly, the ECB climate stress testing framework requires banks to use a variety of time horizons and both physical and transition risk scenarios. With ever-growing regulatory expectations, such as the recent CP10/25 consultation paper from the PRA on managing climate-related risks, the new short-term scenarios provide a timely and relevant tool for banks.
Conclusion
The new NGFS short-term scenarios are an important addition to climate risk modelling frameworks, offering a direct focus on the next five years – a time period which is far more aligned with capital planning, liquidity assessments, and regulatory stress. However, the scenarios are not intended to replace existing long-term scenarios. Rather, they complement them by providing a near-term view of climate risk that is highly relevant for all banks.
For more information on how Zanders can support you to understand the impact of climate risk on your business, please contact Steyn Verhoeven and Polly Wong.
Navigating the Dutch National Mortgage Guarantee (NHG) in CRR3

A regulatory change in CRR3 may significantly impact the capital treatment of NHG-covered Dutch mortgages.
With the introduction of CRR3, effective from January 1, 2025, the ‘extra’ guarantee on Dutch mortgages – known as the Dutch National Mortgage Guarantee (NHG) – will no longer be automatically eligible for the modelling approach. This requires institutions to apply the substitution approach instead. Although this may seem like a minor change, it can have far-reaching consequences. In this article, we provide a background on this change in the treatment of NHG and discuss the potential implications and challenges it may bring.
Introduction Dutch National Mortgage guarantee (NHG)
The Dutch National Mortgage Guarantee (NHG) serves as a safety net for borrowers and lenders of mortgage loans in the Netherlands. It is designed to provide protection in cases of financial distress caused by circumstances such as divorce, disability, or unemployment [1] [2] [3]. If these situations require the sale of the residential property and a residual debt remains after all other collection sources have been exhausted, the NHG will cover this remaining debt when contractual conditions are met1.
The NHG guarantee is provided by the Stichting Waarborgfonds Eigen Woning (WEW) [1] [4]. Although Stichting WEW is not state-owned, the Dutch state acts as a suretyship provider. This arrangement ensures that if Stichting WEW’s capital is insufficient to meet its guarantee claims, the state will supply unlimited interest-free loans. These loans must be repaid only after the foundation’s assets have been restored [5].

Following the Capital Requirements Regulation (CRR), the NHG guarantee classifies as Unfunded Credit Protection (UFCP) Credit Risk Mitigation (CRM) and should be treated accordingly.
Exposure class of Stichting WEW
As outlined in the previous text, the direct protection provider of the NHG is Stichting WEW. In the event that NHG fails to make payments, the Dutch sovereign state provides a suretyship to Stichting WEW, essentially serving as a counter-guarantee for the NHG guarantee extended by Stichting WEW.
CRR III article 4(8) [6] defines a public sector entity (PSE) as: “a non-commercial administrative body responsible to central governments, regional governments or local authorities, or to authorities that exercise the same responsibilities as regional governments and local authorities, or a non-commercial undertaking that is owned by or set up and sponsored by central governments, regional governments or local authorities, and that has explicit guarantee arrangements, and may include self-administered bodies governed by law that are under public supervision;”
Stichting WEW satisfies the definition of PSE in CRR III article 4(8), as it is a non-commercial undertaking (stichting) established2 by the central government, with an explicit guarantee arrangement from the Dutch central government. However, the CRR does not clearly define the sponsoring of the central government. Should it be determined that the sponsoring requirement is not met, Stichting WEW must instead be classified as a corporate exposure class3.
The remainder of the text assumes that Stichting WEW can be classified under the PSE exposure class as defined in CRR III article 112(c) (SA) and 147(2)(aa)(ii) (IRB). Nonetheless, the validity of the arguments throughout the following chapters remains intact, regardless of whether Stichting WEW is classified under the corporate or PSE exposure class.
Stichting WEW may not be classified as an exposure to a central government following CRR III articles 116 (SA) and 147(3)(a) (IRB), which specify that only specific public sector entities should be allocated to the central government exposure class. Given that Stichting WEW does not appear on the list published by the European Banking Authority (EBA) [7], it cannot be classified as an exposure to the central government under these articles.
There is no market consensus in the Dutch mortgage market on how to classify Stichting WEW: whether as a PSE or as a Corporate exposure. During our recently hosted roundtable discussing the implications of regulatory changes concerning NHG, participating banks indicated that it might be challenging to clearly classify Stichting WEW as a PSE due to the inconclusive regulatory guidance noted in this chapter. Banks are encouraged to engage in discussions with their Joint Supervisory Team (JST) and/or National Competent Authority (NCA) to determine the appropriate treatment of Stichting WEW.
Allowed UFCP approaches for NHG guarantees
According to CRR III article 108(3), if the AIRB approach is used for similar direct exposures to the protection provider, the UFCP modelling approach is required. In this context, similar direct exposure refers to exposure to the Stichting WEW4. With the competent authorities’ approval, the AIRB approach can be used for PSEs (and corporates), as specified in CRR III article 151(8-9). Therefore, if the AIRB approach is used for exposures to Stichting WEW, then the UFCP modelling approach is applicable. Conversely, if the SA or FIRB approach is used instead, then the UFCP substitution approach is mandatory.
Applying the effect of NHG guarantees
Under the substitution approach, the counter-guarantee provided by the Dutch central government can be recognized. CRR III article 214 states that guarantees backed by the central government may be treated as exposures within the central government exposure class, as defined in CRR III articles 112(a) (SA) and 147(2)(a) (IRB). This implies that the NHG guarantee can be classified under the central government exposure class [8]. Consequently, while capitalizing the NHG guarantee using the SA approach for the Dutch central government, it is possible, though not obligatory, to apply a 0% risk weight associated with the Dutch central government5.
If the institution employs the AIRB approach for exposures to to Stichting WEW, the modelling approach can be applied. In this scenario, risk weights for Stichting WEW and the Dutch central government (CRR article 214) are not used, as the effect of the NHG guarantee is modelled directly.
Substitution approach for banks without AIRB PSE models
For banks without AIRB models for Stichting WEW, the above argumentation does not apply, and the UFCP substitution approach for NHG presents several challenges.
The following list provides a non-exhaustive overview of these challenges:
1. Reconsideration of methodologies: Many banks model NHG separately, possibly through a specifically calibrated segment.
2. Level of application: Implementing the substitution approach within the reporting stream poses difficulties, as it requires separating the NHG-covered portion of the exposure from the uncovered portion. This could necessitate changes in data delivery and processing.
3. Changing coverage amounts over time: The NHG coverage percentage has changed from 100% to 90%, requiring at least two different implementations/calculations.
4. Unknown claimable amount: The exact amount that can be claimed is only known once the residential property is sold.
5. Loss-sharing exclusion: The substitution approach cannot incorporate the loss-sharing characteristic.
6. Mismatch between 0% substitution and actual losses of 5-10%: This is typically due to:
- Failed NHG claims, which cannot be integrated into the substitution approach.
- Discounting of cash-flows.
In summary, the substitution approach for banks without AIRB PSE models presents significant practical and methodological challenges. Effectively addressing these is essential to ensure a reliable implementation of the revised NHG treatment and maintain regulatory compliance.
Conclusion
Although the change in the CRR may seem minor at first glance, its consequences can be far-reaching. This article has outlined the key aspects of the revised NHG treatment, along with potential implications and challenges. However, it is not possible to provide a one-size-fits-all overview that fully captures the impact for every financial institution affected by this change.
If you would like to understand what the revised NHG treatment means specifically for your organization, feel free to contact our experts: Rick Stuhmer & Victor van Dongen.
Bibliography
[1] NHG, „Voorwaarden en normen [NHG conditions 2024],” 2024. [Online]. Available: https://www.nhg.nl/voorwaarden-en-normen/#id-18478.
[2] NHG, „Kwijtschelding van een restschuld [NHG conditions 2024],” 2024. [Online]. Available: https://www.nhg.nl/hulp-van-nhg/kwijtschelding-van-een-restschuld/.
[3] Rijksoverheid, „Nationale Hypotheek Garantie (NHG),” 2024. [Online]. Available: https://www.rijksoverheid.nl/onderwerpen/huis-kopen/vraag-en-antwoord/nationale-hypotheek-garantie-nhg.
[4] NHG, „Over de stichting [NHG annual report 2022],” 2022. [Online]. Available: https://www.nhg.nl/media/1bgf13fd/nhg_jaarverslag2022-hr.pdf.
[5] Stichting Waarborgfonds Eigen Woningen, „Memorie van toelichting bij de Wet herziening eigendomsgrenzen 2023, onderdeel 1477577. Rijksfinanciën.,” 2023. [Online]. Available here.
[6] European Parliament and European Council, „Amending Regulation (EU) No 575/2013 as regards requirements for credit risk, credit valuation adjustment risk, operational risk, market risk and the output floor,” 2024. [Online]. Available: https://eur-lex.europa.eu/legal-content/EN/TXT/PDF/?uri=OJ:L_202401623.
[7] European Banking Authority, „Lists for the calculation of capital requirements for credit risk,” 2024. [Online]. Available: https://www.eba.europa.eu/activities/supervisory-convergence/supervisory-disclosure/rules-and-guidance.
[8] Nauta Dutilh, „Toelaatbaarheid Nationale Hypotheek Garantie als kredietprotectie onder de CRR,” 2020. [Online]. Available: https://www.nhg.nl/media/rhkhtqbx/nhg-memorandum-over-crr-toelaatbaarheid-31-maart-2020-pdf.pdf
[9] Stichting Waarborgfonds Eigen Woningen, „Statuten NHG,” 2019. [Online]. Available: https://www.nhg.nl/media/4vvcjw4p/statuten-wew-per-23-december-2019.pdf
- As of January 2014, a 10% loss sharing rule was introduced, meaning NHG guarantees only 90% of the residual debt. ↩︎
- NHG statutes article 11 allow Dutch ministers to appoint 3 out of 5 members of the supervisory board, which together appoint the 6th member. This effectively means that the Dutch government controls 4 out of 6 members [9]. ↩︎
- As fallback, Stichting WEW must be allocated to the corporate exposure class following CRR III article 147(7). ↩︎
- Article 214 does not influence the exposure class of direct exposure to the protection provider, only the exposure class of the NHG guarantee itself. ↩︎
- The alternatives are not recognizing the counter-guarantee, and either using the 20% risk weight implied by Stichting WEW’s AAA rating following CRR III article 116 using the SA approach, or using the IRB risk weight of Stichting WEW using the IRB approach. Both will lead to higher risk weights than 0% and lead to higher capital requirements. ↩︎
Converging on resilience: Integrating CCR, XVA, and real-time risk management

In a world where the Fundamental Review of the Trading Book (FRTB) commands much attention, it’s easy for counterparty credit risk (CCR) to slip under the radar.
However, CCR remains an essential element in banking risk management, particularly as it converges with valuation adjustments. These changes reflect growing regulatory expectations, which were further amplified by recent cases such as Archegos. Furthermore, regulatory focus seems to be shifting, particularly in the U.S., away from the Internal Model Method (IMM) and toward standardised approaches. This article provides strategic insights for senior executives navigating the evolving CCR framework and its regulatory landscape.
Evolving trends in CCR and XVA
Counterparty credit risk (CCR) has evolved significantly, with banks now adopting a closely integrated approach with valuation adjustments (XVA) — particularly Credit Valuation Adjustment (CVA), Funding Valuation Adjustment (FVA), and Capital Valuation Adjustment (KVA) — to fully account for risk and costs in trade pricing. This trend towards blending XVA into CCR has been driven by the desire for more accurate pricing and capital decisions that reflect the true risk profile of the underlying instruments/ positions.
In addition, recent years have seen a marked increase in the use of collateral and initial margin as mitigants for CCR. While this approach is essential for managing credit exposures, it simultaneously shifts a portion of the risk profile into contingent market and liquidity risks, which, in turn, introduces requirements for real-time monitoring and enhanced data capabilities to capture both the credit and liquidity dimensions of CCR. Ultimately, this introduces additional risks and modelling challenges with respect to wrong way risk and clearing counterparty risk.
As banks continue to invest in advanced XVA models and supporting technologies, senior executives must ensure that systems are equipped to adapt to these new risk characteristics, as well as to meet growing regulatory scrutiny around collateral management and liquidity resilience.
The Internal Model Method (IMM) vs. SA-CCR
In terms of calculating CCR, approaches based on IMM and SA-CCR provide divergent paths. On one hand, IMM allows banks to tailor models to specific risks, potentially leading to capital efficiencies. SA-CCR, on the other hand, offers a standardised approach that’s straightforward yet conservative. Regulatory trends indicate a shift toward SA-CCR, especially in the U.S., where reliance on IMM is diminishing.
As banks shift towards SA-CCR for Regulatory capital and IMM is used increasingly for internal purposes, senior leaders might need to re-evaluate whether separate calibrations for CVA and IMM are warranted or if CVA data can inform IMM processes as well.
Regulatory focus on CCR: Real-time monitoring, stress testing, and resilience
Real-time monitoring and stress testing are taking centre stage following increased regulatory focus on resilience. Evolving guidelines, such as those from the Bank for International Settlements (BIS), emphasise a need for efficiency and convergence between trading and risk management systems. This means that banks must incorporate real-time risk data and dynamic monitoring to proactively manage CCR exposures and respond to changes in a timely manner.
CVA hedging and regulatory treatment under IMM
CVA hedging aims to mitigate counterparty credit spread volatility, which affects portfolio credit risk. However, current regulations limit offsetting CVA hedges against CCR exposures under IMM. This regulatory separation of capital for CVA and CCR leads to some inefficiencies, as institutions can’t fully leverage hedges to reduce overall exposure.
Ongoing BIS discussions suggest potential reforms for recognising CVA hedges within CCR frameworks, offering a chance for more dynamic risk management. Additionally, banks are exploring CCR capital management through LGD reductions using third-party financial guarantees, potentially allowing for more efficient capital use. For executives, tracking these regulatory developments could reveal opportunities for more comprehensive and capital-efficient approaches to CCR.
Leveraging advanced analytics and data integration for CCR
Emerging technologies in data analytics, artificial intelligence (AI), and scenario analysis are revolutionising CCR. Real-time data analytics provide insights into counterparty exposures but typically come at significant computational costs: high-performance computing can help mitigate this, and, if coupled with AI, enable predictive modelling and early warning systems. For senior leaders, integrating data from risk, finance, and treasury can optimise CCR insights and streamline decision-making, making risk management more responsive and aligned with compliance.
By leveraging advanced analytics, banks can respond proactively to potential CCR threats, particularly in scenarios where early intervention is critical. These technologies equip executives with the tools to not only mitigate CCR but also enhance overall risk and capital management strategies.
Strategic considerations for senior executives: Capital efficiency and resilience
Balancing capital efficiency with resilience requires careful alignment of CCR and XVA frameworks with governance and strategy. To meet both regulatory requirements and competitive pressures, executives should foster collaboration across risk, finance, and treasury functions. This alignment will enhance capital allocation, pricing strategies, and overall governance structures.
For banks facing capital constraints, third-party optimisation can be a viable strategy to manage the demands of SA-CCR. Executives should also consider refining data integration and analytics capabilities to support efficient, resilient risk management that is adaptable to regulatory shifts.
Conclusion
As counterparty credit risk re-emerges as a focal point for financial institutions, its integration with XVA, and the shifting emphasis from IMM to SA-CCR, underscore the need for proactive CCR management. For senior risk executives, adapting to this complex landscape requires striking a balance between resilience and efficiency. Embracing real-time monitoring, advanced analytics, and strategic cross-functional collaboration is crucial to building CCR frameworks that withstand regulatory scrutiny and position banks competitively.
In a financial landscape that is increasingly interconnected and volatile, an agile and resilient approach to CCR will serve as a foundation for long-term stability. At Zanders, we have significant experience implementing advanced analytics for CCR. By investing in robust CCR frameworks and staying attuned to evolving regulatory expectations, senior executives can prepare their institutions for the future of CCR and beyond thereby avoiding being left behind.
Confirmed Methodology for Credit Risk in EBA 2025 Stress Test

On November 12 2024, the confirmed methodology for the EBA 2025 stress testing exercise was published on the EBA website. This is the final version of the draft for initial consultation that was published earlier.
| The timelines for the entire exercise have been extended to accommodate the changes in scope: | |
| Launch of exercise (macro scenarios) | Second half of January 2025 |
| First submission of results to the EBA | End of April 2025 |
| Second submission to the EBA | Early June 2025 |
| Final submission to the EBA | Early July 2025 |
| Publication of results | Beginning of August 2025 |
Below we share the most significant aspects for Credit Risk and related challenges. In the coming weeks we will share separate articles to cover areas related to Market Risk, Net Interest Income & Expenses and Operational Risk.
The final methodology, along with the requirements introduced by the CRR3 poses significant challenges on the execution of the Credit Risk stress testing. Earlier we provided details on this topic and possible impacts on stress testing results, see our article: “Implications of CRR3 for the 2025 EU-wide stress test” Regarding the EBA 2025 stress test we view the following 5 points as key areas of concern:
1- The EBA stress test requires different starting points; actual and restated CRR3 figures. This raises requirements in data management, reporting and implementation of related processes.
2- The EBA stress test requires banks to report both transitional and fully loaded results under CRR3; this requires the execution of additional calculations and implementation of supporting data processes.
3- The changes in classification of assets require targeted effort on the modelling side, stress test approach and related data structures.
4- Implementation of the Standardized Approach output floor as part of the stress test logic.
5- Additional effort is needed to correctly align Pillar 1 and Pillar 2 models, in terms of development, implementation and validation.
At Zanders, we specialize in risk advisory and our consultants have participated in every single EU wide stress testing exercise, as well as a few others going back to the initial stress tests in 2009 following the Great Financial Crisis. We can support you throughout all key stages of the stress testing exercise across all areas to ensure a successful submission of the final templates.
Based on the expertise in Stress Testing we have gained over the last 15 years, our clients benefit the most from our services in these areas:
- Full gap analysis against latest set of requirements
- Review, design and implementation of data processes & relevant data quality controls
- Alignment of Pillar 2 models to Pillar 1 (including CCR3 requirements)
- Design, implementation and execution of stress testing models
- Full automation of populating EBA templates including reconciliation and data quality checks.
Contact us for more information about how we can help make this your most successful run yet. Reach out to Martijn de Groot, Partner at Zanders.
Implications of CRR3 for the 2025 EU-wide stress test

An overview of how the new CRR3 regulation impacts banks’ capital requirements for credit risk and its implications for the 2025 EU-wide stress test, based on EBA’s findings.
With the introduction of the updated Capital Requirements Regulation (CRR3), which has entered into force on 9 July 2024, the European Union's financial landscape is poised for significant changes. The 2025 EU-wide stress test will be a major assessment to measure the resilience of banks under these new regulations. This article summarizes the estimated impact of CRR3 on banks’ capital requirements for credit risk based on the results of a monitoring exercise executed by the EBA in 2022. Furthermore, this article comments on the potential impact of CRR3 to the upcoming stress test, specifically from a credit risk perspective, and describes the potential implications for the banking sector.
The CRR3 regulation, which is the implementation of the Basel III reforms (also known as Basel IV) into European law, introduces substantial updates to the existing framework [1], including increased capital requirements, enhanced risk assessment procedures and stricter reporting standards. Focusing on credit risk, the most significant changes include:
- The phased increase of the existing output floor to internally modelled capital requirements, limiting the benefit of internal models in 2028 to 72.5% of the Risk Weighted Assets (RWA) calculated under the Standardised Approach (SA), see Table 1. This floor is applied on consolidated level, i.e. on the combined RWA of all credit, market and operational risk.

- A revised SA to enhance robustness and risk sensitivity, via more granular risk weights and the introduction of new asset classes.1
- Limiting the application of the Advanced Internal Ratings Based (A-IRB) approach to specific asset classes. Additionally, new asset classes have been introduced.2
After the launch of CRR3 in January 2025, 68 banks from the EU and Norway, including 54 from the Euro area, will participate in the 2025 EU-wide stress test, thus covering 75% of the EU banking sector [2]. In light of this exercise, the EBA recently published their consultative draft of the 2025 EU-wide Stress Test Methodological Note [3], which reflects the regulatory landscape shaped by CRR3. During this forward-looking exercise the resilience of EU banks in the face of adverse economic conditions will be tested within the adjusted regulatory framework, providing essential data for the 2025 Supervisory Review and Evaluation Process (SREP).
The consequences of the updated regulatory framework are an important topic for banks. The changes in the final framework aim to restore credibility in the calculation of RWAs and improve the comparability of banks' capital ratios by aligning definitions and taxonomies between the SA and IRB approaches. To assess the impact of CRR3 on the capital requirements and whether this results in the achievement of this aim, the EBA executed a monitoring exercise in 2022 to quantify the impact of the new regulations, and published the results (refer to the report in [4]).
For this monitoring exercise the EBA used a sample of 157 banks, including 58 Group 1 banks (large and internationally active banks), of which 8 are classified as a Global Systemically Important Institution (G-SII), and 99 Group 2 banks. Group 1 banks are defined as banks that have Tier 1 capital in excess of EUR 3 billion and are internationally active. All other banks are labelled as Group 2 banks. In the report the results are separated per group and per risk type.
Looking at the impact on the credit risk capital requirements specifically caused by the revised SA and the limitations on the application of IRB, the EBA found that the median increase of current Tier 1 Minimum Required Capital3 (hereafter “MRC”) is approximately 3.2% over all portfolios, i.e. SA and IRB approach portfolios. Furthermore, the median impact on current Tier 1 MRC for SA portfolios is approximately 2.1% and for IRB portfolios is 0.5% (see [4], page 31). This impact can be mainly attributed to the introduction of new (sub) asset classes with higher risk weights on average. The largest increases are expected for ‘equities’, ‘equity investment in funds’ and ‘subordinated debt and capital instruments other than equity’. Under adverse scenarios the impact of more granular risk weights may be magnified due to a larger share of exposures having lower credit ratings. This may result in additional impact on RWA.
The revised SA results in more risk-sensitive capital requirements predictions over the forecast horizon due to the more granular risk weights and newly introduced asset classes. This in turn allows banks to more clearly identify their risk profile and provides the EBA with a better overview of the performance of the banking sector as a whole under adverse economic conditions. Additionally, the impact on RWA caused by the gradual increase of the output floor, as shown in Table 1, was estimated. As shown in Table 2, it was found that the gradual elevation of the output floor increasingly affects the MRC throughout the phase-in period (2023-2028).
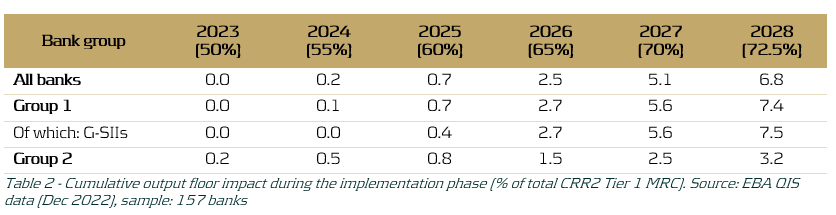
Table 2 demonstrates that the impact is minimal in the first three years of the phase-in period, but grows significantly in the last three years of the phase-in period, with an average estimated 7.5% increase in Tier 1 MRC for G-SIIs in 2028. The larger increase in Tier 1 MRC for Group 1 banks, and G-SIIs in particular, as compared to Group 2 banks may be explained by the fact that larger banks more often employ an IRB approach and are thus more heavily impacted by an increased IRB floor, relative to their smaller counterparts. The expected impact on Group 1 banks is especially interesting in the context of the EU-wide stress test, since for the regulatory stress test only the 68 largest banks in Europe participate. Assuming that banks need to employ an increasing version of the output floor for their projections during the 2025 EU-wide stress test, this could lead to significant increases in capital requirements in the last years of the forecast horizon of the RWA projections. These increases may not be fully attributed to the adverse effects of the provided macroeconomic scenarios.
Conversely, it is good to note that a transition cap has been introduced by the Basel III reforms and adopted in CRR3. This cap puts a limit on the incremental increase of the output floor impact on total RWAs. The transitional period cap is set at 25% of a bank’s year-to-year increase in RWAs and may be exercised at the discretion of supervisors on a national level (see [5]). As a consequence, this may limit the observed increase in RWA during the execution of the 2025 EU-wide stress test.
In conclusion, the implementation of CRR3 and its adoption into the 2025 EU-wide stress test methodology may have a significant impact on the stress test results, mainly due to the gradual increase in the IRB output floor but also because of changes in the SA and IRB approaches. However, this effect may be partly mitigated by the transitional 25% cap on year-on-year incremental RWA due to the output floor increase. Additionally, the 2025 EU-wide stress test will provide a comprehensive view of the impact of CRR3, including the closer alignment between the SA and the IRB approaches, on the development of capital requirements in the banking sector under adverse conditions.
References:
- final_report_on_amendments_to_the_its_on_supervisory_reporting-crr3_crd6.pdf (europa.eu)
- The EBA starts dialogue with the banking industry on 2025 EU-Wide stress test methodology | European Banking Authority (europa.eu)
- 2025 EU-wide stress test - Methodological Note.pdf (europa.eu)
- Basel III monitoring report as of December 2022.pdf (europa.eu)
- Basel III: Finalising post-crisis reforms (bis.org)
- This includes the addition of the ‘Subordinated debt exposures’ asset class, as well as an additional branch of specialized lending exposures within the corporates asset class. Furthermore, a more detailed breakdown of exposures secured by mortgages on immovable property and acquisition, development and construction financing? has been introduced. ↩︎
- For in detailed information on the added asset classes and limited application of IRB refer to paragraph 25 of the report in [1]. ↩︎
- Tier 1 capital refers to the core capital held in a bank's reserves. It includes high-quality capital, predominantly in the form of shares and retained earnings that can absorb losses. The Tier 1 MRC is the minimum capital required to satisfy the regulatory Tier 1 capital ratio (ratio of a bank's core capital to its total RWA) determined by Basel and is an important metric the EBA uses to measure a bank’s health. ↩︎


