How to value a cross-currency swap

Since the first transaction in 1981 between the World Bank and IBM, the market of cross-currency swaps has grown rapidly. It represents, according to the Bank of International Settlements, an outstanding notional amount of USD 16,347 billion as per June 2010. In this article we will discuss how cross-currency swaps work, and how to value them.
A cross-currency swap (CCS), can have different objectives. It can reduce the exposure to exchange rate fluctuation or it can provide arbitrage opportunities between different rates. It can be used for example, if a European company is looking to acquire some US dollar bonds but does not want to expose itself to US dollar risk. In this case it is possible to do a CCS transaction with a US-based bank. The European company is paying in euros and receives a (fixed) US dollar cash flow. With these flows the European company can meet its US dollar obligations.
The valuation of a CCS is quite similar to the valuation of an interest-rate swap. The CCS is valued by discounting the future cash flows for both legs at the market interest rate applicable at that time. The sum of the cash flows denoted in the foreign currency (hereafter euro) is converted with the spot rate applicable at that time. One big difference with an interest-rate swap is that a CCS always has an exchange of notional.
Looking at a CCS with a fixed-fixed structure (both legs of the swap have a fixed rate), the undiscounted cash flows are already known at the start of the deal, they are simply the product of the notional, the fixed rate and the year fraction.
The discounting of the cash flows requires a more complex method. The US dollar curve is the base of everything and is, therefore, not different from valuations of plain vanilla US dollar interest-rate swaps. Looking at a euro/US dollar CCS, the eurocurve (excluding credit spreads) is made of two parts:
- The euro interest rate curve and
- The basis spread.
This basis spread curve represents a ‘compensation’ for the changes in the forward FX rates between the two currencies used in the swap. Before the global credit crisis this spread was close to zero. Nowadays, the spread ranges from 18 basis points (bp) (10-year spread) to 40bp (one-year spread), but reached 120bp as shown by figure 1.
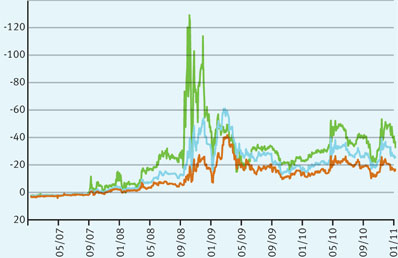
The big peak which is visible in the last quarter of 2008 was caused by the credit crisis (the default of Lehman Brothers and Bear Stearns, and the sale of Merrill Lynch, etc). Due to the lack of liquidity in the market during the crisis, the (liquidity) spreads in the US became a lot higher than those in Europe. To make up for this window of arbitrage, the basis spread decreased at a similar pace.
Here is an example: The characteristics of our USD-EUR example swap are:
The first leg in US dollar has a notional of USD 10,000,000 and a fixed interest of 2.50%
The valuation is performed at January 31st, 2011. The FX rate at that moment was EUR/USD 1.3697. The second leg in euro has a notional of EUR 7,481,670 and a fixed interest of 3.00%. The valuation is done from the perspective of the party which pays the euro flows and receives the US dollar flows. The frequency of the payment is annual and there is no amortization of the notional.
- In columns B and E the future cash flows are calculated by multiplying the notional with the fixed rate applicable for that leg. This results in cash flows of USD 250,000 (column B) and -/- EUR 224,450 (column E).
- The market value of the cash flows is calculated by multiplying the cash flows with their discount factor (column C for the US dollar and column F for the euro).
- The euro market value (column G) is converted to US dollar by multiplying it with the spot EUR/USD, i.e. 1.3697. Adding this converted value to the US dollar market value of column D results in the net market value (column H).
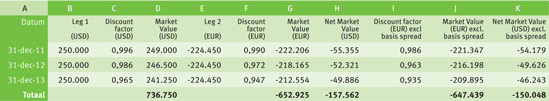
To demonstrate the impact of the basis spread we will repeat step 2 and 3 without the basis spread. The euro market value excluding basis spread is shown in column J, it is calculated by multiplying column E and I. The adjusted net market values are shown in column K. The difference of the sum of column H and K is 7,5 basis points of the US dollar notional. The basis spread impact can be checked, for the first year, by calculating the variation between the value in column G (222,206) with the value in column J (221,347), the result is 39bp which is in line with figure 1.
The above calculation shows that the exclusion of the basis spread in the valuation of the cross-currency swap results in a wrong net market value.
How do you value a credit default swap?

Since the first transaction in 1981 between the World Bank and IBM, the market of cross-currency swaps has grown rapidly. It represents, according to the Bank of International Settlements, an outstanding notional amount of USD 16,347 billion as per June 2010. In this article we will discuss how cross-currency swaps work, and how to value them.
Multi-billionaire Warren Buffet once called these products 'weapons of mass destruction', because he thought they were partly responsible for causing the credit crunch. Despite this remark, there is still a buoyant trade in credit default swaps. Here we discuss how they work, and how they are valued.
A credit default swap, or CDS, is effectively an insurance product whereby the consequences of a bankruptcy (default) of a reference party are transferred in return for a periodic payment. Take, for example, a party that wishes to purchase or has already purchased a bond, but is keen to avoid the (further) risk that the seller will go bankrupt. By concluding a CDS, any loss sustained in the case of default is compensated, or paid off, in return for a periodic payment; the premium for the CDS.
The CDS is valued in much the same way as its cousin, the interest rate swap. In an interest rate swap, the exchange of fixed and variable interest cash flows is valued by estimating the amount of the future cash flows in advance. These cash flows are then discounted at the market interest rate applicable at that time and added up. In the case of a CDS, two types of cash flow are also exchanged. Firstly, a series of cash flows from the risk seller to the risk buyer, including the periodic payment of the premium. These cash flows are then exchanged for a (possible) cash flow from risk buyer to risk seller in the event of a default. The periodic payment ceases immediately if that bankruptcy actually takes place.
rating transition matrix
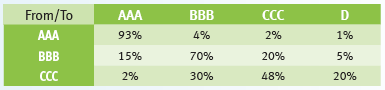
The greatest uncertainty in valuing a CDS is the moment of bankruptcy. This is generally determined by means of probability distribution and modeled on the basis of the ‘probability of default’ (PD). This probability can be obtained in the market by combining the rating of the bond with the rating transition matrix. These ratings are prepared by rating agencies. A triple-A rating is considered to denote ‘virtually risk-free’, a D rating means that a default event has already occurred. The matrix then indicates how great the probability is that a reference party will migrate from one rating to another.
Table 1 is a fictitious example of a rating transition matrix:
In order to illustrate the valuation of the CDS, we give an example of a credit default swap with the following assumptions:
- the term is two years,
- in case of bankruptcy, the loss is equal to the entire principal,
- the reference party’s current rating is BBB,
- we take the (fictitious) rating transition matrix from table 1, and
- the premium on the CDS is 4% of the principal.
Table 2 shows the probability distribution when calculating the moment of default:
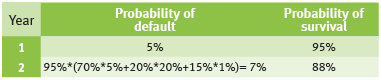
Explanation of table 2:
In year 1, the probability of default (the probability of migration from rating BBB to D) is: 5%. Taking into account this probability of default in that first year, the robability of bankruptcy in year 2 is 95%, multiplied by the following two-stage default probabilities:
- constant year 1 (BBB), followed by bankruptcy (70% x 5%),
- downgrade to CCC, followed by bankruptcy (20% x 20%), and
- upgrade to AAA, followed by bankruptcy (15% x1%).
The anticipated cash flows that are payable are equal to the premium in the first year (4) and 95% of the premium in the second year (95% x 4=3.8). The anticipated cash flows that are receivable are equal to 5% of the principal (5) in the first year and 7% of the principal in the second year (7).
Assuming an interest rate of 2% per year, the following calculations apply:
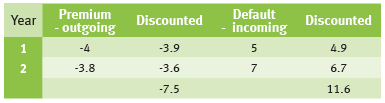
The market value of the CDS is positive because the discounted present value of the premium payments is lower than the anticipated payments in the case of bankruptcy.


