

This article outlines key focus areas for an evolving treasury function, detailing how it can effectively support the organization’s growth trajectory and ensure long-term financial resilience.
As mid-sized corporations expand, enhancing their Treasury function becomes essential. International growth, exposure to multiple currencies, evolving regulatory requirements, and increased working capital demands are key indicators of the need for a well-structured Treasury function. These factors heighten the risk of challenges such as limited cash visibility, foreign exchange fluctuations, and a greater need for centralization and diverse financing sources—making a solid policy framework essential. A Treasury function built around a clear Target Operating Model (TOM) is critical for managing this complexity and enabling sustainable growth.
Zanders has deep experience in helping companies of all sizes define and optimize their Treasury TOM—from small businesses to global multinationals. Across industries from pharmaceuticals to manufacturing, we support organizations at every stage of treasury maturity. A well-designed TOM gives you a roadmap to transform Treasury into a strategic, scalable capability.
Benchmarking your Treasury Performance: Know Where You Stand
A treasury benchmark study provides a clear and objective view of how your treasury function compares to peers and industry best practices. It helps to identify strengths, spot inefficiencies, and uncover opportunities to enhance performance and resilience.
This kind of assessment is especially valuable during periods of rapid growth, when your treasury must adapt to increasing complexity. It also proves to be critical during major events such as mergers, acquisitions, or shifts in the market, where quick adaptation is key.
Benchmarking is more than a comparison exercise. It delivers clarity on your current state and defines what’s needed to evolve. That insight becomes the foundation for targeted improvements, stronger risk management, and the development of a TOM that aligns with your organization’s goals.
In the sections below, we outline two key areas to consider and how benchmarking provides the insights needed to build your optimal treasury roadmap.
Strategic Alignment in Action: Optimizing Organizational Structures for Sustainable Growth
As organizations grow, it becomes increasingly important to clearly define treasury responsibilities separately from those of the broader finance function. At the same time, integrating Treasury into the interconnected structure of the Office of the CFO helps build a stronger and more resilient finance organization. A common challenge in change management arises when legacy definitions of roles and responsibilities remain unaddressed. For example, certain processes—such as reconciliation—may continue to be performed within the ERP system simply because “that’s how it’s always been done,” even if it’s no longer the most efficient approach. In some cases, the accounting team may lack the capacity to take ownership of such tasks, resulting in inefficiencies and blurred accountability.
A TOM review creates the opportunity to redefine treasury roles, policies, and processes. This should be revisited regularly to keep it aligned with the organization's structure and goals.
Key Opportunities for Policy and Procedure Optimization:
- Consolidation and Standardization: Implementing unified policies and procedures can enhance efficiency and consistency across the organization. This involves consolidating knowledge, standardizing processes, and ensuring that all departments operate in alignment with organizational goals.
- Enhancing Segregation of Duties: Reviewing and refining the organizational structure can better support the segregation of duties, reducing risks and improving operational integrity. This involves defining clear roles and responsibilities to ensure effective internal controls.
- Streamlining Operations: Centralizing certain activities currently performed locally can lead to streamlined operations, improved efficiency, and reduced costs. Centralization allows for standardized procedures, clearer decision-making processes, and improved resource utilization.
- Strategic Resource Realignment: Redirecting treasury resources from routine operational tasks to strategic initiatives can significantly enhance the treasury's value proposition. By automating non-core activities, the treasury can focus on high-impact projects and internal consulting roles, driving business growth and strategic alignment
Alongside a review and assessment of the organizational structure, a deep dive into the treasury technology landscape of an organization is another key aspect to consider when transforming a treasury.
Technology as a tool
While large organizations typically have an ERP or TMS in place, many small to mid-sized companies have not yet reached that level of maturity. In these organizations, treasury functions often rely heavily on spreadsheets, which can be cumbersome and prone to error. Additionally, treasurers must log into multiple bank portals to gather essential data for reconciliation and forecasting. As the company grows, the time spent on these manual processes increases, along with the risk of mistakes and inefficiencies.
Recognizing the need for modernization, treasurers are increasingly focusing on upgrading treasury technology. As mid-sized corporations scale and face greater financial complexity, the reliance on outdated, custom-developed solutions and manual processes becomes more problematic. This makes the need for an enhanced treasury management system even more critical to efficiently manage financial operations and reduce operational risks.
Key opportunities for a Treasury Technology Upgrade:
- Enhanced Flexibility and Scalability: Upgrading to cloud-based treasury management systems (TMS) can provide greater flexibility, scalability, and cost efficiency compared to traditional onsite systems. This allows for easier access and management of treasury operations across different locations and teams.
- Advanced Reporting Capabilities: Real-Time Financial Insights: Implementing a more advanced TMS can address reporting challenges by providing accurate, real-time financial insights. This capability enables treasurers to make timely and informed decisions, enhancing overall financial management and strategic planning.
- Streamlined Operations: Upgrading to a system with seamless integration capabilities can automate processes, reduce operational delays, and minimize errors. This integration ensures that all systems communicate effectively, fostering a more efficient and cohesive treasury environment.
- Efficient Cost Management and Regulatory Compliance: A modern TMS can help achieve significant cost savings and improve compliance by supporting segregation of duties and multi-level approval processes. This ensures adherence to regulatory requirements while optimizing operational expenses.
- Improved Cash Management: Access to real-time data, such as global cash positions, is crucial for effective decision-making and cash management. Upgrading to a system that provides these insights can enhance treasury operations by allowing for proactive management of liquidity and financial risks.
Organizations should carefully evaluate when and how to upgrade their TMS, recognizing signs of inadequacy, understanding the benefits, and identifying essential features. A suitable TMS will not only optimize treasury operations but also provide the necessary tools for effective financial management, maintaining a competitive edge in an evolving landscape.
Build a Strategic Roadmap
With the insights gained from benchmarking, organizations can define their long-term target state and build a tailored solution design. This becomes the foundation for a strategic roadmap that outlines the initiatives needed to elevate your treasury function. Whether the focus is on technology upgrades, process improvements, or resource realignment, each initiative should shape a treasury function that is agile, efficient, and growth ready. A fit-for-purpose treasury is not just a support function; it is a strategic asset that underpins long-term performance and resilience.
If you wish to learn more about how we can support the growth of your organization through the treasury function, please contact Ernest Huizing or Vincent Casterman.

As FRTB tightens the screws on capital requirements, banks must get smart about capital attribution.
Industry surveys show that FRTB may lead to a 60% increase in regulatory market risk capital requirements, placing significant pressure on banks. As regulatory market risk capital requirements rise, it is imperative that banks employ robust techniques to effectively understand and manage the drivers of capital. However, isolating these drivers can be challenging and time-consuming, often relying on inefficient and manual techniques. Capital attribution techniques provide banks with a solution by automating the analysis and understanding of capital drivers, enhancing their efficiency and effectiveness in managing capital requirements.
In this article, we share our insights on capital attribution techniques and use a simulated example to compare the performance of several approaches.
The benefits of capital attribution
FRTB capital calculations require large amounts of data which can be difficult to verify. Banks often use manual processes to find the drivers of the capital, which can be inefficient and inaccurate. Capital attribution provides a quantification of risk drivers, attributing how each sub-portfolio contributes to the total capital charge. The ability to quantify capital to various sub-portfolios is important for several reasons:

An overview of approaches
There are several existing capital attribution approaches that can be used. For banks to select the best approach for their individual circumstances and requirements, the following factors should be considered:
- Full Allocation: The sum of individual capital attributions should equal the total capital requirements,
- Accounts for Diversification: The interactions with other sub-portfolios should be accounted for,
- Intuitive Results: The results should be easy to understand and explain.
In Table 1, we summarize the above factors for the most common attribution methodologies and provide our insights on each methodology.

Table 1: Comparison of common capital attribution methodologies.
Comparison of approaches: A simulated example
To demonstrate the different performance characteristics of each of the allocation methodologies, we present a simulated example using three sub-portfolios and VaR as a capital measure. In this example, although each of the sub-portfolios have the same distribution of P&Ls, they have different correlations:
- Sub-portfolio B has a low positive correlation with A and a low negative correlation with C,
- Sub-portfolios A and C are negatively correlated with each other.
These correlations can be seen in Figure 1, which shows the simulated P&Ls for the three sub-portfolios.

Figure 1: Simulated P&L for the three simulated sub-portfolios: A, B and C.
The capital allocation results are shown below in Figure 2. Each approach produces an estimate for the individual sub-portfolio capital allocations and the sum of the sub-portfolio capitals. The dotted line indicates the total capital requirement for the entire portfolio.

Figure 2: Comparison of capital allocation methodologies for the three simulated sub-portfolios: A, B and C. The total capital requirement for the entire portfolio is given by the dotted line.
Zanders’ verdict
From Figure 2, we see that several results do not show this attribution profile. For the Standalone and Scaled Standalone approaches, the capital is attributed approximately equally between the sub-portfolios. The Marginal and Scaled Marginal approaches include some estimates with negative capital attribution. In some cases, we also see that the estimate for the sum of the capital attributions does not equal the portfolio capital.
The Shapley method is the only method that attributes capital exactly as expected. The Euler method also generates results that are very similar to Shapley, however, it allocates almost identical capital in sub-portfolios A and C.
In practice, the choice of methodology is dependent on the number of sub-portfolios. For a small number of sub-portfolios (e.g. attribution at the level of business areas) the Shapley method will result with the most intuitive and accurate results. For a large number of sub-portfolios (e.g. attribution at the trade level), the Shapley method may prove to be computationally expensive. As such, for FRTB calculations, we recommend using the Euler method as it is a good compromise between accuracy and cost of computation.
Conclusion
Understanding and implementing effective capital attribution methodologies is crucial for banks, particularly given the increased future capital requirements brought about by FRTB. Implementing a robust capital attribution methodology enhances a bank's overall risk management framework and supports both regulatory compliance and strategic planning. Using our simulated example, we have demonstrated that the Euler method is the most practical approach for FRTB calculations. Banks should anticipate capital attribution issues due to FRTB’s capital increases and develop reliable attribution engines to ensure future financial stability.
For banks looking to anticipate capital attribution issues and potentially mitigate FRTB’s capital increases, Zanders can help develop reliable attribution engines to ensure future financial stability. Please contact Dilbagh Kalsi (Partner) or Robert Pullman (Senior Manager) for more information.

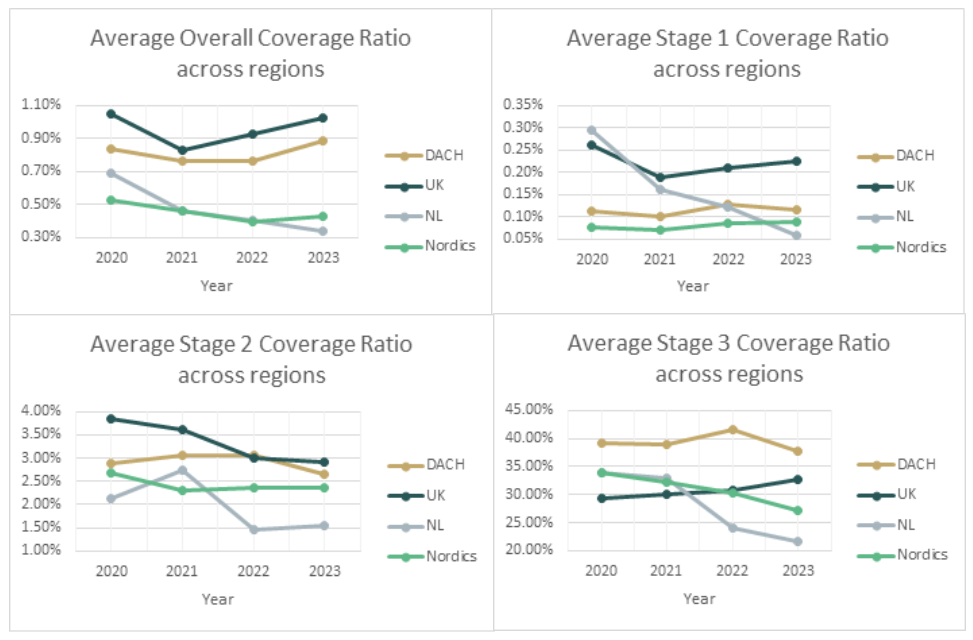
Zanders has conducted an annual report study for IFRS 9 results across 4 different European markets. These regions are the Nordics, the Netherlands, DACH and the UK.
First, these regions were analyzed independently such that common trends and differences could be noted within. These results were aggregated for each region such that these regions could be compared with each other. The results show that within European regions the year-on-year trends are similar between banks, but that across these regions the trends do differ across the years. Because the systemic macroeconomic trends the last years were similar between regions (Covid-19 and the war in Ukraine ), it shows that there are significant cultural differences in how ECLs are modelled. This shows that there is a need for alignment between European regions for which Zanders can assist. Namely, we have a presence in each of these regions and are actively monitoring development in the area of IFRS 9 (also see our previous research on IFRS 9).
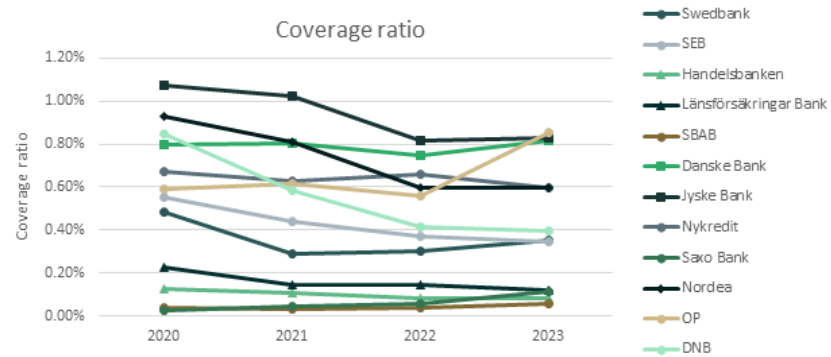
Nordics
The overall coverage ratios for most of the Danish, Swedish, Norwegian and Finnish banks1 (Nordic region) showed a slightly decreasing trend from 2020 to 2023, except for OP, which had a significant absolute increment of 0.25% to 0.86% in 2023 compared with the previous three years due to an increase in the stage 2 coverage ratio and a higher Stage 1 to 2 ratio. OP also had the highest overall coverage ratio among the sampled banks. The decreasing trend in the overall coverage ratio was primarily attributed to the decline in the Stage 3 coverage ratio.
On the other hand, the change in the Stage 1 coverage ratio was relatively stable over the years, with an absolute difference of less than 0.09% between the maximum and minimum values across the four-year period. The Stage 2 coverage ratio exhibited a similar trend across banks, except for Jyske Bank, which showed a volatile pattern, with an absolute difference of over 3% between the maximum and minimum values throughout the four years, peaking at 4.74% in 2023. In addition, the overall and the Stage 3 coverage ratios varied from 0.06% to 0.86% and 16.3% to 45.6% across banks in 2023.
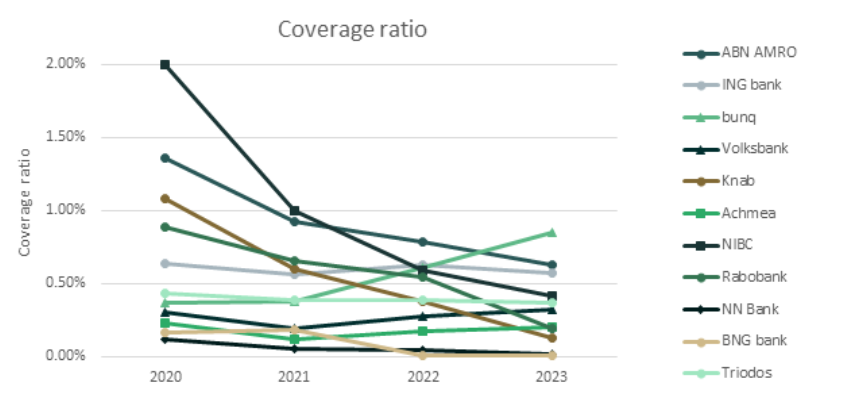
Netherlands
There was a slight decrease in the overall ECL results for the Dutch market2 over the four-year study period (also see the previous research on the Dutch market). This was primarily driven by an improved macroeconomic outlook and a further reversal of manual overlays that were applied during the COVID-19 period (e.g., ABN AMRO).
Compared with 2022, larger banks (Rabobank and ABN AMRO) showed a decrease in the overall coverage ratio with a higher weight given to the up scenario. In contrast, smaller banks tended to have a higher coverage ratio due to shifting more weight from the up scenario to the base scenario or changes in the underlying models.
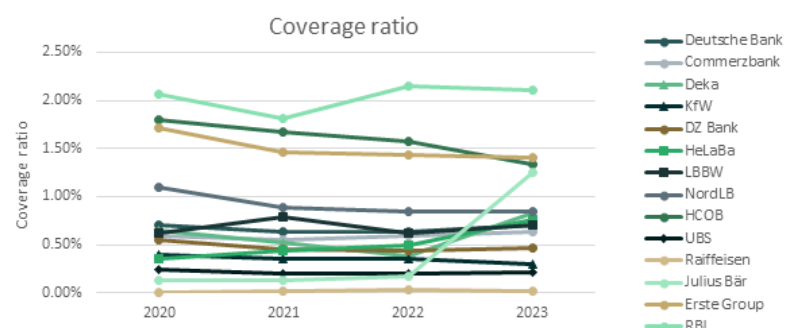
DACH
For the German, Austrian and Swiss region (DACH),3 a relatively stable trend was observed in the overall coverage ratio from 2020 to 2022, which was then countered by a sharp upward trend from 2022 to 2023. Among the banks noted, RBI stood out from its peers in reporting significantly higher overall, Stage 2 and Stage 3 coverage ratios during the study period. RBI is one of Austria's leading corporate and investment banks, operating in Central and Eastern European markets. In some Eastern European countries, Stage 2 loans remain exceptionally high, at 15 to 20 percent, leading to large overall and Stage 2 coverage ratios.
Compared to 2022, the increase in the overall coverage ratio can be attributed to higher Stage 2 coverage ratios for half of the sampled banks. Julius Bär also experienced an exceptionally high stage 3 coverage ratio of up to 93% in 2023, primarily from its Lombard loan portfolio.
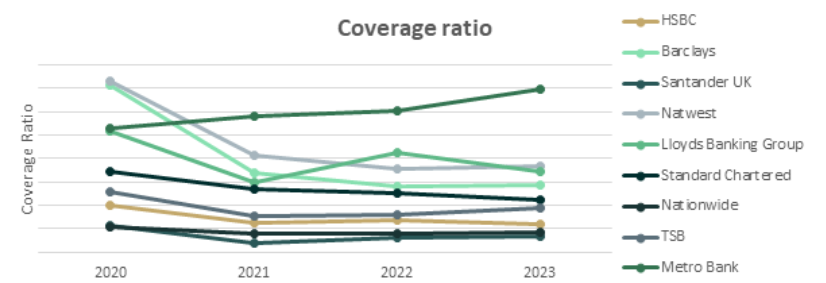
UK
During the benchmarking period from 2020 to 2023, most UK banks4 reported a decrease in the overall coverage ratio from 2020 to 2021. Then the overall coverage ratio stabilized for the remaining two years, except for one of the sampled banks, whose coverage ratio had been increasing since 2021 and recorded the second-highest overall coverage ratio in 2024 (i.e. 1.6% vs. the median of 0.8% for all sampled UK banks).
The highest coverage ratio of all years is from Monzo. As a relatively new digital bank focused on expanding, Monzo has significantly expanded its lending in recent years, with a doubling of the gross carrying amount in the latest reporting period. However, their overall coverage ratios remained high, at around 14% to 14.6% over the past two years. In the figure below (and the figures at the end of the article), Monzo has been excluded, as it individually inflated the results and rendered the other results unreadable.
Across regions
In general, all regions showed a decrease in the overall ECL coverage ratio during the initial benchmarking period, from 2020 to 2021. Compared to 2020, the coverage ratio in the most recent year has decreased, except for the DACH region, where the overall coverage ratio has reached a level comparable to that of the UK, due to a significant increase in Stage 2 numbers. The UK has the highest overall, as well as Stage 1 and Stage 2 coverage ratios, while the DACH region has the highest Stage 3 coverage ratios (i.e., the highest LGD).
In short, this shows that both the UK and DACH region demonstrate a higher overall coverage ratio, which seems to be consistent throughout all the years from 2020 onwards. Even the lowest reported average coverage ratio for the DACH region, 0.76% in 2021 is higher than the highest reported value for the Netherlands, 0.69% in 2020. As the values differ greatly between regions while the macroeconomic occurrences were similar (Covid-19, Ukraine war), it could be noted that this must be caused by significant differences in how the ECLs are modelled. And as markets are not aligned how to model ECL, it is worthwhile to further investigate how European regions can learn from each other in modeling ECL.
As Zanders has a presence in each of these regions and is in constant contact with many of the active banks in those regions, we are the best strategic partner to help improving your IFRS 9 modeling. Whether it is an independent validation of an existing model of if help is needed with the (re)development of new IFRS 9 models, we can help clients achieve the optimal accuracy with regards to their ECL estimates.
If you wish to learn more about IFRS 9 please contact Kasper Wijshoff.
Citations
- The Nordic banks that were included in the analysis were the following: Swedbank, SEB, Handelsbanken, Länsförsäkringar Bank, SBAB, Danske Bank, Jyske Bank, Nykredit, Nordea, OP, DNB. ↩︎
- The Dutch banks that were included in the analysis were the following: ABN AMRO, ING bank, bunq, Volksbank, Knab, Achmea, NIBC, Rabobank, NN Bank, BNG bank, Triodos. ↩︎
- The banks in the DACH region that were included in the analysis were the following: Deutsche Bank, Commerzbank, Deka, KfW, DZ Bank, HeLaBa, LBBW, NordLB, HCOB, UBS, Julius Bär, Erste Group, RBI. ↩︎
- The banks in the UK that were included in the analysis were the following: HSBC, Barclays, Santander UK, Natwest, Lloyds Banking Group, Standard Chartered, Monzo, Nationwide, TSB, Metro Bank, Close Brothers, Atom Bank, Revolut. ↩︎


With new EU rules on instant payments taking effect in October 2025, corporates must navigate the practical challenge of applying payee verification to file-based payment processes.
The EU instant payments regulation1 comes into force on the 5th October this year. Importantly from a corporate perspective, it includes a VoP (verification of payee) regulation that requires the originating banking partner (Payment Service Provider) to validate one of the following data options with the beneficiary bank:
- IBAN and Beneficiary Name
- IBAN and Identification (for example LEI or VAT number)
This beneficiary verification must be carried out as part of the payment initiation process and be completed before the payment can be potentially reviewed and authorized by the corporate and finally processed by the originating banking partner. Now whilst this concept of beneficiary verification works perfectly in the instant payments world as only individual payment transactions are processed, a material challenge exists where a corporate operates a bulk/batch payment (file based) model.
Many large corporates will pay vendor invoices (commercial payments) on a weekly or fortnightly basis or salaries on a monthly basis. Their ERP (Enterprise Resource Planning) system will complete a payment run and generate a file of pre-approved payment transactions which are sent via a secure connection to their banking partners. Typically, this automated file-based transmission contains pre-authorized transactions which has been contractually agreed with the banking partners. The banking partners will complete file syntax validation and a more detailed payment validation before processing the payment through the relevant clearing system.
If we focus on euro denominated electronic payments, these must be fully compliant with the new EU regulation from 5th October. This means the banking partners will need to verify the beneficiary information before the payment process can continue. So the banking partner will send an individual VoP check for each payment instruction contained within the payment file (batch of euro transactions) for the beneficiary bank to provide one of the following verification statuses:
- Match
- Close Match
- No Match
- Not applicable
The EU regulation then requires the banking partner to make the status available to the corporate to allow a review and approve or reject transactions based on the status that has been returned. This means there may be a ‘pause’ in the euro payments processing before the originating partner bank can proceed in processing the euro payment transactions. But this ‘pause’ may be exempted by contractual agreement, which is referred to as an ‘Opt-Out’. This is only available to corporates and covered in more detail below.
Key Considerations for the Corporate Community:
1- Notification of VoP Status: This new EU regulation will include the following status codes which will apply at a group and individual transaction level.
Group Status
RCVC Received Verification Completed
RVCM Received Verification Completed With Mismatches
Transaction Status
RCVC Received Verification Completed
RVNA Received Verification Completed Not Applicable
RVNM Received Verification Completed No Match
RVMC Received Verification Completed Match Closely
These new status codes have been designed to be provided in the ISO 20022 XML payment status message (pain.002.001.XX). However, a key question the corporate community need to ask their banking partners is around the flexibility that can be provided in supporting the communication of these VoP status codes. Does the corporate workflow already support the ISO XML payment status message and if so, can these new status codes be supported? At this stage, corporate community preference might be skewed towards leveraging a bank portal to access these new status codes, so an important area for discussion.
- Time to complete the VoP Check: The regulation includes a 5-second rule for a single payment transaction VoP request which includes the following activities:
- the time needed by the originating banking partner to identify the beneficiary bank based on the IBAN received,
- send the request to the beneficiary bank,
- beneficiary bank to check whether received info is associated to received IBAN,
- beneficiary bank to return the information,
- originating bank to return info to initiator.
If we now consider the timing based on a file of payments, the overall timing calculation becomes more challenging as it is expected originating banks will be executing multiple VoP requests in parallel. The EU regulation requires the originating banking partner to carry out the VoP check as soon as an individual transaction is ´unpacked´ from the associated batch of transactions. At this stage, a very rough estimate is that a file containing 100,000 transactions will take around 4 minutes to complete the full VoP process. But this is an approximate at this stage. The important point is that the corporate community will need to test the timings based on their specific euro payment logic to determine if existing file processing times need to be adjusted to respect existing agreed cut-off times and reduce the risk of late payments.
Corporate Action on VoP Status: This will be another area for discussion between the corporate and its banking partners, but the current options include:
- Authorize Regardless: Pre-authorise all payments, including those with mismatches.
- Review and Authorize: Review mismatches and provide explicit authorization for processing.
- Reject: mismatched payments or the entire batch.
The corporate discussion should also include how the review and approval can be undertaken. Given that the October deadline is fast approaching, the current expectation is that banking portals will be used to support this function, but this needs to be discussed including whether exceptions can be rejected individually, or if the whole file of transactions will need to be rejected. Whilst the corporate position is very clear that the exceptions only approach is required, it is still unclear if banks can support this flexibility.
Understanding the ‘Opt-Out’ Option:
Whilst the EU regulation does include an ‘opt-out’ option, meaning a VoP check will not be performed by the originating banking partners on euro transactions, this option currently only applies to bulk/batch payments and not a file containing a single payment transaction. Whilst the option to use a bank portal to make individual transactions has been suggested as a possible workaround, there is increasing corporate resistance to using bank portals given the automated secure file based processing that is now in place across many corporates.
The opt-out option needs to be contractually agreed with the relevant partner banks, so the corporate community will need to discuss this point in addition to understanding the options available for files containing single transactions, which will still be subject to the VoP verification requirement.
In conclusion
Whilst the industry continues to discuss the file based VoP model, the CGI-MP (common global implementation market practice) group which is an industry collaboration, is now recommending corporates to opt-out at this stage due to the various workflow challenges that currently exist. However, corporate and partner bank discussions will still be required around files containing single payment transactions.
There is no doubt VoP provides benefits in terms of mitigating the risk of fraudulent and misdirected payments, but the current EU design introduces material logistical challenges that require further broader discussion at an industry level.

Deforestation, pollution, and resource overuse are accelerating biodiversity loss, learn how to quantify your organization’s impact.
Human activities such as deforestation, pollution, and resource over-extraction have caused a dramatic decline in biodiversity, with approximately 1 million species at risk of extinction, highlighting the urgent need for financial institutions to adopt biodiversity footprinting methods to measure and mitigate their environmental impact. According to the 2019 Global Assessment Report on Biodiversity and Ecosystem Services by IPBES, about 1 million species are now threatened with extinction due to these human activities (Brondízio, Settele, Diaz, & Ngo, 2019). Moreover, WWF’s 2024 Living Planet Report documents a 73% decline in wildlife populations since 1970 (World Wildlife Fund, 2024). These findings underscore the urgency for action to conserve and restore natural environments.
We previously published articles exploring the importance of biodiversity risks and opportunities for financial institutions (Biodiversity risks and opportunities for financial institutions explained), and introduced a quantitative approach to scoring biodiversity risks based on sector and location (Biodiversity risks scoring: a quantitative approach). Building on those insights, this blog addresses the challenge of quantifying the biodiversity impact of a financial institution. Specifically, it explains biodiversity footprinting: a method enabling financial institutions to measure, track, and ultimately mitigate their environmental impact on biodiversity.
What is biodiversity and why it matters
A commonly used definition of biodiversity is “the variability among living organisms from all sources including, inter alia, terrestrial, marine and other aquatic ecosystems and the ecological complexes of which they are part; this includes diversity within species, between species and of ecosystems” (Convention on Biological Diversity, 1992). Hence, it represents all living organisms on earth like animals, plants, fungi and microbes, and the complex interactions that form our ecosystems. Biodiversity is the backbone of the earth's life-support systems. It directly affects the air we breathe, the food we eat and the water we drink. Additionally, healthy ecosystems help mitigate climate change by capturing carbon, safeguarding water supplies and maintaining balanced soil nutrients. Furthermore, natural habitats like wetlands, mangroves and forests protect communities from extreme weather events.
Economically, biodiversity is vital too. For example, ENCORE defines ecosystem services as the benefits that nature provides to support economic activities (ENCORE, sd). These services are categorized into provisioning services, which supply resources like food, water, and raw materials; regulating and maintenance services, which include air and water purification, climate regulation, and pest control; and cultural services, offering recreational, educational, and spiritual benefits. Biodiversity is fundamental to the proper functioning of these services.
While many global efforts and investments focus on monitoring and reducing CO2 emissions, much less attention is given to tracking and preventing biodiversity loss. This gap shows a key weakness in our environmental management strategies.
Why it matters for financial institutions
The financial sector plays a critical role in shaping the global economy by directing investments into various ventures, industries, and innovations. Biodiversity loss poses tangible risks (e.g. operational, reputational and regulatory) that financial institutions must address. Ignoring these risks could lead to stranded assets, disrupted supply chains or negative stakeholder reactions (for more about biodiversity risk for financial institutions, see this previous blog. Moreover, integrating biodiversity considerations into decision-making can lead to more resilient investment strategies and unlock new, nature-positive opportunities.
By measuring and monitoring their biodiversity impacts, banks, asset managers, insurers and other financial entities can:
- Learn about and better understand the causes and complexities of biodiversity loss;
- Identify biodiversity hotspots in their portfolios;
- Engage with clients on sustainable practices to reduce their impact;
- Align with global frameworks and evolving regulatory standards.
As awareness of biodiversity risks and opportunities grows, understanding how to measure biodiversity impacts becomes important. Biodiversity footprinting is a helpful tool for this.
What is biodiversity footprinting?
Biodiversity footprinting is a method for quantifying the impact of products, investments, or entire portfolios on natural ecosystems. Similar to measuring a carbon footprint, a biodiversity footprint measures the degree to which an activity affects habitat quality, species abundance, and overall ecological health. This is done by tracking factors like land use, water consumption, greenhouse gas emissions, and pollution. The goal is to pinpoint economic activities with significant environmental impact, so that organizations can set informed targets and policies to promote biodiversity conservation.
Quantifying a biodiversity footprint is more challenging than measuring a carbon footprint, as it involves multiple local factors, diverse habitats and various impact types. The complexity and location-specific nature of biodiversity means that universal benchmarks or standardized datasets are still evolving. Today, multiple initiatives and approaches exist, each with its own methods and metrics for assessing biodiversity impacts.
Zanders’ biodiversity footprinting model
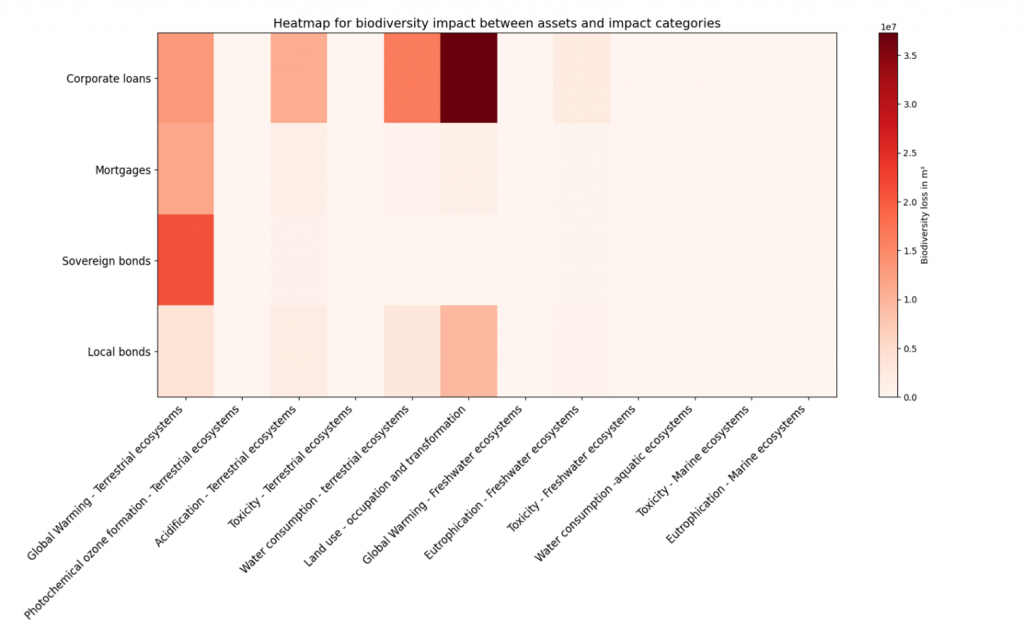
Zanders’ model for biodiversity footprinting provides financial institutions with a first scan and quantification of the impacts their financial activities have on natural ecosystems. The methodology is based on the Biodiversity Footprint for Financial Institutions (BFFI), an approach that enables calculation of biodiversity impacts across multiple asset classes.
Our model requires input data on the size of economic activities (in euros), the specific sector or asset type, and the location at a country-level granularity. It integrates this data with important environmental pressures derived from a multi-regional environmentally extended input-output database. Using life cycle assessment techniques, the biodiversity footprint is calculated by determining the Potentially Disappeared Fraction (PDF) of species. This is used to express the total biodiversity loss in square meters (m²) resulting from one year of economic activities.
By quantifying these impacts, financial institutions can identify specific biodiversity impact hotspots within their portfolios. This enables them to set informed, science-based targets aimed at effectively reducing their overall biodiversity footprint. The image below illustrates the results for a hypothetical portfolio, highlighting biodiversity impacts across various asset classes and impact categories.
If you are interested in learning more about how Zanders can help you quantify your biodiversity impact, please contact Steyn Verhoeven, Martijn Schouten or Marije Wiersma.
Bibliography
Brondízio, E. S., Settele, J., Diaz, S., & Ngo, H. T. (2019). Global assessment report on biodiversity and ecosystem services of the Intergovernmental Science-Policy Platform on Biodiversity and Ecosystem Services. Bonn, Germany: IPBES secretariat.
Convention on Biological Diversity. (1992). Article 2: Biodiversity definition. Retrieved from Convention on Biological Diversity: https://www.cbd.int/convention/articles?a=cbd-02
ENCORE. (n.d.). Ecosystem Services. Retrieved from ENCORE: https://www.encorenature.org/en/data-and-methodology/services
Wiersma, M., Blijlevens, S., & Manzanares, M. (2024, October). Biodiversity risks scoring: a quantitative approach. Retrieved from Zanders: https://zandersgroup.com/en/insights/blog/biodiversity-risks-scoring-a-quantitative-approach
Wiersma, M., Gerrits, J., & Fedenko, I. (2023, November). Biodiversity risks and opportunities for financial institutions explained. Retrieved from Zanders: https://zandersgroup.com/en/insights/blog/biodiversity-risks-and-opportunities-for-financial-institutions-explained
World Wildlife Fund. (2024). Living Planet Report 2024. Retrieved from https://www.worldwildlife.org/publications/2024-living-planet-report

While Swift and the banking community prepare for the end of the MT-MX co-existence in November, the cross-border payments landscape is continuing to evolve.
What challenges will still exist with the Swift-based correspondent banking model, and could new opportunities materialize through extending existing domestic instant payment schemes into a global cross-border proposition?
The evolution of the payments industry over the past 20 years has been significant, both in terms of the number of available settlement methods and how transactions can now be made. At a global industry level, there has been a greater focus on payments since G20 leaders endorsed the Roadmap for Enhancing Cross-border Payments1 in 2020. The G20 made this activity a priority – specifically making cross-border payments, including remittances, faster, cheaper, more transparent, and inclusive. The current SWIFT migration to ISO 20022 XML for cross-border payments is possibly the most significant disruption to traditional global cross-border payments since SWIFT first introduced electronic financial messaging back in 1977. This transformation will deliver on one of the key building blocks identified by the Committee on Payments and Market Infrastructures (CPMI) back in July 20202: Data and Market Practices. It is recognized that better-quality data will improve the overall efficiency, speed, and compliance of payments. But while this industry initiative will deliver material benefits, this change addresses only legacy file format limitations. It does not remove many long-standing difficulties with cross-border correspondent banking.
Friction within the correspondent banking model
The correspondent banking model is an essential part of cross-border payment flows. Its foundation is a series of bilateral agency agreements, whereby a bank maintains a physical bank account (and deposits) with another (correspondent) bank. This relationship enables the contracting bank to access an agreed range of financial services typically in different countries. The banks use the Latin terms nostro and vostro to describe the same bank account but from different points of view. Nostro refers to "our" account held in a foreign bank, while vostro refers to the foreign bank’s point of view, whereby they hold "your" account in their bank.
The established correspondent banking approach was developed hundreds of years ago. It includes a number of material challenges that will still exist post the SWIFT MT-MX migration in November 2025:
- High costs: The cost of a cross-border wire payment extends beyond the charges of the originating bank. Under the correspondent banking model, each bank involved in the cross-border payment processing chain can apply a fee. This also extends to the beneficiary bank that can also apply a fee. These additional correspondent banking and beneficiary banking fees can be greater than the initial charge made by the originating bank.
- Slow processing: While SWIFT GPI is a significant enhancement that provides tracking of the cross-border payment status, this merely highlights that in some cases, a cross-border payment can still take 24 hours to reach the beneficiary bank account. This means one correspondent bank in the cross-border payment chain has effectively taken one day’s float in addition to its processing fees – this is significant given interest rates remain relatively high.
- Principal amount: While the SWIFT message design allows for the originating customer to specify if the beneficiary should receive the full principal (payment) amount through using the "our/debt" charge bearer code, a significant number of corporates still encounter challenges where at least one bank in the chain ignores this charge bearer code and deducts its fees from the principal payment amount. This means the beneficiary receives less money, creating reconciliation challenges and customer dissatisfaction.
- Settlement risk: Banks worldwide need to hold significant balances in reserve to cover the risk of correspondent bank default because many cross-border payments take a day or more – sometimes weeks – to complete. Continuous Linked Settlement (CLS), which was launched in 2002 to mitigate this risk, covers only a small number of the world’s currencies, leaving large sections of the global economy badly exposed to correspondent banking’s overnight risk problem.
These are not the only concerns around the legacy correspondent banking model. In 2016, the Governors of the Bank for International Settlements (BIS) Economic Consultative Committee (ECC) mandated the Committee on Payments and Market Infrastructures (CPMI) to produce a report3 on any threats to its safe and efficient functioning. Analysis using SWIFT data highlighted a trend towards concentration in correspondent banking activities. The report identified that some banks providing these services were reducing the number of relationships they maintain and were establishing fewer new ones – highlighting a risk that some banks might be cut off from the international payment networks. This situation implies a threat that cross-border payment networks might fragment and that the range of available options for these transactions could narrow. The CPMI recommendations tried to address some of the costs and concerns connected with correspondent banking activities. However, it acknowledged that the issues surrounding the withdrawal from correspondent banking are complex.
The rise of instant payments
Instant (real-time) payments accounted for 266.2 billion transactions globally in 2023. This is a year-on-year growth of 42.2%, highlighting that just under one-fifth of all electronic payments globally were real-time, based on a report from ACI Worldwide4. With instant domestic payments now available in more than 70 countries, the report also estimates that at least 25% of domestic payments will be instant by 2028. And with domestic instant payments reaching their destinations in seconds at a near-zero cost to the sender, instant (real-time) payments are faster, cheaper, and generally more accessible. Through a corporate lens, they help to reduce costs when compared with traditional SWIFT cross-border payments. Importantly, they also improve liquidity because funds are received on a real-time/near real-time basis, which has an immediate positive impact on cash flow. Instant payment transaction limits continue to increase. The US FedNow service allows an optional transaction limit of up to $500,000; UK Faster Payments is now at £1 million for business transactions; and the 2025 SCT (SEPA) Instant rulebook removes the maximum transaction limit at a scheme level. All of these factors will help drive greater industry adoption.
Project Nexus: removing friction
Project Nexus is a BIS Innovation Hub (BISIH) project. It explores how to leverage the successful foundation of domestic instant payments as a means of addressing the limitations of correspondent banking and improving the speed, cost, transparency, and accessibility of cross-border payments. The concept is a simple one: by connecting domestic instant payment systems (IPS) to each other, a multinational IPS service can be created that enables cross-border payments from sender to recipient within 60 seconds (in most cases).
Is this just a pipe dream? Absolutely not. This project proves the vision of the G20 Roadmap for Enhancing Cross-border Payments can be achieved for speed, cost, transparency, and accessibility. The journey started in April 2021 (pre-Nexus) with a successful bilateral test connecting Singapore and Thailand using tokenization (sending payments across the border with just the recipient’s phone number). In 2022, Project Nexus completed a proof of concept (PoC) with the European Central Bank (ECB), Singapore, and Malaysia.
Project Nexus removes the challenges around a bilateral connection by introducing a standardized utility that would enable each domestic IPS to connect once only to this utility, based on ISO 20022 global financial standards. This vision moved a step closer to reality with the completion of a third phase in mid-2024, in which the BISIH Singapore center worked with the central banks and IPS operators of Indonesia, Malaysia, the Philippines, Singapore, and Thailand to evaluate the utility-based approach. It focused on the following core areas:
- Governance, scheme, and oversight arrangements
- Development of a viable business and revenue model for Project Nexus
- Finalization of Project Nexus’ technology architecture and operational model
The focus is now on preparing for production with India, Malaysia, the Philippines, Singapore, and Thailand. Both the ECB and Indonesia will be special observers to this initial production phase.
In addition to Project Nexus, private sector fintechs are also developing commercial services to interlink domestic payment systems to create a worldwide instant payment capability. One of the leading players in this field is UK-based RTGS.global. It uses a cloud-hosted ledger to enable banks and payment providers to settle in real time, at any time of day, with counterparties around the globe.
Instant settlement is the key to turning cross-border payments from the legacy message-based correspondent banking model into modern real-time value exchange.
As slick as domestic payments
While it is unrealistic to expect Project Nexus to completely replace the current correspondent banking model for cross border payments, alongside startups such as RTGS.global, it will introduce further choice around the payment process. And by using modern payments technology, adopting ISO 20022 payment messaging standards, and leveraging the existing domestic IPS network, there is a real opportunity to make the cross border payments experience almost as smooth and efficient as domestic payments. For corporates that initiate cross border payments within these initial payment corridors, this is now an area worth exploring with their banking partners to understand both the roadmap and the true potential of this initiative. For the rest of the corporate community, this initiative, along with other cross border payment solutions, should now be on the radar.
For more information on cross-border payments and Swift related challenges, please contact Eliane Eysackers or Mark Sutton.
*This blog was first published here: End of Days | Treasury Management International

Introducing the Debt Capacity module: a powerful new addition to Zanders’ Transfer Pricing Suite, enabling fast, accurate, and scalable debt capacity testing for multinational entities.
In the ongoing efforts to enhance tax transparency for multinational corporations, tax authorities have progressively increased scrutiny on intercompany financial transactions. While the interest rates on intra-group loans have long been a focus of regulatory attention, recent administrative guidelines have shifted the spotlight toward the level of indebtedness of borrowers. For instance, the German Federal Ministry of Finance recently issued new guidelines mandating a debt capacity test for intercompany financial transactions1.
Although many multinational entities already have compliant solutions in place to determine arm’s length interest rates, the same cannot be said for debt capacity tests. Historically, verifying the level of indebtedness for subsidiaries has relied on complex, manual analyses conducted in Excel spreadsheets. These methods, while tailored, often lack efficiency and scalability.
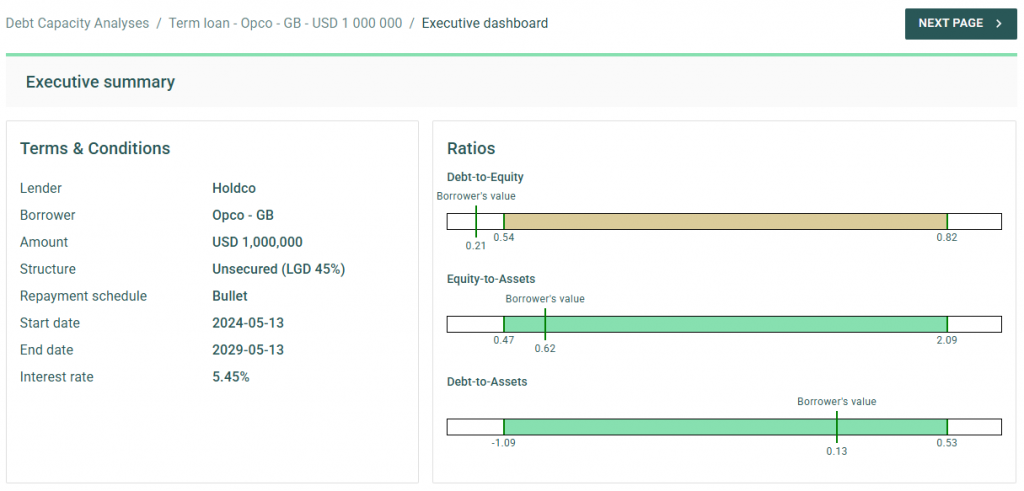
Today, we are thrilled to announce the launch of a new addition to our Transfer Pricing Suite: the Debt Capacity module. This innovative tool allows clients to build on their pricing analyses by quickly and accurately testing the debt capacity of borrower entities. Staying true to the essence of our Transfer Pricing Suite, the module is user-friendly yet delivers best-in-class support for tax compliance.
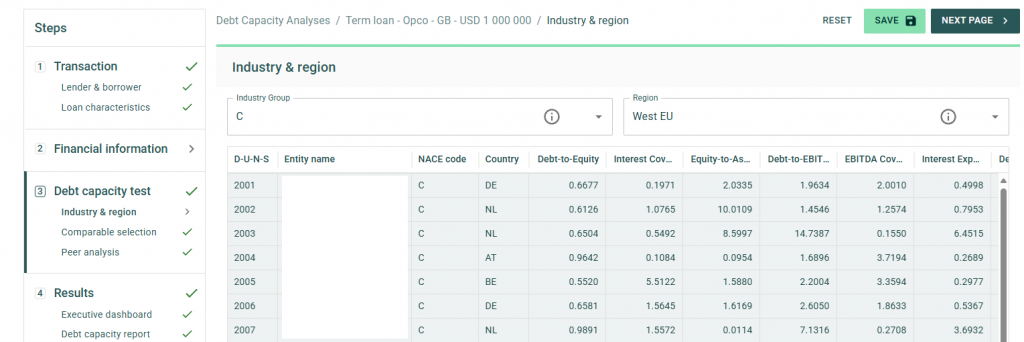
To streamline your in-house workflow, the standard package includes access to comparable data for a wide variety of borrowers. Within seconds, the application can automatically generate 40 comparable peers based on the borrower’s size, country, and industry through our connection with Dun & Bradstreet. Additionally, users can adjust and amend the list of comparable peers to ensure robust and tailored debt capacity tests for any scenario.
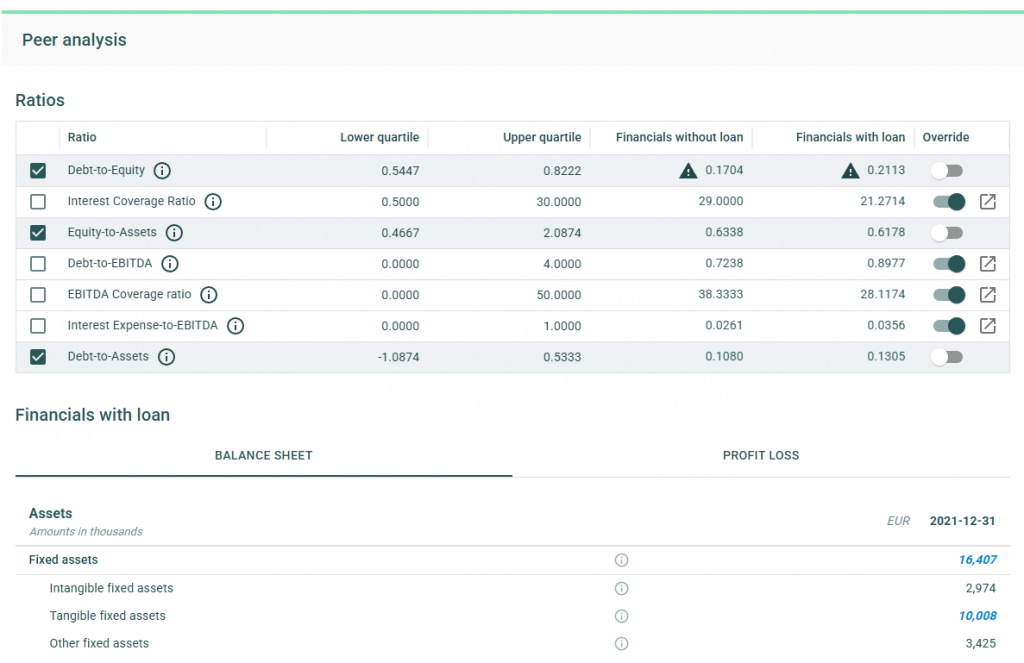
The debt capacity test leverages a flexible framework of financial ratios, which can be customized on a case-by-case basis. Our financial models dynamically adjust a borrower’s ratios to account for the impact of new loans on the balance sheet. With financial data for comparable entities readily available in the application, users receive feedback on debt capacity tests in under a minute.
Upon completing the analysis, the application offers the option to generate a comprehensive report, available in Word or PDF formats. This detailed report outlines the methodology and underlying data used in the analysis, serving as an excellent complement to existing pricing reports and providing critical compliance support when it matters most.
After releasing the initial version of the Debt Capacity module to clients, we will work on continuing to improve our applications. For example, by further supporting the debt capacity test through the inclusion of a dedicated cash flow forecast and an increase in comparable companies. If you’re interested in learning more, we invite you to contact our Transfer Pricing team to schedule a demo or trial the new module within your Zanders Inside environment.
Zanders Transfer Pricing Solution
As tax authorities intensify their scrutiny, it is essential for companies to carefully adhere to the recommendations outlined above. Does this mean additional time and resources are required? Not necessarily.
Technology provides an opportunity to minimize compliance risks while freeing up valuable time and resources. The Zanders Transfer Pricing Suite is an innovative, cloud-based solution designed to automate the transfer pricing compliance of financial transactions.
With over seven years of experience and trusted by more than 80 multinational corporations, our platform is the market-leading solution for intra-group loans, guarantees, and cash pool transactions.
Our clients trust us because we provide:
- Transparent and high-quality embedded intercompany rating models.
- A pricing model based on an automated search for comparable transactions.
- Automatically generated, 40-page OECD-compliant Transfer Pricing reports.
- Debt capacity analyses to support the quantum of debt.
- Legal documentation aligned with the Transfer Pricing analysis.
- Benchmark rates, sovereign spreads, and bond data included in the subscription.
- Expert support from our Transfer Pricing specialists.
- Quick and easy onboarding—completed within a day!
Learn more, and discover the key compliance challenges for intra-group loan transfer pricing in 2025.
Citations
- See our blog on Transfer Pricing best practices 2025 for more information. ↩︎

We explore the main challenges of computing Margin Value Adjustment (MVA) and share our insights on how GPU computing can be harnessed to provide solutions to these challenges.
With recent volatility in financial markets, firms need increasingly faster pre-trade and risk calculations to react swiftly to changing markets. Traditional computing methods for these calculations, however, are becoming prohibitively expensive and slow to meet the growing demand. GPU computing has recently garnered significant interest, with advances in the fields of advanced machine learning techniques and generative AI technologies, such as ChatGPT. Financial institutions are now looking at gaining an edge by using GPU computing to accelerate their high-dimensional and time-critical computing challenges.
The MVA Computing Challenge
The timely computation of MVA is essential for pre-trade and post-trade modeling of bilateral and cleared trading. Providing an accurate measure of future margin requirements over the lifetime of a trade requires the frequent revaluation of derivatives with a large volume of intensive nested Monte Carlo simulations. These simulations need to span a high-dimensional space of trades, time steps, risk factors and nested scenarios, making the calculation of MVA complex and computationally demanding. This is further complicated by the need for an increasing frequency of intra-day risk calculations, due to recent market volatility, which is pushing the limits of what can be achieved with CPU-based computing.
An Introduction to GPU Computing
GPU computing utilizes graphics processing units, which are specifically designed to handle large volumes of parallel calculations. This capability makes them ideal for solving programming challenges that benefit from high levels of parallelization and data throughput. Consequently, GPUs can offer substantial benefits over traditional CPU-based computing, thanks to their architectural differences, as outlined in the table below.
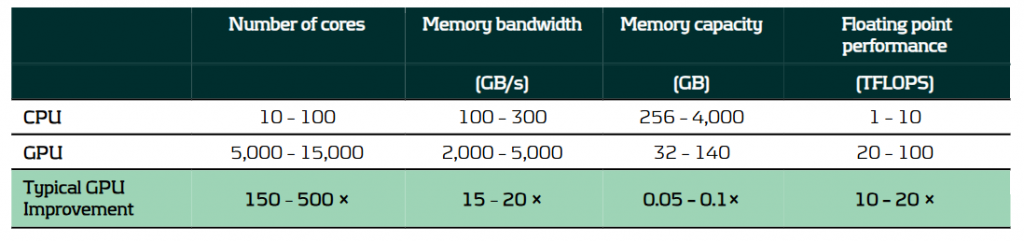
A comparison of the typical capabilities of enterprise-level hardware for CPUs and GPUs.
It is because of these architectural differences that CPUs and GPUs excel in different areas:
- CPUs feature fewer but more powerful cores, optimized for general-purpose computing with complex, branching instructions. They excel in performing serial calculations with high single-core performance.
- GPUs consist of a large number of less powerful cores and with higher memory bandwidth. This makes them ideal for handling large volumes of parallel calculations with high throughput.
Solving the MVA Computational Challenge with GPU Computing
The requirement to calculate large volumes of granular simulations makes GPU computing especially well-suited to solving the MVA computational challenge. The use of GPU computing can lead to significant improvements in performance for not only MVA but a range of problems in finance, where it is not uncommon to see improvements in calculation speed of 10 – 100x. This performance increase can be harnessed in several ways:
- Speed: The high throughput of GPUs provides results more quickly, providing faster risk calculations and insights for decision-making, which is particularly important for pre-trade calculations.
- Throughput: GPUs can more quickly and efficiently process large calculation volumes, providing institutions with more peak computing bandwidth, reducing workloads on CPU-grids that can be used for other tasks.
- Accuracy: With greater parallel processing capabilities, the accuracy of models can be improved by using more sophisticated algorithms, greater granularity and a larger number of simulations. As illustrated below, the difference in the number of Monte Carlo simulations that can be achieved by GPUs in the same time as CPUs can be significant.
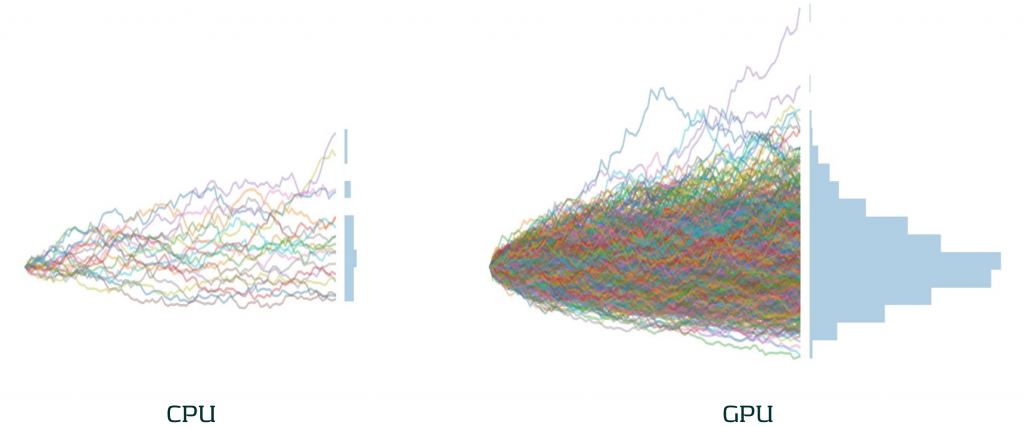
The difference in the number of Monte Carlo paths than can be simulated in the same time between an equivalent enterprise-level CPU and GPU.
Case Study: Our approach to accelerating MVA with GPUs
To illustrate the impact of GPU computing in a real situation, we present a case study of our work accelerating MVA calculations for a major bank.
Challenge: A large investment bank was seeking to improve the performance of their pre-trade MVA for more timely calculations. This was challenging as they needed to compute their MVA exposures over long time horizons, with a large number of paths. Even with a sensitivity-based approach, this process took close to 10 minutes using a single-threaded CPU calculation.
Solution: Zanders analyzed the solution and identified several bottlenecks. We developed and optimized a GPU-accelerated solution to ensure efficient GPU utilization, parallelizing the calculations across scenarios and risk factors.
Performance: Our GPU implementation improved MVA calculation speed by 51x. Improving calculation time from just under 10 minutes to 10 seconds. This significant increase in speed enabled more timely and frequent assessments and decisions on MVA.
Our Recommendation: A strategic approach to GPU computing implementations
There are significant benefits to be achieved with the use GPU computing. However, there are some considerations to ensure an effective use of resources:
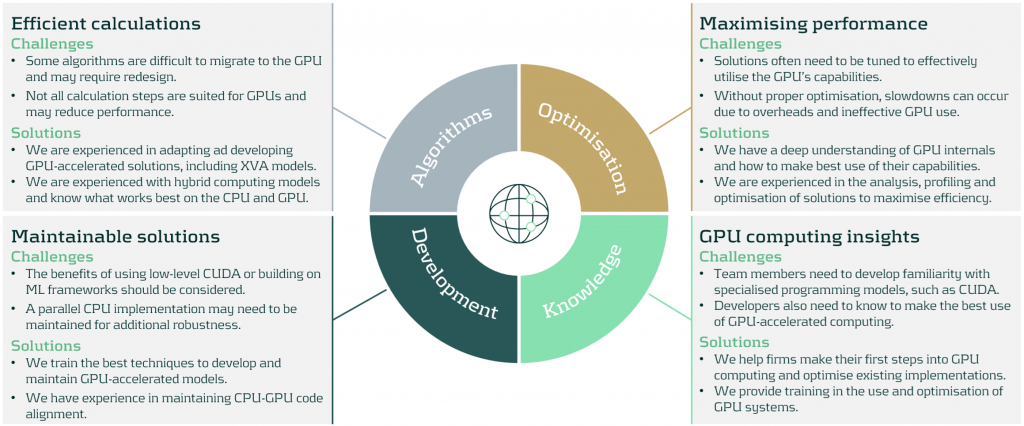
We work with firms to develop bespoke solutions to meet their high-performance computing needs. Zanders can help in all aspects of GPU computing implementation, from initial design to the analysis, development and optimization of your GPU computing implementation.
Conclusion
GPU computing offers significant improvements in the speed and efficiency of financial calculations, typically boosting calculation speeds by factors of 10-100x. This enables financial institutions to manage their risk more effectively, including the computationally demanding calculations of MVA. By replacing CPU-based calculations with GPU computing, banks can dramatically improve their capacity to process greater volumes of calculations with higher frequency. As financial markets continue to evolve, GPU computing will play an increasingly vital role in their calculation infrastructure.
To find out more on how GPU computing can enhance your institution's risk management processes, please contact Steven van Haren (Director) or Mark Baber (Senior Manager).

Following the publication of its focus areas for IRRBB in 2024 and 2025, the European Banking Association (EBA) has now published an update regarding the implementation and explains the next steps.
The implementation update covers observations, recommendations and supervisory tools to enhance the assessment of IRRBB risks for institutions and supervisors.1 Main topics include non-maturing deposit (NMD) behavioral assumptions, complementary dimensions to the SOT NII, the modeling of commercial margins for NMDs in the SOT NII, as well as hedging strategies.
Some key highlights and takeaways from the results of sample institutions as per Q4 2023:
- Large dispersion across behavioral assumptions on NMDs is observed. The significant volume of NMDs as part of EU banks’ balance sheets, differences in behavior between customer / product groups and developments in deposit volume distributions, however, underline the need for more solid and aligned modeling. The EBA hence suggests NMD modeling enhancements and recommends (1) banks to consider various risk factors related to the customer, institution and market profile, as well as (2) a supervisory toolkit to monitor parameters / risk factors. Segmentation and peer benchmarking, (reverse) stress testing as well as (combining) expert judgment and historical data are paramount in this regard. The recommendations spark banks to reevaluate forward looking approaches, as shifting deposit dynamics render calibration solely based on historical data insufficient. Establishing a thorough expert judgment governance including backtesting is vital in this respect. Moreover, assessing and substantiating how a bank’s modeling relates to the market is more important than ever.
- Next to the NII SOT that serves as a metric to flag outlier institutions from an NII perspective, the EBA proposes additional dimensions to be considered by supervisors. These dimensions, which aim to reflect internal NII metrics, must complement the assessment and enhance the understanding of IRRBB exposures and management. The proposed dimensions include (1) market value changes of fair value instruments, (2) interest rate sensitive fees/commissions & overhead costs, and (3) interest rate related embedded losses and gains. It is important to note that it is not intended to introduce new limits or thresholds associated with these dimensions.
- Given concerns and dispersion regarding the modeling of commercial margins for NMDs in the NII SOT (38% of sample institutions assumed constant commercial margins versus the remainder not applying constant margins), the EBA now provided additional guidance on the expected approach. They recommend institutions to align the assumptions with those in their internal systems, or apply a constant spread over the risk-free rate when not available. Key considerations include the current spread environment, the context of zero or negative interest rates and lags in pass-through. The EBA’s clarification indicates that banks are allowed to apply a non-constant spread. This serves as an opportunity for banks still applying constant ones, as using non-constant spreads enhances the ability to quantify NII risk under an altering interest rate environment.
- Hedging practices vary significantly across institutions, although hedging instruments (i.e. interest rate swaps) to manage open IRRBB positions are aligned. Hedging strategies have significantly contributed to meeting regulatory requirements, with all institutions meeting the SOT EVE as per Q4 2023, compared to 42% that would not have complied if hedges were disregarded. For the SOT NII, however, 13% of the sample institutions would have been considered outliers if this regulatory measure had been applied in Q4 2023 (versus 21% when disregarding hedges). This result shows that it is key for banks to find a balance between value and earnings stability, and apply hedging strategies accordingly. As compliance with SOTs must be ensured under all circumstances, stressed client behavior and market dynamics must be accounted for.
In the upcoming years, the EBA will continue monitoring the impact of the IRRBB regulatory package, focusing on NMD modeling, hedging strategies, and potential scope extensions to commercial margin modeling. It will also assess Pillar 3 disclosure practices and track key regulatory elements such as the 5-year cap on NMD repricing maturity and Credit Spread Risk in the Banking Book (CSRBB)-related aspects. Additionally, the EBA will contribute to the International Accounting Standards Board’s (IASB's) Dynamic Risk Management (DRM) project and evaluate the impact of recalibrated shock scenarios from the Basel Committee.
The EBA publication triggers banks to take action on the four topics outlined above, as well as on hedge accounting (DRM) in the near future. Zanders has extensive relevant experience, and supported on:
- Numerous NMD topics, including modeling, validation and benchmarking. Furthermore, we published a series of whitepapers regarding NMD modeling concepts and approaches, deposit rate dynamics, forward looking perspectives and migration dynamics in deposits that is particularly relevant following this EBA publication.
- Drafting an IRRBB strategy, advising on coupon stripping and developing a hedging strategy, thereby carefully balancing value and NII risks (SOT EVE / NII).
- Validating a hedge accounting framework, developing a hedge account model and hedge accounting outsourcing. Zanders moreover held a survey on DRM as well as published an extensive series of articles on the DRM project of the IASB and its implications for banks.
Contact Jaap Karelse, Erik Vijlbrief (Netherlands, Belgium and Nordic countries) or Martijn Wycisk (DACH region) for more information.
Citations


Discover the key compliance challenges for intra-group loan transfer pricing in 2025.
Over the past year, the interest rates on intercompany financial transactions have come under closer examination by tax authorities. This intensified scrutiny stems from a mix of factors, including evolving regulations, more sophisticated audit procedures, the need from governments to boost revenue, and of course, high-interest-rate environment.
As a result, these transactions are now being assessed with greater depth and rigor than ever before. Historically, tax authorities focused on interest rate benchmarks as the primary point of analysis. However, their attention has now widened significantly to cover a range of interrelated considerations.
Below is a brief overview of the key trends and areas attracting the most scrutiny in today’s landscape, highlighting what multinationals should pay attention to in 2025:
Arm’s length T&Cs
In the past years, tax authorities are closely examining the terms and conditions of intra-group debt, scrutinizing the pricing of loans and the effects of increased leverage.
Accordingly, it is critical to ensure that the loan’s terms and conditions reflect the arm’s length standards and align with the actual economic substance of the transaction. This includes evaluating whether a hypothetical independent borrower, under similar conditions, could and would obtain a comparable loan.
In addition to establishing an arm’s length interest rate and the appropriate amount of debt (further explained below), it is also necessary to assess whether the other terms and conditions are at arm’s length. This involves considering the main features of the loan—such as currency, maturity, repayment schedule, and callability—and evaluating their impact on the risk profile of both the borrower and the lender, as well as on the arm’s length interest rate.
In this regard, tax authorities may challenge intra-group loans that do not include a maturity date, have an excessively long maturity (e.g., over 25 years), or lack a repayment schedule, since third-party loans would generally include these provisions.. They might also challenge situations where the actual conduct of the parties does not reflect the terms and conditions outlined in the loan agreement. For example, if the parties apply a different maturity or repayment schedule than the one initially agreed upon—without amending the legal documentation, which often happens in a dynamic intra-group financing environment—this could prompt further scrutiny from tax authorities.
As a result, it is important for multinational enterprises to carefully consider these terms and conditions before issuing a loan, as they will have a direct impact on the interest rate applied in the transaction. Drafting a comprehensive loan agreement that clearly outlines these terms, aligns with the conditions applied in practice, and is supported by a robust Transfer Pricing analysis is recommended to mitigate the risk of challenges by tax authorities.
Debt Capacity Analysis
One of the most important terms and conditions that must meet arm’s length standards is the so-called quantum of debt (i.e. nominal amount of the loan extended). Tax authorities are increasingly scrutinizing whether the amount of intra-group debt is economically justified and supported by a clear business purpose. They also evaluate whether the debt aligns with arm’s length principles and serves a legitimate economic function consistent with the borrower’s overall business strategy.
A debt capacity analysis is often conducted to determine whether the borrower has the financial capacity to repay the loan and whether an unrelated party would provide a similar amount of financing under comparable conditions.
While many jurisdictions have long required this type of analysis in practice, Germany has taken a step further by formalizing this requirement under its 2024 Growth Opportunities Act. This was further clarified on December 12, 2024, when the German Federal Ministry of Finance issued administrative principles providing specific guidance on financing relationships under the new Transfer Pricing provisions. According to these principles, the debt capacity test hinges on two key criteria:
(i) a credible expectation that the debtor can meet its obligations (e.g., interest payments and principal repayments),
and (ii) a commitment to provide financing for a defined period.
As a result, multinational enterprises are expected to robustly justify the level of debt assumed by their subsidiaries, particularly for entities operating in Germany.
Credit Rating Analyses
Tax authorities are increasing their focus on credit rating analyses. While simplified approaches, such as applying a uniform credit rating across all subsidiaries, were once more widely accepted, current practices favour a more detailed entity by entity evaluation. This involves first assigning a stand-alone credit rating to the individual borrower and then adjusting it to account for any implicit or explicit group support.
In this context, Swiss tax authorities published last year a Q&A addressing various Transfer Pricing topics. In the section on financial transactions, they emphasized a clear preference for the bottom-up approach described above. This aligns closely with the OECD Transfer Pricing Guidelines and is consistent with the prevailing practices in most jurisdictions.
In contrast, the administrative principles issued in Germany appear to take a different direction. According to the new rules, the arm’s-length nature of the interest rate for cross-border intercompany financing arrangements must generally be determined based on the group’s credit rating and external financing conditions. However, taxpayers are allowed to demonstrate that an alternative rating better aligns with the arm’s-length principle.
This new approach diverges not only from the OECD guidelines but also from previous case law established by the German Federal Tax Court. As a result, several questions arise regarding how these rules will be applied in practice by German tax authorities. For instance, it remains unclear whether this approach will constitute a strict obligation or whether flexibility will be granted. Additionally, concerns exist about the burden of proof placed on taxpayers when opting for the bottom-up approach recommended by the OECD Transfer Pricing Guidelines.
Cash Pool Synergy Distribution
Tax authorities are increasingly aligning with Chapter X of the OECD Guidelines when evaluating cash pooling arrangements, with particular attention to the distribution of synergies among pool participants.
According to the OECD Transfer Pricing Guidelines (Section C.2.3.2, paragraph 10.143), synergy benefits should generally be allocated to pool members by determining arm’s length interest rates that reflect each participant’s contributions and positions within the pool (e.g., debit or credit).
Historically, the focus of tax authorities was primarily on the pricing methodologies— ensuring that both deposit and withdrawal margins were set at arm’s length. However, there is now a growing emphasis on how synergy benefits are distributed among participants. This is especially significant in jurisdictions where participants make substantial contributions to the pool balance. According to the OECD guidelines, these participants should benefit from the synergies generated by the pool through more favourable financing terms.
To address these requirements and reduce the risk of disputes over cash pool structures, a three-step approach is recommended:
1- Price the credit and debit positions of the participants.
2- Calculate the synergy benefits generated within the structure.
3- Allocate these benefits between the Cash Pool Leader and participants by adjusting the price applied to the participants.
By following this approach, multinationals can ensure compliance with OECD guidelines and mitigate the likelihood of challenges from tax authorities.
Zanders Transfer Pricing Solution
As tax authorities intensify their scrutiny, it is essential for companies to carefully adhere to the recommendations outlined above.
Does this mean additional time and resources are required? Not necessarily.
Technology provides an opportunity to minimize compliance risks while freeing up valuable time and resources. The Zanders Transfer Pricing Suite is an innovative, cloud-based solution designed to automate the transfer pricing compliance of financial transactions.
With over seven years of experience and trusted by more than 80 multinational corporations, our platform is the market-leading solution for intra-group loans, guarantees, and cash pool transactions.
Our clients trust us because we provide:
- Transparent and high-quality embedded intercompany rating models.
- A pricing model based on an automated search for comparable transactions.
- Automatically generated, 40-page OECD-compliant Transfer Pricing reports.
- Debt capacity analyses to support the quantum of debt.
- Legal documentation aligned with the Transfer Pricing analysis.
- Benchmark rates, sovereign spreads, and bond data included in the subscription.
- Expert support from our Transfer Pricing specialists.
- Quick and easy onboarding—completed within a day!


