
What will the next year bring for corporate treasury?
Now that we have passed and are still in an uncertain period, it is time to discover opportunities to reposition and prepare for new challenges and developments. How should you, as a treasurer, prepare for another unpredictable year? What can your company, and the treasury organization specifically, do to add value by recognizing the trends? How can Treasury contribute to dealing with current challenges in global supply chains?
While much about what 2022 will hold is uncertain, there are a few trends that will definitely play an important role. In this article we explore three main topics to navigate through the new environment and which are crucial to guide your treasury plan for the coming year.
Foresee the accelerating winds of change within the payments landscape
Innovation within the payments industry is closely linked to the continued digitization of commercial and consumer transactions. There are three topics worth mentioning when discussing the main points of attention for corporate treasury within the global payment landscape, being: (1) integration of e-commerce, (2) rise of alternative payment instruments, and (3) further payment standardization.
Integration of e-commerce into corporate treasury is an important topic for many treasurers. Consumers are driving the significant rise in the usage of alternative payments methods, like digital wallets (e-wallets), mobile payments, and ‘buy now, pay later’ solutions. Chinese consumers are leading the way with digital wallets which now account for over 72% of e-commerce purchases . Additionally, 56 countries are now providing real-time payment rails and the rising use of APIs promises to deliver a frictionless experience for more consumer payments. As a result, one of the important actions for Treasury in 2022, is to ensure that Treasury is linked into the different e-commerce platforms in the group in a similar fashion to how Treasury is responsible for managing traditional payments and bank relationships. Treasury should be the guardian of a safe payments infrastructure (including e-commerce payments) performed by reliable counterparties that are compliant with international regulation.
In terms of the rise of alternative instruments, we see the introduction of new digital coins, aimed at reducing volatility compared to the ‘traditional’ cryptos. This includes governments looking at the possibility of launching their own central bank digital currencies (CBDCs) which leverages the underlying distributed ledger technology as well as the introduction of so-called stablecoins, which are pegged to the value of an underlying asset. While the Bahamas was the world’s first CBDC with the launch of the Sand Dollar in October 2020, China is currently taking the lead with around 70 million digital Yuan transactions reported since the start of its pilot, which initially covered 4 cities. According to Atlantic Council, there are now 81 countries considering CBDCs, including the Federal Reserve, the European Central bank, the Bank of Japan and the Bank of England. While the future remains uncertain, these developments could lead to more mainstream use cases for digital currencies. This would have a potential impact on the payment formats we use, timing of payments and the role of traditional (network) banks. While use cases are limited at this moment, treasurers should be aware of the potential material impact on the payments landscape.
When it comes to payments standardization, API adoption is starting to accelerate, which will have a profound impact on both corporate treasury and financial shared service centers through the acceleration of information and processes. However, the lack of standardization within the industry appears to be causing the primary drag on adoption. This will become a foundational technology for real-time treasury, as real time balance and transactional information will provide immediate visibility and enable faster, more informed decisions to be made.
The final payments innovations on the horizon are a combination of global messaging and infrastructure projects. First, there is the planned SWIFT adoption of a selection of the ISO20022 XML messages included in the 2019 annual standards release. While this will initially be adopted within the banking community as part of the publicized MT-MX migration, the expectation is that banks will look for corporates to migrate at some point to take advantage of the more structured data opportunities and, if the CGI-MP is successful, greater alignment around the implementation within the banking sector. Moving onto the country level infrastructure, the UK is progressing its RTGS renewal program which will be underpinned by the adoption of ISO 20022 XML messaging. In addition, Hong Kong and Singapore are also building new RTGS payment rails underpinned by ISO 20022. Within the Nordics, there is P27, which aims to establish the first integrated region for domestic and cross-border payments in multiple currencies.
Stay ahead of new global tax regimes
The BEPS initiative impacted Treasury structures and the pricing of financial transactions in recent years. For example, thin capitalization rules, limitations to interest deductions and transfer pricing guidance have initiated multinationals to rethink their intercompany finance practices.
More specifically, the final OECD transfer pricing guidelines for financial transactions had a major impact on the internal corporate finance function of corporate treasuries. Numerous corporates revisited their pricing framework for intercompany loans, financial guarantees, cash pools and in-house banks in order to prevent issues during tax audits and possible transfer pricing adjustments.
We observe that more scrutiny is placed on the ‘at arm’s length’ pricing of treasury transactions and expects this to continue in 2022. It is thus advisable for treasurers to ensure that their intercompany lending framework is consistent, transparent and compliant with the latest transfer pricing guidelines. Especially since the simplified practice of using one group credit spread for all in-house bank participants is not compliant with the OECD guidelines. Therefore, as the burden of compliance increases, corporates are being pushed to look for solutions which can support them in automating this onerous process whilst still be fully compliant.
Lastly, treasurers should be aware of the latest development in international taxation: the global minimum tax. The G20 and all OECD member countries agreed on 8 October 2021 that multinationals will have to pay a minimum global tax of 15%. As the scope and the details of the tax reform are not clear yet, treasurers are advised to be aware of the topic and align with the internal tax team in order to identify the potential business impact. Treasury and tax can collaboratively serve as a strategic advisor towards their organization.
Seize the strategic opportunity in ESG
When talking about sustainability within treasury, many treasurers’ first port of call is to investigate a sustainable financing framework, either via green or social financing. ESG (environmental, social and governance) considerations play an important role in the external financing and the internal capital allocation process. In the long run, companies that have not implemented an ESG strategy may be deprived from fresh capital. This particular case is becoming more apparent within certain industries, like polluting industries or the so-called sin stocks (gambling, alcohol, tobacco, and weapons industry), where the transition from Greenium to a Brown money penalty may be more present than in other industries. However, there is more than just green or social financing. The topic around ESG is currently gaining momentum. ESG considerations are essential for long-term success; it is no longer just a necessity, but also a strategic opportunity.
So how should Treasury drive the ESG agenda? There are numerous innovative ways for Treasury to incorporate ESG into its strategy. For example, in addition to including ESG factors in the financing documentation or SCF programs, Treasury may incorporate ESG elements in the internal capital allocation process too. This can be done by adding ESG-related risk factors to the weighted average cost of capital (WACC) or internal hurdle investment rates for its capital allocation decisions. By having an ESG-adjusted WACC, one can evaluate projects by considering the ESG impact of an investment. By adjusting the WACC to, for example, the level of CO2 that is emitted by a project, the capital allocation process favors projects with low CO2 emissions. Another example of how Treasury can contribute to the company’s ESG goals is to encourage new and existing partners (e.g. banks or vendors) to take sustainable measures, by embedding ESG requirements into selections processes.
A corporate reaps the most benefits from its ESG policy when initiatives are mapped to the right KPIs to track the sustainable performance over time. KPI’s should be SMART, forward looking and focus on material themes. For Treasury, an example of such a metric is the percentage of suppliers rewarded with preferred supply chain finance (SCF) terms because of their ESG performance. To enlarge the impact of an ESG policy even more, and increase market transparency, KPIs should be benchmarked against industry standards.
Another way to increase market transparency is to maintain a corporate’s records by getting an external verification of its sustainable performance. This is enabled by the EU taxonomy model to avoid greenwashing.
Are you ready for your treasury journey?
2022 promises to be another exiting year with many opportunities to drive the Treasury function forward. The three main topics described in this article highlight the longer-term trend of Treasury moving closer to the business. The changing role of Treasury towards a comprehensive value-added center towards the business often requires a transformation in the Treasury organization. Zanders looks forward to discussing these and other trends with you and to support you on your treasury journey in 2022!
References
1) 2021 Global Payments Report by Worldpay from FIS
2) Common Global Implementation – Market Practice Group (formed October 2009)

Despite the tremendous push towards fully automating trade confirmations between banks and corporates in recent years, many transactions are still confirmed manually.
Manual confirmations are slow and error-prone, putting both sides of the trade at risk. In addition, many international regulations such as EMIR and Dodd-Frank have demanded an increase in automation.
Corporate treasurers often use SWIFT to standardize their confirmation messages. SWIFT is a cooperative that connects the financial community by providing highly secure financial messaging services that eliminate manual processing and makes inefficient paper confirmations redundant. More than 11,000 financial institutions, corporations, and other financial entities use SWIFT to exchange confirmations (SWIFT, 2019).
This article will explore several ways to confirm foreign exchange, money market, and currency option settlements through different solutions connected to SAP.
SWIFT Connectivity
Over the last several years, the SWIFT Network has experienced growing popularity with corporates of all sizes, stretching from large corporates with a high volume of transactions to small-to-medium corporates with a lower volume of transactions. As a result, corporates have several options when deciding on a connectivity solution:
- Direct in-house connectivity, where access to the SWIFT Alliance Gateway (SAG) is managed in-house by your IT (Information Technology) department. However, this solution is not recommended by SWIFT due to its high complexity and requirement for specialist SWIFT knowledge.

Figure 1: Direct Connectivity (SWIFT, 2019)
2. Alliance Lite2 is a packaged offering from SWIFT providing connectivity through a web browser or the embedded Lite2 for Business Applications (L2BA). Alliance Lite2 offers a simple, secure, cloud-based SWIFT connection. It connects to SWIFT through HTTPS and enables users to access the Alliance Lite 2 GUI. Since 2015, 61% of new corporate customers have opted for Alliance Lite2 (SWIFT, 2019).

Figure 2: Alliance Lite 2 (SWIFT, 2019)
3. SWIFT Service Bureaus (SSBs) provide a connection to the SWIFT network without the need to have an in-house IT department managing and maintaining the SWIFT connectivity. Furthermore, using an SSB can eliminate the need to undertake extra audit and compliance procedures. SSB providers vary in price but tend to be less expensive compared to direct in-house connectivity. It is still important to mention that initial investment is needed to set up the connectivity solution.

Figure 3: Swift Service Bureau (SWIFT, 2019)
4. Finastra Fusion Confirmation Matching Service (CMS) supports a hosted SWIFT connectivity through a Software as a Service (SaaS) application. It provides a confirmation matching solution for FX, Money Market, FX Options etc. This requires no upfront investment in infrastructure or implementation from the corporates availing of their services. It is directly hosted and managed and maintained by Finastra. Their File Transfer Service (FTS) is a secure process of moving messages between Misys CMS and clients ERP or TMS. FTS picks up and transfers files from the client to Misys CMS, converting the files to match trade data. After which, a matched message status is sent back to the client’s SAP TMS (Finastra, 2021).
Trading Platforms
Trading platforms such as 360T, Bloomberg and FXall offer automated back-office trade processing with SWIFT confirmation messages and trade matching.
The service allows corporate treasurers and banks to exchange deal confirmations directly on the trading platform. Messages are sent via the SWIFT networks directly to and from the banks, with the outgoing (incoming confirmation) and incoming messages (bankside confirmation) being automatically processed on the platform.
SAP Multi-Bank Connectivity
SAP Multi-Bank Connectivity (MBC) is SAP’s offering of a SWIFT connection embedded within Business Applications. This cloud-based solution offers a multi-bank digital channel between SAP and partner banks. In addition, SAP MBC is being provided as a SaaS solution by SAP.
A SWIFT Service provider is not needed for SAP customers to send confirmations messages through the SWIFT network, as SWIFT services are given by SAP through an embedded version of Alliance Lite 2. This streamlines trade confirmations for the TRM module, as message statuses are automatically updated directly in SAP. Moreover, the integration platform offers connectivity to partner banks through EBICS and Host-to-Host connection.
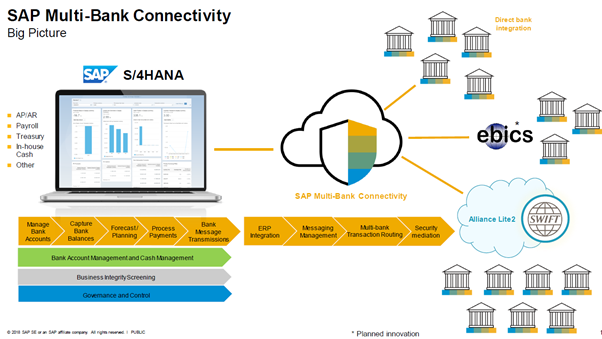
Figure 4: SAP MBC (SAP SE, 2018)
SAP Correspondence Monitor
This framework in SAP is an excellent tool to manage all correspondence objects. For example, back-office users can view incoming and outgoing messages and resend those messages previously failed to send. In addition, the monitor provides a historical overview of all the deals that have previously been confirmed.
Furthermore, it also allows you to view PDF messages that have been sent out, for example, to your internal counterparties. Through the t-code, technical users can customize messages when their requirements are not covered by standard functionality. For example, previously, SAP TRM did not offer MT305s as a standard message format. The user could then reconfigure standard functionality to fit different message types not provided in the standard TRM Module.
Below is an example of a corporates SAP TMS connected to the SWIFT network through a SWIFT Service Bureau.
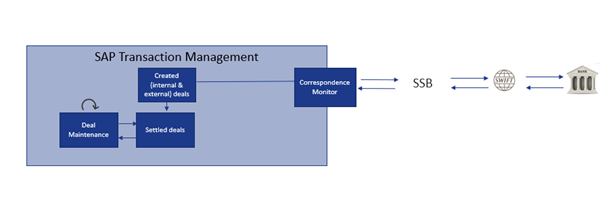
Figure 5: SAP Confirmation Connectivity
Conclusion
SWIFT Service Bureaus and Alliance Lite2 have been the most popular choice in sending out confirmations to and from the bank, with over 50% of all corporates accessing SWIFT through either connection. However, the offering of SAP Multi-Bank Connectivity is especially attractive to those corporates with a technology roadmap leading towards SAP as a key ERP provider. Nowadays, many corporates are transitioning towards their S/4 HANA transformations journey and are looking at their SWIFT connectivity options. Therefore, SAP Multi-Bank Connectivity is likely to compare favorably to SWIFT Service Bureaus in the coming years.
References
1) Finastra. (2021). From https://www.finastra.com/sites/default/files/file/2021-09/Confirmation-Matching-Service_FS_GL3800_FINAL.pdf
2) SAP SE. (2018). SAP Multi-Bank Connectivity.
3) SWIFT. (2019). S4C Workshop., (p. 95). Cape Town.

Founded in 1949, ASICS is a global sports brand on a mission to champion the benefits of movement on the body, and the mind.
It’s why the company is called ASICS which stands for ‘Anima Sana In Corpore Sano’, or a ‘sound mind in a sound body’. In 2020, ASICS had a turnover of 328,784 million yen. With subsidiaries all over the world, ASICS wanted to standardize and make its treasury operations more efficient.
Global Mindset
In 2017, to further optimize their treasury function, ASICS Europe decided to implement the treasury management functionality of SAP. Besides the SAP Treasury and Risk Management (TRM) module, ASICS Europe also implemented SAP Cash Management (CM), SAP In-House Cash (IHC) as well as the SAP Bank Communication Manager (BCM).
With this came the decision to set up a new company code that will separate the treasury and commercial activities within ASICS Europe BV (AEB) as the tax ruling for AEB only allows this company to provide services and do business in Europe. In addition, the new company code (ASICS Europe Treasury) ensured global reach and provided cost savings and standardization as ASICS foresees treasury activities in Europe, Japan, and the Americas.
The Realization
ASICS soon realized that the original plan to service their entities in other regions with the IHB created in Europe would not go as planned. Instead, the different regions would be supported with a local solution. Therefore, splitting into two company codes became irrelevant.
Further, after using SAP TRM, CM, IHC and BCM for a few years, ASICS discovered that creating a legal entity administered in two different company codes was time consuming while executing their day-to-day processes, which were as follows:
- Consolidation of accounting entries: The accounting of the core business processes (i.e., commercial/sales) took place in AEB. The accounting of the treasury and IHC process took place in AEB Treasury. To form a consolidated set of books, the accounting entries needed to be consolidated into AEB. This required manual work as ledger entries were replicated from AEB Treasury into AEB through a manual entry process.
- Internal deal mirroring: At ASICS Europe (and subsidiaries), any FX exposure is hedged externally by AEB Treasury. It is subsequently internally delivered to the correct company code (AEB) by entering an internal deal contract. The internal deal needs to be entered manually but is automatically mirrored in the other company code (AEB Treasury). However, this process of manually entering the deal for the internal side soon was labor-intensive, which needed to be avoided.
Solution
To solve the shortcomings mentioned above, Zanders proposed various alternatives. After conducting a few workshops with the Treasury Department, it was decided to discontinue all the current processes (TRM, IHC, GL accounting) in the company code representing ASICS Europe Treasury and re-implement it in company code representing AEB. Accordingly, the company code representing ASICS Europe Treasury was discontinued, and all GL accounting now takes place in company code representing AEB. Hence, a single company code for the single legal entity. This saved treasurers time on labor-intensive activities, such as replicating accounting entries into company code representing AEB. Further, as internal dealing only occurred between company codes representing AEB and AEB treasury, ASICS would no longer have to use the internal dealing functionality by merging the two company codes. Removal of these activities would make the processes more efficient.
Zanders and ASICS identified that the proposed solution would require high implementation effort. It would also lose the flexibility to quickly split the TRM and IHC processes into a new legal entity. However, as the pros outweighed the cons, ASICS decided to go ahead with the merging of the two company codes.
The project started with Zanders updating the decision forms, configuration, and master data conversion documents created in 2017 during the SAP TRM and IHC implementation project, which reflected the changes, risks, and implications of migration.
After which, Zanders performed the configuration and unit testing of the new functionality in a development system, ensuring that it would not disrupt the treasurers’ daily activities while the project was ongoing. In addition, Zanders performed comprehensive unit testing to ensure all scenarios are included and using “My Standards” to ensure the payment structure is intact and still valid. Once Zanders updated the configuration in the system, the previous configuration documents were also updated to reflect the new changes in the system.
Moreover, once the treasury team signed the documents, ASICS business users performed a user acceptance (UAT) test to familiarize themselves with the new way of working.
In addition, Zanders guided ASICS stakeholders to prepare an extensive cutover plan detailing step by step activities that would need to be performed by the team. Finally, the team executed rigorous cutover rehearsals, ensuring no significant issues were encountered during the go live.
Take a step back
ASICS took a great deal to investigate their current processes and see what was working and what was not. A decision might be logical now, but it doesn’t mean it will still be in the future. ASICS showed how you can still move forward even when taking a step back, improving their processes and making them more efficient. Eugène Tjemkes, Head of Global Business Transformation Finance at ASICS adds: “I am very pleased with Zanders. They took care of everything that needed to be picked up. We have chosen a partner who really knows what it is all about."

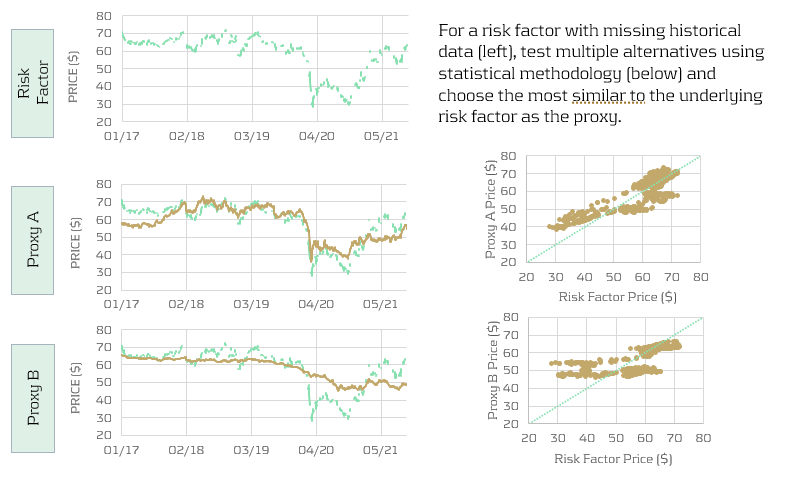
Learn how banks can reduce capital charges under FRTB by using proxies, external data, and customized risk factor bucketing to minimize non-modellable risk factors (NMRFs).
Non-modellable risk factors (NMRFs) have been shown to be one of the largest contributors to capital charges under FRTB. The use of proxies is one of the methods that banks can employ to increase the modellability of risk factors and reduce the number of NMRFs. Other potential methods for improving the modellability of risk factors is using external data sources and modifying risk factor bucketing approaches.
Proxies and FRTB
A proxy is utilised when there is an insufficient historical data for a risk factor. A lack of historical data increases the likelihood of the risk factor failing the Risk Factor Eligibility Test (RFET). Consequently, using proxies ensures that the number of NMRFs is reduced and capital charges are kept to a minimum. Although the use of proxies is allowed, regulation states that their usage must be limited, and they must have sufficiently similar characteristics to the risk factors which they represent.
Banks must be ready to provide evidence to regulators that their chosen proxies are conceptually and empirically sound. Despite the potential reduction in capital, developing proxy methodologies can be time-consuming and require considerable ongoing monitoring. There are two main approaches which are used to develop proxies: rules-based and statistical.
Proxy decomposition
FRTB regulation allows NMRFs to be decomposed into modellable components and a residual basis, which must be capitalised as non-modellable. For example, credit spreads for small issuers which are not highly liquid can be decomposed into a liquid credit spread index component, which is classed as modellable, and a non-modellable basis or spread.
To test modellability using the RFET, 12-months of data is required for the proxy and basis components. If the basis between the proxy and the risk factor has not been identified and properly capitalised, only the proxy representation of the risk factor can be used in the Risk Theoretical P&L (RTPL). However, if the capital requirement for a basis is determined, either: (i) the proxy risk factor and the basis; or (ii) the original risk factor itself can be included in the RTPL.
Banks should aim to produce preliminary analysis on the cost benefits of proxy development – does the cost and effort of developing proxies outweigh the capital which could be saved by increasing risk factor modellability? For example, proxies which are highly volatile may also result in increasing NMRF capital charges.
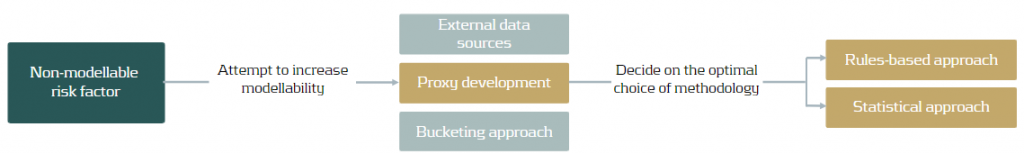
Approaches for the development of proxies
Both rules-based and statistical approaches to developing proxies require considerable effort. Banks should aim to develop statistical approaches as they have been shown to be more accurate and also more efficient in reducing capital requirements for banks.
Rules-based approach
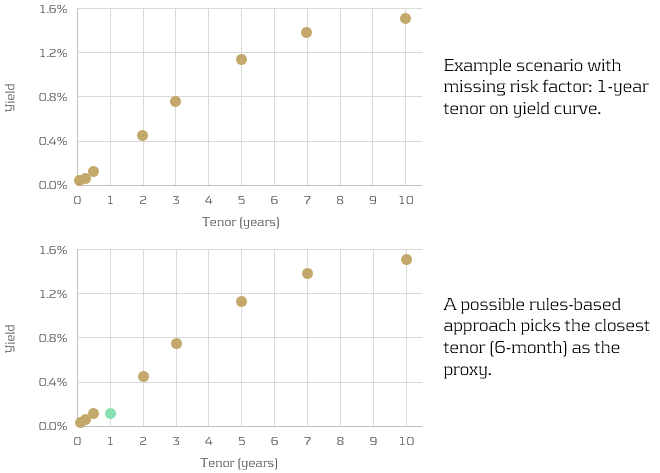
Rules-based approaches are more simplistic, however are less accurate than the statistical approaches. They find the “closest fit” modellable risk factor using somewhat more qualitative methods. For example, picking the closest tenor on a yield curve (see below), using relevant indices or ETFs, or limiting the search for proxies to the same sector as the underlying risk factor.
Similarly, longer tenor points (which may not be traded as frequently) can be decomposed into shorter-tenor points and cross-tenor basis spread.
Statistical approach
Statistical approaches are more quantitate and more accurate than the rules-based approaches. However, this inevitably comes with computational expense. A large number of candidates are tested using the chosen statistical methodology and the closest is picked (see below).
For example, a regression approach could be used to identify which of the candidates are most correlated with the underlying risk factor. Studies have shown that statistical approaches not only produce the more accurate proxies, but can also reduce capital charges by almost twice as much as simpler rules-based approaches.
Conclusion
Risk factor modellability is a considerable concern for banks as it has a direct impact on the size of their capital charges. Inevitably, reducing the number of NMRFs is a key aim for all IMA banks. In this article, we show that developing proxies is one of the strategies that banks can use to minimise the amount of NMRFs in their models. Furthermore, we describe the two main approaches for developing proxies: rules-based and statistical. Although rules-based approaches are less complicated to develop, statistical approaches show much better accuracy and hence have the potential to better reduce capital charges.

How to integrate into your governance, risk management and ORSA
Climate change risks are relatively newly identified risks that insurers are facing. These risks can negatively impact both assets and liabilities of insurers. Already in 2018, the European Commission requested the European Insurance and Occupational Pensions Authority (EIOPA) to investigate how climate change risk could be integrated into the Solvency II Framework.
After various previous publications1 of (draft) opinions, the investigation resulted in EIOPA’s opinion to include climate change risk scenarios in Own Risk and Solvency Assessment (ORSA)2. It basically points out that forward-looking management of climate change risks is essential, and that EIOPA expects insurers to integrate climate change risk scenarios in their ORSA. EIOPA indicates it will start monitoring the application of this opinion two years after publication, i.e. as of April 2023. However, some National Competent Authorities already require insurers to take climate change risks into account.3
So, what will be expected of insurers?
In general terms, insurers are expected to:
- Integrate climate change risks in their system of governance, risk management system and ORSA
- Assess climate change risk in ORSA in the short and long term
- Disclose climate-related information
But what does this mean in practice? We will further explained this per topic.
Integrating climate change risks
The integration requirement ensures that climate change risk becomes an integral part of the day-to-day business and the risk management framework. The EIOPA opinion does not provide much detail on what this entails. Draft amendments to the delegated regulation, published by the European Commission, provide more insight into what insurers can expect.
The draft amendments relate especially to the implementing measures of the system of governance laid out in the Solvency II Directive. This means that responsibilities regarding climate change risk need to be clearly allocated towards the key functions within the organization, and appropriately segregated to ensure an effective system of governance.
This means climate change risk should be included in the following functions/processes:
- Risk Management
For all the relevant risk management areas – covering both the asset and the liability side of the balance sheet, and including liquidity, concentration and operational risk – climate change risks need to be identified, measured, monitored, managed and reported on. - ORSA
The ORSA is a mandatory part of the required system of governance for insurers and will therefore also have to take climate risks into account. In order to properly assess the potential impact of climate change risks and the resilience of the insurers’ business model, these climate change risks need to be analyzed over a longer horizon. EIOPA has therefore advised to include climate change scenarios in the ORSA. This will be discussed in more detail in the next section of this article. - Internal Control and Internal Audit
Changes in the system of governance, risk management and ORSA to incorporate climate change risk also requires extension of the internal control system and the scope of internal audit. - Actuarial Function
The actuarial function will be responsible for the appropriateness of assumptions, methodologies and models used to assess the impact of climate change risks in underwriting. Especially in the context of ORSA and the assessment of the influence climate risk has on future reserving and capital needs. In addition, the actuarial function will be responsible for the sufficiency and quality of the data used within these calculations.
Consequently, written policies regarding risk management, internal control, internal audit, outsourcing (where relevant) and contingency plans need to be updated to include everything outlined above with regards to climate change risk.
Assess climate change risk in ORSA in the short and long term
Insurers will be required to assess climate change risk in ORSA by analyzing at least two climate scenarios. For the implementation we suggest a four-step approach, largely based on the guidance provided by EIOPA.
Step 1 – Risk identification
EIOPA expects insurers to take a broad view of climate change risks and include all risks stemming from trends or events caused by climate change. EIOPA provides a list of these risks, which distinguishes between:
- Transition risks
These are defined as follows: ‘Risks that arise from the transition to a low-carbon and climate-resilient economy’. This includes the following aspects: Policy, Legal, Technology, Market sentiment and Reputational risks. - Physical risks
These are defined as: ‘risks that arise from the physical effects of climate change’ and are subdivided in acute and chronic physical risks.
Materialization of these risks for insurers will translate into impact on traditional risk categories, such as underwriting risk, market risk, credit and counterparty risk, operational risk, reputational risk and strategic risk. To help insurers get started with the implementation of climate change risks in ORSA, EIOPA has provided examples of a mapping in the annex of their opinion.
Step 2 – Materiality assessment
Insurers will be required to include all material climate change risks in ORSA. Under Solvency II, risks are considered material if ignoring the risk could lead to different decision making. This means that insurers are required to assess the materiality of each risk to determine whether these need to be included. If an insurer concludes that a certain climate change risk is immaterial, the insurer must be able to explain how that conclusion was reached.
The materiality assessment should be a combination of a qualitative and a quantitative analysis. The qualitative analysis is to provide insight in the relevance of the climate change risk drivers and the way they impact the traditional prudential risks (underwriting risk, market risk etc.). The quantitative analysis will be used to determine the extent to which assets and liabilities are exposed to transition and physical risks.
Step 3 – Defining scenarios
The inclusion of the forward-looking, risk-based approach to ORSA requires insurers to define a set of climate change risk scenarios. EIOPA expects insurers to assess material climate change risks utilizing ‘a sufficiently wide range of stress tests or scenario analysis, including the material short- and long-term risks associated with climate change’. The goal of these scenarios is to assess the resilience and robustness of the insurer’s business strategies, including the impact of risk mitigating measures.
EIOPA states that insurers may develop their own climate scenarios or build on existing ones and provides a number of sources of publicly available scenarios containing pathways for physical and transition risks. The decision for internal scenario development versus building on publicly available may depend on many factors like expected materiality or company size. For example, the underwriting risk for a life insurer is probably less exposed to transition risk than the underwriting risk for a non-life insurer, and a smaller insurer may not have sufficient expertise and resources.
The scenarios must project a multitude of external factors to properly capture the effects of climate change risks. Factors such as demographics (e.g. in case of natural disasters), economic development (e.g. as a result of technological breakthrough) and government policies to reduce carbon emissions, just to name a few. The climate change scenario set should contain at least two long-term climate scenarios:
- Global temperature increase remains below 2◦C, preferably no more than 1.5◦C, in line with Paris Agreement;
- Global temperature increase exceeds 2◦C.
In addition, a reference scenario is needed to be able to determine the impact of the stress scenarios.
The assessment is to be performed for several time horizons. Given the nature of climate change risks, horizons need to be in the order of decades. EIOPA provides examples for length of time horizons, ranging from instantaneous (‘current climate change’) to projected views of climate change for the next 80 years (‘long-term climate change’).
Step 4 – Climate change risk modeling
Modeling climate change risks in ORSA introduces two challenges:
- Assessment of transition and physical risk impacts
Materialization of transition and physical risks will have to be translated to impact on assets and liabilities. In a discussion paper, EIOPA provides examples of different methodologies for the assessment of transition impacts on assets, that have already been developed by academics, research institutes and regulators4. In general, these methodologies use carbon-sensitivities of financial instruments to assess the impact of climate change risk scenarios.
The basis for the determination of physical risks is the change in temperature over time. This change needs to be translated into impact on frequency and severity of acute natural disasters (e.g. storms, floods, fires or heatwaves) and chronic effects (e.g. rising sea levels, reduced water availability, biodiversity loss and changes in land and soil productivity). The next step is to translate these effects into impact on assets and liabilities. The translation into financial impact on companies in which insurers invest can especially be challenging. Larger companies often have a greater diversity of activities and are more spread out geographically. In addition, companies will not only be hindered by the materialization of physical risks in their own activities, but their supply chain can also be affected. However, some scoring models already exist in which companies are ranked based on their sensitivity to physical risks.5 - Long-term multi-period modeling
Incorporation of the climate change risk scenarios in ORSA aims to assess the viability of current business models and strategies and the adequacy of the insurers’ solvency. For longer horizons, insurers may use a lower precision for balance sheet projections and conduct assessment at a lower frequency than short-term risk assessments.
The lower precision allows for simplifications as long as the long-term character of the climate change scenarios is preserved. Simplifications may include projecting simple ratios instead of full balance sheets, or assessment of climate change impact on assets and technical provisions in isolation. However, projection of the full balance sheet ensures internal consistency and may provide much more information, especially when assessing the impact of potential management actions to mitigate the impact of climate change risks.
Disclose climate-related information
Insurers are expected to provide explanation on the short- and long-term climate change risk analysis in the ORSA report. This should include:
- An overview of all material risks, how materiality is assessed and an explanation for each risk that is considered immaterial.
- The methods and assumptions used by the insurer in both the materiality assessment of the climate change risks and in ORSA.
- The outcomes and conclusions of the scenario analysis, both quantitative and qualitative.
In addition, climate change risk related disclosures should be consistent with the Non-Financial Reporting Directive (NFRD).6
How can Zanders help?
As mentioned in the introduction, climate change risks are relatively new to the insurance sector. The same holds for other financial industries like the banking sector and asset management sector. As a consultancy firm for the financial industry, we support various types of financial institutions with the implementation of ESG and climate-related strategies and regulations. In doing so, we can benefit from our experience gained in the insurance, banking and asset management sectors.
We can assist with the implementation of climate change risk management, including:
- Identification of climate change risk exposures and materiality assessment
- Integration of climate change risks in your system of governance and risk management system
- Incorporate climate change risk into your ORSA, including
- Mapping climate change risks to traditional prudential risk categories
- Development of climate change risk scenarios
- Climate change risk modeling
- Support in setting up or adjusting disclosures
Sources
[1] Previous EIOPA publications related to climate change risk:
- Opinion on Sustainability within Solvency II, 30 September 2019
- draft Opinion on the supervision of the use of climate change risk scenarios in ORSA, 5 October 2020
[2] Opinion on the supervision of the use of climate change risk scenarios in ORSA, 19 April 2021
[3] See:
- DNB>Insurers>Prudential supervision> Q&A Climate-related risks and insurers (February 2021)
- PRA: Supervisory Statement 3/19 – Enhancing banks’ and insurers’ approaches to managing the financial risks from climate change (April 2019)
[4] Second Discussion Paper on Methodological principles of insurance stress testing, 24 June 2020
[5] See footnote 4
[6] Guidelines on non-financial reporting: Supplement on reporting climate-related information, 17 June 2019

LyondellBasell – Business Case
LyondellBasell, headquartered in the Netherlands, is one of the largest plastics, chemicals and refining companies in the world. With its global presence and significant operations in the United States, the company has been affected by the IBOR reform. The Treasury team was well aware of this impact and proactively approached the transition away from the IBOR rates in order to be ready ahead of time.
While it was a global and multi-functional project, one of the first goals was to ensure the TMS readiness for the calculation with alternative reference rates and the new discounting methodologies. As part of the action plan, the LyondellBasell (LYB) Treasury team (supported by procurement and IT) issued an RfP in Q4 2020 with the aim to get external support for (a) the required system changes, (b) to provide business support for initial transition plans and (c) to adhere to the best-in-class ambition of the company.
Preparing for the transition
LYB selected Zanders as implementation partner and right after the selection the project kicked off in January 2021. Urszula Chwala, was the Treasury Lead for LYB and she outlines why LYB initiated the project earlier than many other corporates: “The project team was already busy since the beginning of 2020. We analyzed the potential global impact of the IBOR reform to LYB. Amongst other impacts we were aware that LYB’s SAP Treasury Management System was highly customized, especially in the area of SAP In-house Cash. As such, we wanted to make sure that we would be ready for the transition to support our business and to enable all teams at LYB to move forward with changes on financial, commercial and legal matters.” Urszula also further comments on the RfP process: “We were looking into the third party that had both technical and business knowledge related to the IBOR reform and could bridge the gap between LYB IT and the Treasury department.”
Appreciated approach
LYB is using SAP ECC EHP8 as their treasury system and as such the standard functionality developed by SAP to support daily compound interest calculation could be implemented. On the Zanders side, SAP consultant Aleksei Abakumov, Adela Kozelova (who fulfilled the role of the business expert and project manager) and Anuja Naiknavare in the role of support consultant have been closely working with LYB’s Treasury and IT teams throughout the project.
“Zanders made this project as easy as it could be. What I really appreciated was the approach taken by Zanders team. They have taken all the suggestions from us and tested them and then came up with additional suggestions as well. The Zanders team was thinking with us, taking our best interest in mind. They supported us in every detail and removed concerns and roadblocks. Zanders also acted as business alliance in the project to ensure that all business requirements are now fully translated into the technical solution,” Urszula says.
A new functionality
In order to achieve system readiness, the project included configuration and diligent testing of a new data feed source which was required as a base to enable the daily average compound, the simple compound interest calculation and the new evaluation type with enhanced discounting curves. Considering the uncertainty, the availability of the new alternative reference rates, market conventions and the exact timing, the project’s aim was to make sure that the system would be able to support different variations of interest calculation. The project went successfully live in May 2021.
Urszula outlines different challenges encountered in the project: “Technically the biggest challenge was finding the right market data feed for the new rates. The challenge was finding the source and, making it available in SAP and test all scenarios. For the actual transactions, the system is a lot more flexible with respect to entering transactions, which makes a deal capture more complex. But Aleksei has supported the team a lot in navigating through the new functionality and we are confident to enter new deals with overnight risk-free rates. On the business side, the market clarity, especially with regards to market conventions, is still challenging the business cutover.”
Transactions
On the transition side, Treasury was cautiously managing the exposure to the IBOR reform by refraining from entering variable interest rate referencing transactions over the last two years. As a result, there is no need to cutover of any existing transaction. However, there are few intercompany loans that will mature by the end of this year and some of them might be replaced by the deals referencing to the overnight risk-free rates. Having strong presence in the United States, the exposure to the USD LIBOR is considerably higher than to the GBP and CHF LIBOR ceasing at the end of this year. Therefore, the major transition is only expected over the next year, closer to the cessation of the USD LIBOR.
Urszula elaborates on the business transition: “Understanding the logic of how new instruments are going to work gives me a piece of mind for the transition. LYB never meant to be an early adopter of the change. Switching intercompany loans as first seems to be the best approach for us, because there are no corresponding derivatives needed for these products. Also, there is no dependency on the external counterparties, which makes the transition easier.”
Really achieved
LYB and Zanders are currently working on a follow-up project for the cash flow aggregation of interest in SAP. This need emerged from the new daily compounding functionality, which by default creates daily cash flow postings that are difficult to reconcile with the interest settlements. A user-friendly solution to aggregate these daily cash flows has been defined and configured and is currently being validated by the end users. This is the last step for LYB to be ready to create a first deal with daily compounding interest calculation in the system.
Urszula concludes: “The change is coming so you can choose either to embrace it or to postpone it. We decided to embrace it now. The greatest achievement of this project is that the project was executed within original timelines, without major issues and it gave the whole Treasury team confidence that the system will perform well. What needed to be achieved was really achieved. The complete solution is already implemented for the technical side.”

With house bank accounts treated as master data instead of configuration objects including the latest enhancement, the bank account subledger concept, SAP S/4HANA Bank Account Management (BAM) aims to shift responsibility of bank account management life cycle from the technical teams to the cash and banking teams.
Bank accounts can now be created and maintained by the cash and banking responsible team, giving them more control over the timing of opening or closing of an account as well as expediting the overall process and limiting the number of users involved in the maintenance of the accounts.
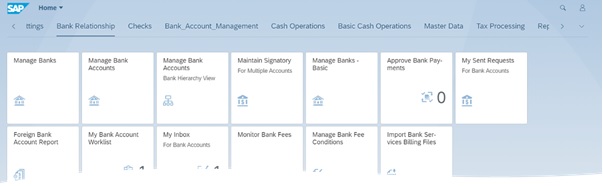
Figure 1 – Launchpad BankApplications
The advantages of using the full version of BAM are multiple, but below we highlight three of the main reasons full BAM is a must have for the companies using one or multiple SAP environments.
Flexible workflows
Maintenance of bank account data can trigger workflows based on the organization’s requirements and the approval processes in place. With the workflows the segregation of duties can be enforced when maintaining a bank account.
Even though workflows are not a new functionality in S/4HANA, the fact that workflow templates are available and can be amended by defining preconditions, step sequences and recipients improves the approval process of bank accounts.
The workflows can be created and activated as completely new ones or based on the already existing templates . You can create a new workflow by copying an existing one and updating the parameters according to the new requirements.
All the requests to release or approve bank account changes are available as of S/4HANA 2020 in the My Inbox for Bank Accounts app, the dedicated inbox app where users can check the status of each request initiated by the users themselves or sent to them and act upon.
Easy data replication
One of the challenges multiple organizations have, especially those operating various SAP environments, is data synchronization and replication. We often come across situations when banks, house banks and bank accounts are not maintained in all relevant environments creating data inconsistencies and making processes more difficult than they already are.
One of the ways of avoiding these types of situations is by replicating banks, house banks and bank accounts from production to quality assurance and to development environments using standard Idocs.
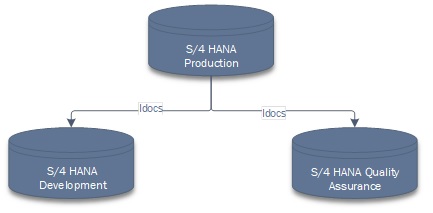
Figure 2 – Bank data replication in S/4 HANA
If the organization is operating on multiple SAP and non-SAP instances and running processes in a S/4 HANA side-car solution, the challenge of maintaining banks, house banks and bank accounts grows exponentially. Distributing the data via Idocs will not only keep all the systems coordinated, it will also decrease the amount of manual work and avoid situations when processes fail because of delays in keeping the data up to date in all relevant environments.
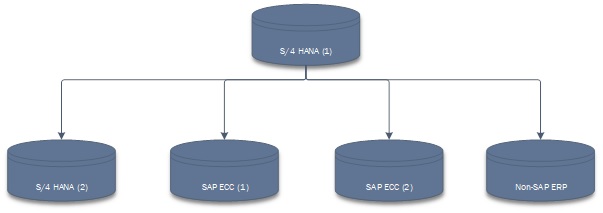
Figure 3 -Bank data replication across multiple environments
Simple way of managing cash pools
Cash pooling structures can easily be set up by the user and in this way the BAM solution is integrated with the process of making cash management transfers.
Even though the cash pooling and cash concentration in S/4HANA are managed using five different apps (shown in the figure below), the actual structure of the cash pool is defined directly in the Manage Bank Accounts app (Cash Pool tab).
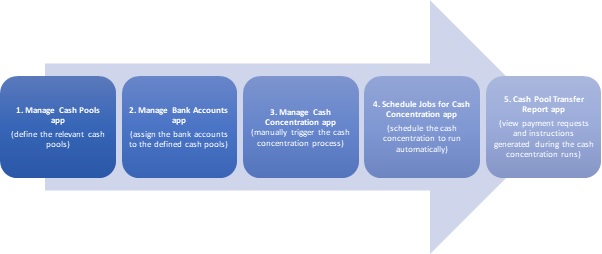
Figure 4 – Five apps to manage cash pooling and cash concentration in S/4HANA
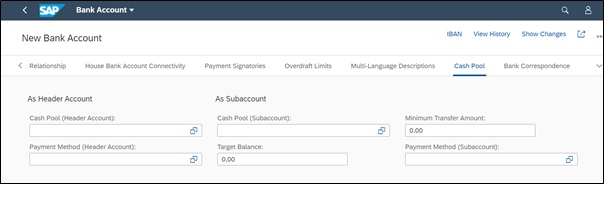
In the Cash Pool tab, the user can define the cash pool structure as per each company’s requirements. It is important to keep in mind the fact that a bank account can be assigned only to two different cash pools: once as the header account of a cash pool, and once in a different cash pool, as a subaccount.
The cash pools created in the system are not restricted to one company code but can be defined using various currency accounts belonging to multiple company codes. For each of the bank accounts included in a cash pool, a target balance as well as a minimum transfer amount can be defined in the Cash Pool tab of the Manage Bank Accounts app, with the mention that both (target balance as well as minimum transfer amounts) must be defined in the bank account currency.
During the cash concentration process, when bank transfers are generated, the payment methods defined in this tab will be picked up. Therefore, if required, two different payment methods can be assigned; the first for the structure where the bank account is acting as a header account and the second for the one where the account in scope is a subaccount. To pick them up from the drop-down list, the assigned payment methods must be initially setup in the system.
To conclude
Maintaining banks, house banks and bank accounts can be a difficult task especially in large organizations operating with different SAP and non-SAP environments. It can be time-consuming; it can involve multiple people from different parts of the organization (IT, master data, cash and banking etc.) and it can easily be prone to errors and mismatches if not correctly maintained and synchronized. Having one single source of truth for the bank accounts – which is easy to maintain, user-friendly, with appropriate controls in place and reporting capabilities, easy to replicate the data across different environments and which allows the user to create and maintain not only the bank accounts but also the cash pool structures – can save time, resources and simplify processes.

The need to formulate a treasury technology roadmap for your organization has never been more critical.
This is particularly relevant for large complex organizations that are running SAP. The SAP S/4HANA move is complex and presents great opportunities and challenges. For the treasury within these large complex organizations it does not make sense to wait for the enterprise to formulate a roadmap as then the likelihood of the treasury requirements not being properly prioritized are high.
It is in this context that Zanders provides the option to help your organization formulate a treasury technology roadmap. Driven by 27 years of experience we have built a best practice framework for treasury transformation projects. The approach we have formulated for the treasury technology roadmap ensures that we start by focusing efforts on establishing a clear set of requirements for the treasury organization and processes. Here too we have built up a sound catalogue of strategic treasury requirements which are mapped to a solid treasury business process framework, and it is against this foundation that we engage with the treasury organization to ensure we emerge with an accurate view of the specific treasury requirements. In the process we ensure these requirements are categorized according to priority and evaluated relative to current available functionality.
Enablers for core treasury activities
We also establish a clear scope for the roadmap based on the activities to be covered which in effect defines the processes in scope. The Zanders framework uses three core treasury activities being Treasury Operations, Risk Management and Enterprise Funding with the associated 15 underlying sub-processes that support these.
The Zanders framework then has four enablers that support these core treasury activities. These are:
- Strategy and organization
- Banking Infrastructure
- Processes and systems
- Governance and controls
Typically for a treasury technology roadmap engagement, the focus is on the processes and systems enabler, but we will also take into the strategy and organization in formulating the scope of the assessment here the geographic and organizational scope is established and confirmed. For banking infrastructure, the banks, bank accounts and payment type scope is established.
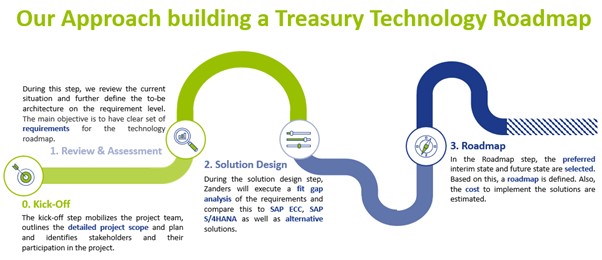
Figure 1: Treasury Roadmap; Driven by 27 years of experience we have built a best practice framework for Treasury Transformation projects. Based on this framework and considering what has been requested by clients, we propose the following approach to build a well-defined Treasury Technology Roadmap.
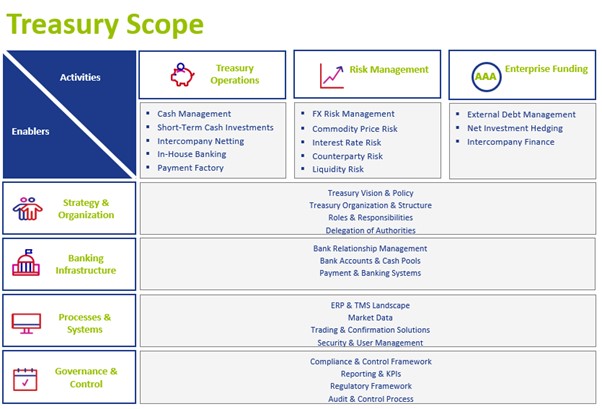
Figure 2 – Treasury scope; The starting point for kicking off the roadmap is defining the functional scope in line with the three core Treasury activities (Treasury Operations, Risk Management, Enterprise Funding) and the relevant underlying 15 sub-activities.
Fit-gap analysis of requirement
The next step in the process is solution design where we perform a fit-gap analysis of requirement and compare this to the existing and proposed treasury technology platforms. This analysis can be tailored to exclusively focus on SAP treasury solutions or include suitable alternative technology platforms. In addition, with the increase in available add-on solutions in the market this analysis can also be expanded to explore and expose the relevant technology solutions that fit the unique treasury requirements based on the prioritization established.
Where the first step of the process ensured an accurate understanding of the organization’s treasury requirements, this step ensures that the treasury organization is exposed to a focused set of relevant solutions that meet these requirements.
A further important consideration is on which SAP system within the organization the treasury requirements will be implemented. Here the many available deployment options need to be considered and evaluated including S/4 HANA side car options (Cloud or On Premise), deployment in a single central instance and the likes of Central Finance architecture and approach.
Meeting all objectives
Finally, the roadmap step is where the analysis is brought together to settle on relevant alternative options that meet both treasury and the broader enterprise’s strategic long-term objectives. For these viable technology options realistic implementation timeframes are estimated and a framework for total cost of ownership is established. This ensures that the basis for the business case is established and the parameters for the various options are clearly articulated.
In such a way the treasury organization is able to help lead rather than follow at this crucial time and hence ensure that the treasury technology requirements are included in the overall enterprise technology roadmap and a measure of order and clarity is brought into the formulation of the enterprise transformation plans.

Fail Fast, Fail Early, Fail Often
Testing is a critical activity in any implementation, and it has a significant impact in any overall project success. However, testing often takes longer than planned, due to poor execution or unexpected issues that arise in a later project stage. Such problems usually occur when not all the variables necessary for a successful test journey have been considered.
To avoid these issues, we have defined a testing framework to help you identify an optimal testing strategy and approach. The framework depicts building blocks that need to be present and considered for effective and successful system testing where project size, project scope, project approach and resource availability need to be taken into consideration.
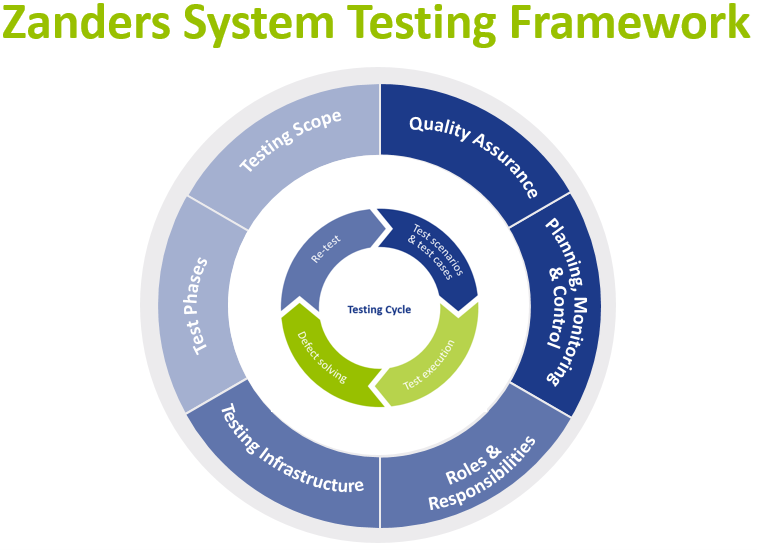
This article further describes each of these building blocks and it will outline factors and principles that help to achieve effective testing and result in a sound system implementation.
Testing Strategy – a top-down approach
Before starting to look at each area of the testing framework, the testing strategy needs to be defined. The strategy, based on project size and scope, should determine what the testing key principles are:
- High level scope
- Proposed phases and duration
- Business engagement and involvement
- Testing governance model
- Key benefits and risks mitigated by each testing phase
- When and how to determine exit criteria’s
The testing strategy will then underpin the detailed plan and definition of each one of our testing building blocks.
Roles & Responsibilities
Clear establishment of roles and responsibilities (RACI matrix) is key to the effective testing. This ensures that the right profiles are assigned to each area, and that there is clear ownership for each deliverable. This is key to have a realistic estimation of effort and plan. Some examples of roles and responsibilities include:
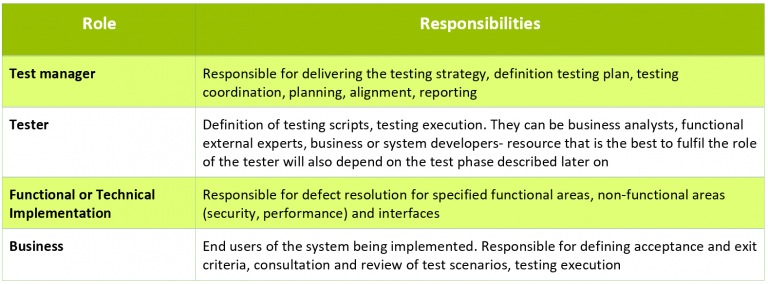
In smaller scale projects, the above roles may be combined under the same resource, while in larger projects more resources will be needed to fulfil a single role. One of the key principles with regards to resourcing is the early involvement of business in testing. Early involvement of the business in testing provides the following benefits:
- Focus on business value items and critical areas, which ultimately saves cost and time and ensures early risk mitigation.
- Continuous improvement and assurance that project’s overall objective and business case is met.
- Business embraces the process and organizational changes faster.
- Critical areas are tested sooner, and critical issues are solved earlier.
- Establishment of the business ownership of the system being implemented.
Planning, Monitoring & Control
Plans need to lay down testing scope (test scenarios and test cases), number and type of resources and time needed for preparation and execution for each test phase. It should also take into consideration the system development stage and other entry criteria, as well as an estimate of the defects and defect resolution time.
Around monitoring and control it is essential that test execution itself is administered in a consistent manner. There are software solutions that can support the whole testing process and its administration. In any case, the progress of testing and the status of the progress of defect handling need to be trackable. At a minimum, it is recommended to track and gather evidence for the following:
- Test scenarios and test cases, including testers and timelines.
- Overview of defects, including root cause, severity classification, resolution timelines and person responsible for fixing the defect.
- Test execution evidence, including actual execution timelines, pass/fail status, screenshots, and other evidence.
It is also important to report daily on the progress of each test phase, as this enables project managers to mitigate deviations from the plan in the timely manner. Progress reporting will provide transparency, and it helps to increase confidence of the involved stakeholders.
Testing Scope
Testing should follow predetermined test scenarios and test cases. Test scenarios describe what functionality of the system is to be tested (e.g. input FX trade request, approve FX trade request). Test cases describe variations that should be tested, such as deal types or events (FX spot trade, FX forward trade, unwind, for example).
All test scenarios and test cases should be linked to the initial business requirements and should be created, reviewed, and approved by the business. Business can help identifying value items and risk areas that should take priority for testing. This allows priority and risk to be assigned to different functionalities, processes, and test scenarios.

Quality Assurance
Quality assurance while testing is two-fold. The project should assure both the quality of the system being implemented, as well as the quality of the test execution.
Essentially, testing activity validates whether what was developed provides an adequate outcome. Expected results are based on the requirements laid out in the system design documentation. It is important that business is involved in definition and review of the expected result.
Setting the quality for testing execution involves defining relevant criteria. First, entry criteria are set before each test phase, such as completion of the (piece of) system development, environment setup, access to the environment for testers and availability of relevant data. Second, exit criteria need to be established, which will determine when the test phase can be successfully exited.
Furthermore, acceptable variances and thresholds (e.g. legacy system vs new system portfolio valuations due to different valuation methodologies or rounding differences) need to be defined with the business beforehand and included in the expected results and acceptance criteria.
Testing Infrastructure
In any system implementation, it is standard to operate with at least three system environments. It is also common to deploy a multiple test environment, e.g. an environment for the ST/SIT testing and a test environment dedicated to UAT test phase.
Test automation should be included, or at least considered, in any larger system implementation projects. When selecting processes to automate testing we look for:
- Repetitive tests (e.g. deal capture, master data creation/change/deletion).
- Tests that tend to cause human error (e.g. market rate manual upload).
- Tests that require multiple data sets (e.g. master data uploads).
- Frequently used functionality that introduces high risk conditions (e.g. payment runs).
- Tests that are impossible to perform manually (e.g. performance and non-functional requirements tests).
When analyzing what to automate, it is very important to take a strategic and broad view. If testing of some processes or functionalities can be automated, it is probable that after system deployment these processes or functionalities can also be automated in day-to-day execution.
Most of the existing tools that can be used for automation are not expensive and in some cases in-house expertise can be used (e.g. RPA). Examples of such solutions are mentioned below:
- Robotic Process Automation (RPA) for process testing and validation.
- Standard automation testing tools (e.g. Selenium, TestComplete) for functional and non-functional testing.
- Non-functional Requirements and performance testing tools (e.g. Splunk).
Some treasury management systems have also started to provide their own tools, embedded in their systems (e.g, scripting).
Testing Phases
There are several unique testing phases with specific objectives. The figure below shows these testing phases across time (system delivery stage) and illustrates in what system environment the testing should be performed. This figure is based on the conventional Waterfall (phased) project approach.
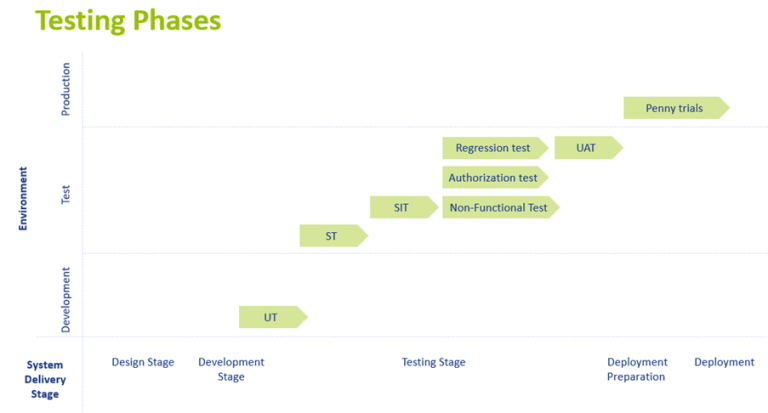
UT (Unit Test)
This is a first test performed and it follows straight after completion of system configuration and setup. The purpose of the UT is to initially confirm both technical and functional requirements. It tests a functionality on a stand-alone basis.
ST (System Test)
System Testing focuses on a combination of unit tests (testing several build components) in a specific process flow and it is performed in the test environment. For example, for back-to-back FX dealing, ST will consist of FX trade request input, trade request approval, FX trade execution, deal creation and mirroring, payment request creation and accounting postings.
SIT (System Integration Test)
The purpose of SIT is to test end-to-end processes including interfaces with connected systems and applications. SIT is also performed in the test environment and it requires availability of the test environments from the connected systems and applications.
Authorizations test
Most of the systems will require authorization setup for different system users, next to the workflow configuration. Authorizations determine what activities a specific user can perform in the system.
Non-Functional Test
Non-Functional Testing is a technical test, typically executed by technical resource. It tests system performance, security and other non-functional requirements.
UAT (User Acceptance Test)
UAT is the one of the last tests before technical and business go-live. It is a functional test, and it should be executed by the key users of the system. Generally, this is the longest test period. UAT test scenarios include workflow testing, authorization testing, negative test cases and business continuity plan activities. This test phase also includes the largest variation of test cases.
Penny trials phase
This testing phase is mostly applicable when the project also includes commercial or trade settlements. Penny trials are part of the system deployment preparation and they are performed in the production ‘live’ environment. The actual end to end deal process including payment and confirmation will be executed with low value transactions (e.g. a $10 spot deal).
Parallel Run
It can be beneficial to operate a system in the parallel run mode at least for some period. Parallel run basically replicates day-to-day activities in the system being implemented in parallel to the legacy system and processes.
Adopting System Testing Framework in Agile Projects
In recent years, organizations have increasingly adopted an agile project approach for system implementation. An agile approach would split system development in smaller products that could be incrementally deployed (in a production or testing environment).
System testing framework can be and should be adopted in the agile or mixed project approach as well. Most of the building blocks for successful testing described here are agnostic to the project approach given, some tailoring of the specific factors to the format of agile approach is executed. As system delivery is split into smaller deployable products in agile approach, test phases should follow the same design. That means that instead of a single SIT period, SIT would be executed after completion of each incremental system development (e.g. back-to-back dealing). Nevertheless, it is notable to mention that in agile projects there needs to also be several testing phases, tested by different resources.
Conclusion: Failure is success in progress
There is no one-size-fits-all around testing. The project size and scope, resource availability, internal and external skillsets and project methodology will determine how to approach each testing phase. Nevertheless, having the right system testing framework to guide you through a project is essential to any successful project. This will ensure that you fail fast, early, often during early testing phases, reducing go live delivery and operational risks.

Climate and environmental changes are viewed among the most important risks in society at present.
As the financial sector is key for the transition towards a low-carbon and more circular economy, financial institutions have to deal with climate-related and environmental financial risks (C&E risks). At the same time, the increased importance of these C&E risks also presents new business opportunities for the financial sector. Therefore, to support banks in their self-assessment and action plans, Zanders developed a Scan & Plan Solution on C&E risks.
According to the 2021 World Economic Forum Global Risk Report1, extreme weather, climate action failure, human environmental damage and biodiversity loss are ranked as four of the top five global risks by highest likelihood and four of the six global risks with the largest impact. It is not surprising that over the past years, numerous articles on C&E risks have been published and many initiatives have been taken to identify, measure and manage these risks. The Paris Agreement2, the United Nations 2030 Agenda for Sustainable Development3 and more recently the European Green Deal4 are the main examples of international governmental responses to address C&E risks.
The financial sector is considered key for the transition towards a low-carbon and more circular economy. This is illustrated by the fact that the European Central Bank (ECB) has identified climate-related risks as a key risk driver for the euro area banking system in their Single Supervisory Mechanism Risk Map5. At the same time, the increased importance of C&E risks also presents new business opportunities for the financial sector, such as providing sustainable financing solutions and offering new financial instruments that facilitate C&E risk management. To illustrate, the UN’s Intergovernmental Panel on Climate Change6 (IPCC) estimates that the required investment for alignment with the Paris Agreement would be at least $3.5tn per year until 2050 for the energy sector alone.
To address C&E risks, the ECB published a Guide on climate-related and environmental risks7 for banks that describes the ECB’s supervisory expectations related to risk management and disclosure. Banks are required by the ECB to perform a self-assessment with respect to the supervisory expectations and to draft an action plan in 2021. The self-assessments and plans will subsequently be reviewed and challenged by the ECB as part of the supervisory dialogue. In 2022, the ECB will conduct a full supervisory review of bank’s practices related to C&E risks.
The Zanders Scan & Plan Solution provides clear insights into gaps with the ECB expectations and proposes practical actions that are tailored to a bank’s nature, scale and complexity. This article provides a brief explanation of C&E risks, outlines a few specific ECB supervisory expectations and elaborates on the Solution.
Definition of C&E risk
Financial risks from climate and environmental change arise from two primary risk categories:
- Physical risks. The first risk category concerns physical risks caused by acute (direct events) or chronic (longer-term events which cause gradual deterioration) C&E events. Examples of acute events are floods, wildfires and heatwaves, whereas chronic events relate to the likes of rising sea levels, acidity and biodiversity losses, for example.
- Transition risks. The second risk category comprises transition risks resulting from the process of moving towards a low-carbon economy. Changes in policy, regulation, technology, market sentiment and consumer sentiment could destabilize markets, tighten financial conditions and lead to procyclicality of losses.
These two risk categories are distinct from other risk categories in the following aspects: 1) they have a correlated and non-linear impact on all business lines, sectors and geographies, 2) they have a long-term nature and 3) the future impact is largely dependent on short-term actions. The risk categories are, among others, drivers of credit, market and operational risk, as shown in Figure 1.
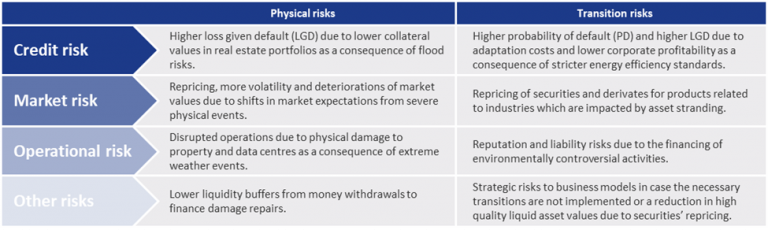
Figure 1: Examples of the impact of physical risks and transition risks on traditional risk types from the ECB Guide on climate-related and environmental risks.
ECB Supervisory Expectations
In the Guide on climate-related and environmental risks7, published in November 2020, the ECB explains that banks are expected to reflect C&E risks as drivers of existing risk categories (e.g., credit risk, market risk, operational risk) rather than as a separate risk type. This indicates that not only efforts should be made by banks to develop risk management practices related to C&E risks but that these practices should also be integrated in existing risk management frameworks, models and policies.
The ECB Guide covers four main areas. First, in relation to ‘business models and strategy’, the ECB expects banks to understand the impact of C&E risks on their business environment and integrate C&E risks in their business strategy. Secondly, the guide addresses ‘governance and risk appetite’. The ECB expects a bank’s management to include C&E risks in the risk appetite framework, assign responsibilities related to C&E risks to the three lines of defense and establish internal reporting. Thirdly, in relation to ‘risk management’, the ECB expects that banks integrate C&E risks into their existing risk management framework. Finally, regarding ‘disclosures’, the ECB expects banks to disclose meaningful information and metrics on C&E risks. The four above-mentioned areas are covered in 13 expectations, which are in turn further divided in 46 sub-expectations. Banks are required by the ECB to perform a self-assessment with respect to the supervisory expectations and to draft an action plan in 2021. The self-assessments and plans will subsequently be reviewed and challenged by the ECB as part of the supervisory dialogue. The ECB recommends National Competent Authorities, in their supervision of less significant institutions, to apply these expectations proportionate to the nature, scale and complexity of the bank’s activities.
Zanders has thoroughly analyzed all (sub)-expectations and has highlighted a few specific expectations including possible actions below.
Expectation 4.2: Institutions are expected to develop appropriate key risk indicators (KRI) and set appropriate limits for effectively managing climate-related and environmental risks in line with their regular monitoring and escalation arrangements.
Here, the ECB expects institutions to monitor and report their exposures to C&E risks based on current data and forward-looking estimations. In addition, institutions are expected to assign quantitative metrics to C&E risks. It is however acknowledged that, since definitions, taxonomies and methodologies are still under development, qualitative metric or proxy data can be used as long as specific quantitative metrics are not yet available. The ECB deems that the metrics should reflect the long-term nature of climate change, and explicitly consider different paths for temperature and greenhouse gas emissions. Finally, the ECB expects institutions to define limits on the metrics based on the risk appetite regarding C&E risks.
This expectation has various elements to it, and Zanders has defined as the most important and first step to identify the internal and external data availability related to C&E risks. If the data availability allows it, an institution should set up quantitative metrics and limits on these metrics that reflect C&E risks. A first step to achieve this would be to define several firmwide KRIs, for example by limiting the carbon emission of the whole portfolio in line with the Paris Agreement2 or other (inter)national climate agreements. These KRIs can then be cascaded down to business lines and/or portfolios, such as limiting the exposure to specific sectors with large carbon footprints or substantial use of water. If the current data availability does not allow for quantitative metrics, the bank should identify which data is still lacking and assess ways to collect this data from internal data sources or external data providers in the course of time. In the meantime, qualitative metrics or proxies could be developed such as a qualitative score for the sophistication of the climate strategy of large corporates in the portfolio.
Should a bank already have some metrics in place, Zanders advises to evaluate if these metrics sufficiently cover all material physical and transition C&E risks that the bank is expected to face and if there are ways to increase the sophistication of these metrics, for example by including forward-looking estimations. Finally, Zanders advises banks to create a monitoring procedure to ensure that these metrics and their limits are evaluated regularly.
Expectation 8.1: Climate-related and environmental risks are expected to be included in all relevant stages of the credit-granting process and credit processing.
In this expectation, the ECB underlines that banks should identify and assess material factors that affect the default risk of loan exposures. The quality of the client’s own management of C&E risks may be taken into account in this case. In addition, banks are expected to consider changes in the credit risk profiles based on sectors and geographical areas.
The way to address this expectation is highly dependent on the nature of the bank, on the existing credit granting process and on the availability of data. Some examples of including C&E risk in the credit granting process in a qualitative way, which Zanders has observed in the market, are the development of shadow PD models that trigger mitigating actions in case of large discrepancies with the regular PDs, or the introduction of a scorecard based on quantitative as well as qualitative aspects.
It should be noted that these and other solutions are not mutually exclusive and that multiple approaches can be adopted for different parts of the portfolio. Also, the efforts for several individual expectations can be combined. For example, taking C&E risks into account in the credit granting process could also be linked to the qualitative and quantitative metrics set as part of expectation 4.2 (see above). The quality of the client’s own management of C&E risks can for instance be measured based on the qualitative score for the climate strategy sophistication of large corporates mentioned above.
Expectation 11: Institutions with material climate-related and environmental risks are expected to evaluate the appropriateness of their stress testing, with a view to incorporating them into their baseline and adverse scenarios.
This expectation indicates that banks should evaluate the appropriateness of their stress testing in relation to C&E risks. In this evaluation, the bank should take into account the following considerations: i) how will the bank be affected by physical and transition risks, ii) how will C&E risks evolve under various scenarios (thereby taking into account that these risks may not fully be reflected in historical data), and iii) how may C&E risks materialize in the short-, medium- and long-term. Based on these considerations and on scientific climate change pathways as well as on assumptions that fit with their risk profile and individual specification, banks should incorporate C&E risks in their baseline and adverse scenarios.
To address this recommendation, Zanders advises banks to first identify C&E risks scenarios with different severities based on the materiality of C&E risks for the bank. Examples of this include early or late transition to a low-carbon economy (transition risk), introduction of a carbon tax (transition risk) or staying below or above a 2°C temperature increase (physical risk). These scenarios could be based on scientific scenarios from the IPCC8 or the International Energy Agency9. The next step is to translate these scenarios into macro-economic variables, such as GDP, inflation and loan valuations, over a range of relevant sectors and geographies. Since there is not yet a single methodology to do this, banks need to be creative and combine new qualitative and quantitative approaches with existing modeling methodologies.
Zanders Scan & Plan Solution
To manage C&E risks, to seize new business opportunities and to meet the regulatory expectations related to C&E risks, it is crucial for banks to have transparency about their exposure to these risks. To support banks with this, the Zanders Scan & Plan Solution is available. The Scan assesses the gaps between the bank’s current practices and each of the expectations in the ECB guide. These gaps are scored based on a pre-defined scoring system and are shown in a heatmap that is easy to interpret. Subsequently, the Plan proposes possible actions to close the identified gaps. These possible actions will be tailored to the nature, scale, and complexity of the bank and to the level of sophistication of the bank in the field of C&E risks. The Scan & Plan will be provided in the form of a detailed report.
Zanders has previously supported clients on topics related to climate change, published market insights and supported research. In addition, Zanders has broad experience in supporting clients in each of the areas of the ECB guide: business models and strategy, governance and risk appetite, risk management and disclosure. Hence, Zanders is in an excellent position to also support banks with the implementation of the proposed actions from the Scan & Plan or with shaping new business activities related to C&E risks.
To learn more about the Zanders Scan & Plan solution and how Zanders can support your institution with managing C&E risks, please contact Petra van Meel, Marije Wiersma or Pieter Klaassen.


