For banks, using variable savings as a source of financing differs fundamentally from ‘professional’ sources of financing.
For banks, using variable savings as a source of financing differs fundamentally from ‘professional’ sources of financing. What risks are involved and how do you determine the return? With capital market financing, such as bond financing, the redemption is known in advance and the interest coupon is fixed for a longer period of time. Financing using variable savings differs from this on two points: the client can withdraw the money at any given time and the bank has the right to adjust the interest rate when it wants to. An essential question here is: why would a bank opt to use savings for financing rather than other sources of financing? The answer to this question is not a simple one, but has to do with the relationship between risk and return.
DETERMINING RETURNS ON THE SAVINGS PORTFOLIO
How do you determine the yield on savings? In order to get as accurate an estimate as possible of the return on a balance sheet instrument, the client rate for a product is often compared to what is called the internal benchmark price, also referred to as the ‘funds transfer price’ (FTP). For savings, the FTP represents the theoretical yield achieved from investing these funds. The difference between the theoretical yield and the actual costs (which includes not only the costs of paying interest on savings, but also the operating/IT costs, for instance) can be regarded as the return on the savings. Calculating this theoretical yield is not a simple task, however. It is often based on a notional investment portfolio, with the same interest rate and liquidity periods as the savings. These periods reflect the interest rate and liquidity characteristics of the savings.
"By ensuring that the expected outflow of savings coincides with the expected influx from investments, the liquidity requirements can be satisfied in the future as well."
MANAGING MARGIN RISK
The question that now arises is: what risks do the savings pose for the bank? Fluctuating market interest rates have an impact on both the yields on the investments and the interest costs on the savings. Although the bank has the right to set its own interest rate, there is a great deal of dependency since banks often follow the interest rate of the market (i.e., their competitors) in order to retain their volume of savings. The bank is therefore exposed to margin risk if the income from the investments does not keep pace with the savings rate offered to clients.
The risk-free interest rate is often the biggest driver behind these kinds of movements on the market for savings interest. The dependency between the savings interest and risk-free interest is indicated using the (estimated) interest rate period. This information makes it possible to mitigate the margin risk in two ways. The interest rate period of the investment portfolio can be aligned with the savings, which causes this income to respond to the interest-free interest rate to the same degree as the costs of paying the savings interest rate. It is also possible to enter into interest rate swaps to influence the interest rate period of the investments.
ASSESSING LIQUIDITY RISK
The liquidity risk of savings manifests if clients withdraw their money and the bank does not have enough cash/liquid investments to comply with these withdrawals. By ensuring that the expected outflow of savings coincides with the expected influx from investments, the liquidity requirements can be satisfied in the future as well. Consequently a bank will be less likely to find itself forced to raise financing or sell illiquid investments in crisis situations. A bank also maintains liquidity buffers for its liquidity requirements in the short term; the regulator requires it to do this by means of the LCR (Liquidity Coverage Ratio) requirement. Since it is expensive to maintain liquidity buffers, a bank aims for a prudent liquidity buffer, but one that is as low as possible. It is also essential for the bank to determine the liquidity period (how long savings remain in the client’s account). It must do this in order to manage the liquidity risk, but also to determine the right level of cash buffers, which improves the return. Savings modeling is a must In order to get the right insight into savings - and to manage them - it is essential to determine both the interest rate period and liquidity period of those savings. It is only with this information that management can gain insight into how the return on savings relates to the margin and liquidity risk.
Regulators are also putting increasing pressure on banks to have better insight into savings. In interest rate risk management, for instance, DNB requires that the interest rate risk of savings be properly substantiated. There is also increasing attention to this from the standpoint of liquidity risk management, for instance as part of the ILAAP (Internal Liquidity Adequacy Assessment Process). Modeling of savings is therefore an absolute must for banks.
GROWING INTEREST IN SAVINGS
At the end of 2012, approximately EUR 950 million of the total of EUR 2.7 billion on Dutch banks’ balance sheets was financed with private savings. EUR 545 million of this comes from Dutch households and businesses. Given the fact that the credit extended to this sector totals EUR 997 million, the Dutch funding gap is the highest of all the euro-zone countries except for Ireland. Since the start of the financial crisis in 2008, there have been two developments that have contributed to the growing interest in savings on the part of banks. First of all, after the collapse of the (inter-bank) money and capital markets, banks had to seek out alternative stable sources of financing. Secondly, compared to other forms of financing, savings have secured a relatively favourable position in the liquidity regulations under Basel III. This culminated in a price war on the savings market in 2010.

Credit rating agencies and the credit ratings they publish have been the subject of a lot of debate over the years. While they provide valuable insight in the creditworthiness of companies, they have been criticized for assigning high ratings to package sub-prime mortgages, for not being representative when a sudden crisis hits and the effect they have on creating ‘self fulfilling prophecies’ in times of economic downturn.
For all the criticism that rating models and credit rating agencies have had through the years, they are still the most pragmatic and realistic approach for assessing default risk for your counterparties. Of course, the quality of the assessment depends to a large extent on the quality of the model used to determine the credit rating, capturing both the quantitative and qualitative factors determining counterparty credit risk. A sound credit rating model strikes a balance between these two aspects. Relying too much on quantitative outcomes ignores valuable ‘unstructured’ information, whereas an expert judgement based approach ignores the value of empirical data, and their explanatory power.
In this white paper we will outline some best practice approaches to assessing default risk of a company through a credit rating. We will explore the ratios that are crucial factors in the model and provide guidance for the expert judgement aspects of the model.
Zanders has applied these best practices while designing several Credit Rating models for many years. These models are already being used at over 400 companies and have been tested both in practice and against empirical data. Do you want to know more about our Credit Rating models, click here.
Credit ratings and their applications
Credit ratings are widely used throughout the financial industry, for a variety of applications. This includes the corporate finance, risk and treasury domains and beyond. While it is hardly ever a sole factor driving management decisions, the availability of a point estimation to describe something as complex as counterparty credit risk has proven a very useful piece of information for making informed decisions, without the need for a full due diligence into the books of the counterparty.
Some of the specific use cases are:
- Internal assessment of the creditworthiness of counterparties
- Transparency of the creditworthiness of counterparties
- Monitoring trends in the quality of credit portfolios
- Monitoring concentration risk
- Performance measurement
- Determination of risk-adjusted credit approval levels and frequency of credit reviews
- Formulation of credit policies, risk appetite, collateral policies, etc.
- Loan pricing based on Risk Adjusted Return on Capital (RAROC) and Economic Profit (EP)
- Arm’s length pricing of intercompany transactions, in line with OECD guidelines
- Regulatory Capital (RC) and Economic Capital (EC) calculations
- Expected Credit Loss (ECL) IFRS 9 calculations
- Active Credit Portfolio Management on both portfolio and (individual) counterparty level
Credit rating philosophy
A fundamental starting point when applying credit ratings, is the credit rating philosophy that is followed. In general, two distinct approaches are recognized:
- Through-the-Cycle (TtC) rating systems measure default risk of a counterparty by taking permanent factors, like a full economic cycle, into account based on a worst-case scenario. TtC ratings change only if there is a fundamental change in the counterparty’s situation and outlook. The models employed for the public ratings published by e.g. S&P, Fitch and Moody’s are generally more TtC focused. They tend to assign more weight to qualitative features and incorporate longer trends in the financial ratios, both of which increase stability over time.
- Point-in-Time (PiT) rating systems measure default risk of a counterparty taking current, temporary factors into account. PiT ratings tend to adjust quickly to changes in the (financial) conditions of a counterparty and/or its economic environment. PiT models are more suited for shorter term risk assessments, like Expected Credit Losses. They are more focused on financial ratios, thereby capturing the more dynamic variables. Furthermore, they incorporate a shorter trend which adjusts faster over time. Most models incorporate a blend between the two approaches, acknowledging that both short term and long term effects may impact creditworthiness.
Rating methodology
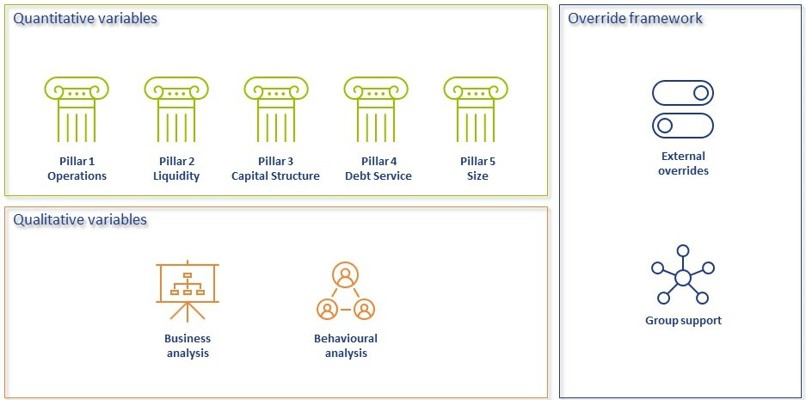
Modeling credit ratings is very complex, due to the wide variety of events and exposures that companies are exposed to. Operational risk, liquidity risk, poor management, a perishing business model, an external negative event, failing governments and technological innovation can all have very significant influence on the creditworthiness of companies in the short and long run. Most credit rating models therefore distinguish a range of different factors that are modelled separately and then combined into a single credit rating. The exact factors will differ per rating model. The overview below presents the factors included the Corporate Rating Model, which is used in some of the cloud-based solutions of the Zanders applications.
The remainder of this article will detail the different factors, explaining the rationale behind including them.
Quantitative factors
Quantitative risk factors are crucial to credit rating models, as they are ‘objective’ and therefore generate a large degree of comparability between different companies. Their objective nature also makes them easier to incorporate in a model on a large scale. While financials alone do not tell the whole story about a company, accounting standards have developed over time to provide a more and more comparable view of the financial state of a company, making them a more and more thrustworthy source for determining creditworthiness. To better enable comparisons of companies with different sizes, financials are often represented as ratios.
Financial Ratios
Financial ratios are being used for credit risk analyses throughout the financial industry and present the basic characteristics of companies. A number of these ratios represent (directly or indirectly) creditworthiness. Zanders’ Corporate Credit Rating model uses the most common of these financial ratios, which can be categorised in five pillars:
Pillar 1 - Operations
The Operations pillar consists of variables that consider the profitability and ability of a company to influence its profitability. Earnings power is a main determinant of the success or failure of a company. It measures the ability of a company to create economic value and the ability to give risk protection to its creditors. Recurrent profitability is a main line of defense against debtor-, market-, operational- and business risk losses.
Turnover Growth
Turnover growth is defined as the annual percentage change in Turnover, expressed as a percentage. It indicates the growth rate of a company. Both very low and very high values tend to indicate low credit quality. For low turnover growth this is clear. High turnover growth can be an indication for a risky business strategy or a start-up company with a business model that has not been tested over time.
Gross Margin
Gross margin is defined as Gross profit divided by Turnover, expressed as a percentage. The gross margin indicates the profitability of a company. It measures how much a company earns, taking into consideration the costs that it incurs for producing its products and/or services. A higher Gross margin implies a lower default probability.
Operating Margin
Operating margin is defined as Earnings before Interest and Taxes (EBIT) divided by Turnover, expressed as a percentage. This ratio indicates the profitability of the company. Operating margin is a measurement of what proportion of a company's revenue is left over after paying for variable costs of production such as wages, raw materials, etc. A healthy Operating margin is required for a company to be able to pay for its fixed costs, such as interest on debt. A higher Operating margin implies a lower default probability.
Return on Sales
Return on sales is defined as P/L for period (Net income) divided by Turnover, expressed as a percentage. Return on sales = P/L for period (Net income) / Turnover x 100%. Return on sales indicates how much profit, net of all expenses, is being produced per pound of sales. Return on sales is also known as net profit margin. A higher Return on sales implies a lower default probability.
Return on Capital Employed
Return on capital employed (ROCE) is defined as Earnings before Interest and Taxes (EBIT) divided by Total assets minus Current liabilities, expressed as a percentage. This ratio indicates how successful management has been in generating profits (before Financing costs) with all of the cash resources provided to them which carry a cost, i.e. equity plus debt. It is a basic measure of the overall performance, combining margins and efficiency in asset utilization. A higher ROCE implies a lower default probability.
Pillar 2 - Liquidity
The Liquidity pillar assesses the ability of a company to become liquid in the short-term. Illiquidity is almost always a direct cause of a failure, while a strong liquidity helps a company to remain sufficiently funded in times of distress. The liquidity pillar consists of variables that consider the ability of a company to convert an asset into cash quickly and without any price discount to meet its obligations.
Current Ratio
Current ratio is defined as Current assets, including Cash and Cash equivalents, divided by Current liabilities, expressed as a number. This ratio is a rough indication of a firm's ability to service its current obligations. Generally, the higher the Current ratio, the greater the cushion between current obligations and a firm's ability to pay them. A stronger ratio reflects a numerical superiority of Current assets over Current liabilities. However, the composition and quality of Current assets are a critical factor in the analysis of an individual firm's liquidity, which is why the current ratio assessment should be considered in conjunction with the overall liquidity assessment. A higher Current ratio implies a lower default probability.
Quick Ratio
The Quick ratio (also known as the Acid test ratio) is defined as Current assets, including Cash and Cash equivalents, minus Stock divided by Current liabilities, expressed as a number. The ratio indicates the degree to which a company's Current liabilities are covered by the most liquid Current assets. It is a refinement of the Current ratio and is a more conservative measure of liquidity. Generally, any value of less than 1 to 1 implies a reciprocal dependency on inventory or other current assets to liquidate short-term debt. A higher Quick ratio implies a lower default probability.
Stock Days
Stock days is defined as the average Stock during the year times the number of days in a year divided by the Cost of goods sold, expressed as a number. This ratio indicates the average length of time that units are in stock. A low ratio is a sign of good liquidity or superior merchandising. A high ratio can be a sign of poor liquidity, possible overstocking, obsolescence, or, in contrast to these negative interpretations, a planned stock build-up in the case of material shortages. A higher Stock days ratio implies a higher default probability.
Debtor Days
Debtor days is defined as the average Debtors during the year times the number of days in a year divided by Turnover. Debtor days indicates the average number of days that trade debtors are outstanding. Generally, the greater number of days outstanding, the greater the probability of delinquencies in trade debtors and the more cash resources are absorbed. If a company's debtors appear to be turning slower than the industry, further research is needed and the quality of the debtors should be examined closely. A higher Debtors days ratio implies a higher default probability.
Creditor Days
Creditor days is defined as the average Creditors during the year as a fraction of the Cost of goods sold times the number of days in a year. It indicates the average length of time the company's trade debt is outstanding. If a company's Creditors days appear to be turning more slowly than the industry, then the company may be experiencing cash shortages, disputing invoices with suppliers, enjoying extended terms, or deliberately expanding its trade credit. The ratio comparison of company to industry suggests the existence of these or other causes. A higher Creditors days ratio implies a higher default probability.
Pillar 3 - Capital Structure
The Capital pillar considers how a company is financed. Capital should be sufficient to cover expected and unexpected losses. Strong capital levels provide management with financial flexibility to take advantage of certain acquisition opportunities or allow discontinuation of business lines with associated write offs.
Gearing
Gearing is defined as Total debt divided by Tangible net worth, expressed as a percentage. It indicates the company’s reliance on (often expensive) interest bearing debt. In smaller companies, it also highlights the owners' stake in the business relative to the banks. A higher Gearing ratio implies a higher default probability.
Solvency
Solvency is defined as Tangible net worth (Shareholder funds – Intangibles) divided by Total assets – Intangibles, expressed as a percentage. It indicates the financial leverage of a company, i.e. it measures how much a company is relying on creditors to fund assets. The lower the ratio, the greater the financial risk. The amount of risk considered acceptable for a company depends on the nature of the business and the skills of its management, the liquidity of the assets and speed of the asset conversion cycle, and the stability of revenues and cash flows. A higher Solvency ratio implies a lower default probability.
Pillar 4 - Debt Service
The debt service pillar considers the capability of a company to meet its financial obligations in the form of debt. It ties the debt obligation a company has to its earnings potential.
Total Debt / EBITDA
The debt service pillar considers the capability of a company to meet its financial obligations. This ratio is defined as Total debt divided by Earnings before Interest, Taxes, Depreciation, and Amortization (EBITDA). Total debt comprises Loans + Noncurrent liabilities. It indicates the total debt run-off period by showing the number of years it would take to repay all of the company's interest-bearing debt from operating profit adjusted for Depreciation and Amortization. However, EBITDA should not, of course, be considered as cash available to pay off debt. A higher Debt service ratio implies a higher default probability.
Interest Coverage Ratio
Interest coverage ratio is defined as Earnings before interest and taxes (EBIT) divided by interest expenses (Gross and Capitalized). It indicates the firm's ability to meet interest payments from earnings. A high ratio indicates that the borrower should have little difficulty in meeting the interest obligations of loans. This ratio also serves as an indicator of a firm's ability to service current debt and its capacity for taking on additional debt. A higher Interest coverage ratio implies a lower default probability.
Pillar 5 - Size
In general, the larger a company is, the less vulnerable the company is, as there is, usually, more diversification in turnover. Turnover is considered the best indicator of size. In general, turnover is related to vulnerability. The higher the turnover, the less vulnerable a company (generally) is.
Ratio Scoring and Mapping
While these financial ratios provide some very useful information regarding the current state of a company, it is difficult to assess them on a stand-alone basis. They are only useful in a credit rating determination if we can compare them to the same ratios for a group of peers. Ratio scoring deals with the process of translating the financials to a score that gives an indication of the relative creditworthiness of a company against its peers.
The ratios are assessed against a peer group of companies. This provides more discriminatory power during the calibration process and hence a better estimation of the risk that a company will default. Research has shown that there are two factors that are most fundamental when determining a comparable peer group. These two factors are industry type and size. The financial ratios tend to behave ‘most alike’ within these segmentations. The industry type is a good way to separate, for example, companies with a lot of tangible assets on their balance sheet (e.g. retail) versus companies with very few tangible assets (e.g. service based industries). The size reflects that larger companies are generally more robust and less likely to default in the short to medium term, as compared to smaller, less mature companies.
Since ratios tend to behave differently over different industries and sizes, the ratio value score has to be calibrated for each peer group segment.
When scoring a ratio, both the latest value and the long-term trend should be taken into account. The trend reflects whether a company’s financials are improving or deteriorating over time, which may be an indication of their long-term perspective. Hence, trends are also taken into account as a separate factor in the scoring function.
To arrive to a total score, a set of weights needs to be determined, which indicates the relative importance of the different components. This total score is then mapped to a ordinal rating scale, which usually runs from AAA (excellent creditworthiness) to D (defaulted) to indicate the creditworthiness. Note that at this stage, the rating only incorporates the quantitative factors. It will serve as a starting point to include the qualitative factors and the overrides.
"A sound credit rating model strikes a balance between quantitative and qualitative aspects. Relying too much on quantitative outcomes ignores valuable ‘unstructured’ information, whereas an expert judgement based approach ignores the value of empirical data, and their explanatory power."
Qualitative Factors
Qualitative factors are crucial to include in the model. They capture the ‘softer’ criteria underlying creditworthiness. They relate, among others, to the track record, management capabilities, accounting standards and access to capital of a company. These can be hard to capture in concrete criteria, and they will differ between different credit rating models.
Note that due to their qualitative nature, these factors will rely more on expert opinion and industry insights. Furthermore, some of these factors will affect larger companies more than smaller companies and vice versa. In larger companies, management structures are far more complex, track records will tend to be more extensive and access to capital is a more prominent consideration.
All factors are generally assigned an ordinal scoring scale and relative weights, to arrive at a total score for the qualitative part of the assessment.
A categorisation can be made between business analysis and behavioural analysis.
Business Analysis
Business analysis deals with all aspects of a company that relate to the way they operate in the markets. Some of the factors that can be included in a credit rating model are the following:
Years in Same Business
Companies that have operated in the same line of business for a prolonged period of time have increased credibility of staying around for the foreseeable future. Their business model is sound enough to generate stable financials.
Customer Risk
Customer risk is an assessment to what extent a company is dependent on one or a small group of customers for their turnover. A large customer taking its business to a competitor can have a significant impact on such a company.
Accounting Risk
The companies internal accounting standards are generally a good indicator of the quality of management and internal controls. Recent or frequent incidents, delayed annual reports and a lack of detail are clear red flags.
Track record with Corporate
This is mostly relevant for counterparties with whom a standing relationship exists. The track record of previous years is useful first hand experience to take into account when assessing the creditworthiness.
Continuity of Management
A company that has been under the same management for an extended period of time tends to reflect a stable company, with few internal struggles. Furthermore, this reflects a positive assessment of management by the shareholders.
Operating Activities Area
Companies operating on a global scale are generally more diversified and therefore less affected by most political and regulatory risks. This reflects well in their credit rating. Additionally, companies that serve a large market have a solid base that provides some security against adverse events.
Access to Capital
Access to capital is a crucial element of the qualitative assessment. Companies with a good access to the capital markets can raise debt and equity as needed. An actively traded stock, a public rating and frequent and recent debt issuances are all signals that a company has access to capital.
Behavioral Analysis
Behavioural analysis aims to incorporate prior behaviour of a company in the credit rating. A separation can be made between external and internal indicators
External indicators
External indicators are all information that can be acquired from external parties, relating to the behaviour of a company where it comes to honouring obligations. This could be a credit rapport from a credit rating agency, payment details from a bank, public news items, etcetera.
Internal Indicators
Internal indicators concern all prior interactions you have had with a company. This includes payment delay, litigation, breaches of financial covenants etcetera.
Override Framework
Many models allow for an override of the credit rating resulting from the prior analysis. This is a more discretionary step, which should be properly substantiated and documented. Overrides generally only allow for adjusting the credit rating with one notch upward, while downward adjustment can be more sizable.
Overrides can be made due to a variety of reasons, which is generally carefully separated in the model. Reasons for overrides generally include adjusting for country risk, industry adjustments, company specific risk and group support.
It should be noted that some overrides are mandated by governing bodies. As an example, the OECD prescribes the overrides to be applied based on a country risk mapping table, for the purpose of arm’s length pricing of intercompany contracts.
Combining all the factors and considerations mentioned in this article, applying weights and scoring functions and applying overrides, a final credit rating results.
Model Quality and Fit
The model quality determines whether the model is appropriate to be used in a practical setting. From a statistical modeling perspective, a lot of considerations can be made with regard to model quality, which are outside of the scope of this article, so we will stick to a high level consideration here.
The AUC (area under the ROC curve) metric is one of the most popular metrics to quantify the model fit (note this is not necessarily the same as the model quality, just as correlation does not equal causation). The AUC metric indicates, very simply put, the number of correct and incorrect predictions and plots them in a graph. The area under that graph then indicates the explanatory power of the model. A more extensive guide to the AUC metric can be found here.
Alternative Modeling Approaches
The model structure described above is one specific way to model credit ratings. While models may widely vary, most of these components would typically be included. During recent years, there has been an increase in the use of payment data, which is disclosed through the PSD2 regulation. This can provide a more up-to-date overview of the state of the company and can definitely be considered as an additional factor in the analysis. However, the main disadvantage of this approach is that it requires explicit approval from the counterparty to use the data, which makes it more challenging to apply on a portfolio basis.
Another approach is a purely machine learning based modeling approach. If applied well, this will give the best model in terms of the AUC (area under the curve) metric, which measures the explanatory power of the model. One major disadvantage of this approach, however, is that the interpretability of the resulting model is very limited. This is something that is generally not preferred by auditors and regulatory bodies as the primary model for creditworthiness. In practice, we see these models most often as challenger models, to benchmark the explanatory power of models based on economic rationale. They can serve to spot deficiencies in the explanatory power of existing models and trigger a re-assessment of the factors included in these models. In some cases, they may also be used to create additional comfort regarding the inclusion of some factors.
Furthermore, the degree to which the model depends on expert opinion is to a large extent dependent on the data available to the model developer. Most notably, the financials and historical default data of a representative group of companies is needed to properly fit the model to the empirical data. Since this data can be hard to come by, many credit rating models are based more on expert opinion than actual quantitative data. Our Corporate Credit Rating model was calibrated on a database containing the financials and default data of an extensive set of companies. This provides a solid quantitative basis for the model outcomes.
Closing Remarks
Model credit risk and credit ratings is a complex affair. Zanders provides advice, standardized and customizable models and software solutions to tackle these challenges. Do you want to learn more about credit rating modeling? Reach out for a free consultation. Looking for a tailor made and flexible solution to become IFRS 9 compliant, find out about our Condor Credit Risk Suite, the IFRS9 compliance solution.


The European Central Bank (ECB) recently completed another important step in the supervisory process to assess the management of climate-related and environmental (C&E) risks by European banks. On 2 November, they published the results of their thematic review on C&E risks performed earlier this year.
This review1 followed the initial publication of expectations on C&E risks in their November 2020 Guide on C&E risks (the Guide)2 and the self-assessment performed by European banks in 2021 on the ECB’s request. The scope of the thematic review included 186 banks with a total balance sheet size of EUR 25 trillion: 107 significant institutions (SIs) supervised by the ECB and 79 less significant institutions (LSIs) supervised by national competent authorities.
In this article, we provide an overview of the main conclusions of the thematic review and of the main focus areas related to the management of C&E risk for banks that we expect for 2023.
Main results
The thematic review shows that European banks have progressed with the integration of C&E risks into their business strategy, governance, and risk management frameworks. This matters, because the review shows that C&E risks are real. Depending on the time horizon, 70% to 80% of all banks consider C&E risks to be material for their portfolios. About 75% of all banks expect material impacts on their credit risk. To a lesser extent, material impacts are expected on strategic and reputational risks (about 50%), and on market and liquidity risks (about 25%). In the short term, banks are most concerned with transition risks, while the relevance of physical risks is clearly increasing with the time horizon.
The ECB concludes, however, that the management of C&E risks still is on a relatively basic and general level. For example, banks have updated their governance, assigning responsibility for the management of C&E risks to the Management Board. Many have also set up dedicated committees for these risk types and/or assigned responsibility within the organisation in other ways. Further, over 90% of all banks have at least performed a basic risk identification and materiality assessment to understand how their portfolios are exposed to C&E risks. In many cases, this has led to the introduction of Key Performance Indicators (KPIs) and Key Risk Indicators (KRIs), and the (often qualitative) integration of C&E risks into their business strategy and Internal Capital Adequacy Assessment Process (ICAAP).
According to the ECB, the work performed so far is not sufficient though. The ECB observes gaps in the risk identification and materiality assessment at almost all banks. In 60% of the cases, these are deemed major. Of all banks, 10% is yet to start with this process. Improvements are also required with respect to data collection. Only a small selection of banks (about 15%) is systematically collecting data that is sufficiently granular and forward-looking to support processes like risk identification, stress testing and reporting. In most cases, banks rely to a large extent on the use of proxies.
Even if banks have progressed well with the identification of C&E risks, the ECB concludes that this awareness has not been translated effectively into policies and targets by more than half of the banks. The high-level KPIs and KRIs for example, are not cascaded down to business lines or individual portfolios, non-restrictive targets are set, or relevant counterparties are excluded from a policy’s scope. Furthermore, the ECB finds that banks are significantly underestimating the level of skilled resources required for a proper management of C&E risks.
The ECB has set deadlines tailored to each bank that they supervise. As part of the publication of the results of the thematic review, however, they shared the minimum milestones European banks need to adhere to:
- By the end of March 2023, banks need to have a sound and comprehensive materiality assessment in place, including a robust scanning of the business environment.
- By the end of 2023, banks need to manage C&E risks with an institution-wide approach covering business strategy, governance and risk appetite, as well as risk management, including credit, operational, market and liquidity risk management.
- By the end of 2024, banks need to be fully aligned with all supervisory expectations, including having in place a sound integration of C&E risks in their stress testing framework and ICAAP.
Focus areas 2023
Based on the results of the ECB’s thematic review and our conversations with clients, we see five focus areas related to the management of C&E risks for banks in 2023.
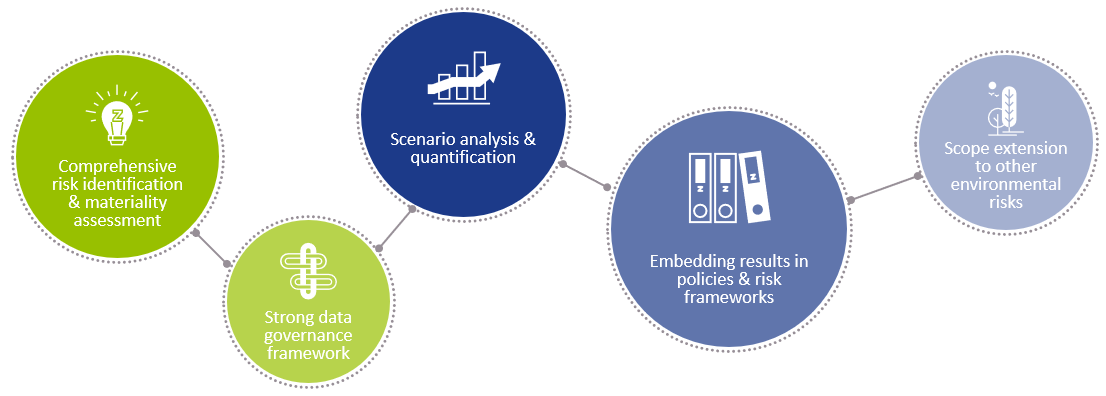
- Comprehensive risk identification and materiality assessment: The ECB is clear about its expectations that banks should complete their risk identification and materiality assessment in the first quarter of 2023. More importantly, they expect this process to be comprehensive. For a start, a bank should assess all its material business lines (or portfolios) and cover all relevant regions and geographies the bank is active in. A step-wise approach can be used, as long as the full scope is covered in the end. Further, the analysis should cover a wide range of physical and transition risks. It is not sufficient to investigate the impact of a limited set of risk factors. Finally, the analysis needs to be performed for different time horizons: the short, medium, and long term.
- Strong data governance framework: To take the next step in the management of C&E risks, a robust and structured process to collect data is required. For the analyses performed by banks so far, it may have sufficed to extensively use proxies. More is needed, however, to fully meet the expectations described in the ECB’s Guide. Data needs to be collected on a granular level: to be able to properly measure and report on C&E risks, banks need to understand the risks on counterparty, facility, and/or asset level. A first step would be to compile a complete overview of the bank’s data requirements. A bank would need to synthesize all data requirements stemming from processes like risk identification, credit granting, risk modeling, and disclosure to ensure a sufficiently granular (and future-proof) data collection process is designed. Such a process will have to source data from internal systems, but also from a bank’s counterparties and most likely external data vendors. A structured approach exploits potential overlapping data requirements and prevents inconsistencies in definitions.
- Scenario analysis and quantification: With improved data comes the possibility to perform more sophisticated scenario analysis and to quantify C&E risks. About a quarter of all banks are already employing advanced and/or forward-looking quantification methods; for example to inform the ICAAP, to perform scenario analysis, or to reflect C&E risks into internal ratings-based (PD and LGD) models. Most banks expect that it will take one to three years to truly advance in this area. In 2023, however, banks should already focus on improving their scenario analysis (and stress testing) capabilities, and take the first steps towards integrating C&E risks into their credit risk modeling.
- Embedding results into policies and risk management frameworks: In 2023, banks will need to “walk the talk”, to paraphrase the ECB. The improved understanding of how physical and transitions risks may impact the risk profile of the bank needs to be translated into actionable policies and become part of the risk management framework. Overall targets need to align with scientific pathways, high-level Risk Appetite Statements on C&E risks need to be cascaded down to the lower business line levels, controls need to be implemented accordingly, product offerings need to be reviewed, and a dialogue with clients needs to be initiated – including clear steps if and how a bank will continue the relationship if the client’s transition is not meeting expectations.
- Scope extension to other environmental risks: Attention from banks and supervisors alike has mostly focussed on climate risks so far. Other environmental risks, like loss of biodiversity, pollution and water scarcity have received less attention. Now that some progress has been achieved in the area of climate risk, banks should increase efforts for these other risk types. Initiatives like the Partnership for Biodiversity Accounting Financials (PBAF, a sister-initiative of PCAF, which is focussed on financed emissions) and the Taskforce on Nature-related Financial Disclosures (TNFD) can be useful to progress with this.
Since the management of C&E risks is a new field of expertise, many banks are (re)inventing the wheel. Much can be learned from other banks though. To facilitate this, the ECB published, together with the results of the thematic review, an overview of good practices they observed among SIs3. This document can be a useful source of inspiration for banks. De Nederlandsche Bank (DNB, the Dutch central bank) published a similar document, based on their observations among Dutch LSIs4.
Conclusion
Banks have worked hard in 2022 to advance their management of C&E risks. Much work remains, however. With the clear milestones communicated by the ECB, banks have their work cut out for them. And this is not a voluntary effort, as the 30 institutions where the ECB imposed binding qualitative requirements as part of the Supervisory Review and Evaluation Process (SREP) know. For some, supervisory exercises were even reflected in SREP scores, impacting their Pillar 2 capital requirements.
To achieve sufficient progress, we believe that banks should focus on the five areas described in the previous section: risk identification, data collection, scenario analysis and quantification, integration of C&E risks into policies and risk frameworks, and a scope extension to broader environmental risks. By combining our extensive experience with the ‘classical’ risk types with our track record on C&E risks, Zanders is well-positioned to support your organization.
References
1) ECB – Walking the talk – Banks gearing up to manage risks from climate change and environmental degradation – link
2) ECB – Guide on climate-related and environmental risks – Supervisory expectations relating to risk management and disclosure – link
3) ECB – Good practices for climate-related and environmental risk management – Observations from the 2022 thematic review – link
4) DNB – Guide to managing climate and environmental risks – link

Are you overwhelmed by the sheer volume of different Treasury Technology Systems on the market?
Do you have difficulties setting out your treasury technology requirements (both from a functional as well as IT perspective), or matching those to the latest capabilities of a modern Treasury Systems? Are you wishing for a technology selection process that is less cumbersome and time consuming? If you said ‘yes’ to any of these, then we might have the solution for you!
Introducing Zanders’ Treasury Technology Selection Service powered by Tech-Select, our proprietary cloud-based Treasury Technology Selection tool designed to give you an easier, quicker way to select a new treasury system that best supportis your specific needs, or to evaluate your current system against other alternatives. For over 30 years, Zanders has been helping organizations globally to select treasury management systems and other related treasury technology. As an independent and unbiased expert, we have built extensive experience into how best to assist our clients to select, implement and deploy the most appropriate solution for their technology needs – it is this insight that drove us to develop a system to modernize the commonly used RfP process.
Zanders Tech-Select is the driving force behind our Treasury Technology Selection Service and accelerates your treasury system selection project by addressing the traditional challenges faced by organizations when choosing treasury technology solutions and introduces several other benefits as follows:
- Provides a broad overview of the systems market, giving you access to a wider range of potential vendors that can provide systems supporting your needs, and the most up-to-date insights on their current capabilities and new product developments
- Allows you to easily identify and define your functional needs, short-list suitable vendors, and automatically create and issue your RfP, by providing access to our comprehensive library of functional and technical requirements alongside our curated database of vendors, system functionality and capabilities
- Facilitates and accelerates multi-user assessment and evaluation of vendor responses, by utilizing workflows for scoring, the ability to assess user scoring differences, and the opportunity to determine final scores for each vendor
- Helps you to understand key differentiators between services and functionality on offer from each vendor, using our pre-defined results analytics and drilldowns
- Helps to streamline and accelerate the RfP process from end-to-end within a single cloud-based platform, removing the need for multiple emails, spreadsheets or complex scoring models, and
- Reduces the resource and time investment required to engage with multiple vendors, freeing you to focus on key analysis and value-add activities
Let’s take a deeper look at how Zanders Tech-Select achieves this:
- Once you’ve chosen from Zanders Tech-Select’s comprehensive library of functional and technical requirements, these are matched to our curated database of system functionality and capabilities in order to present you with a shortlist of systems and vendors that are suited to your specific needs. You can then select which of those vendors you would like to invite for your RfP process, utilise our templates to create cover letters and other attachments, and specify deadlines for acknowledgement, Q&As and final responses.
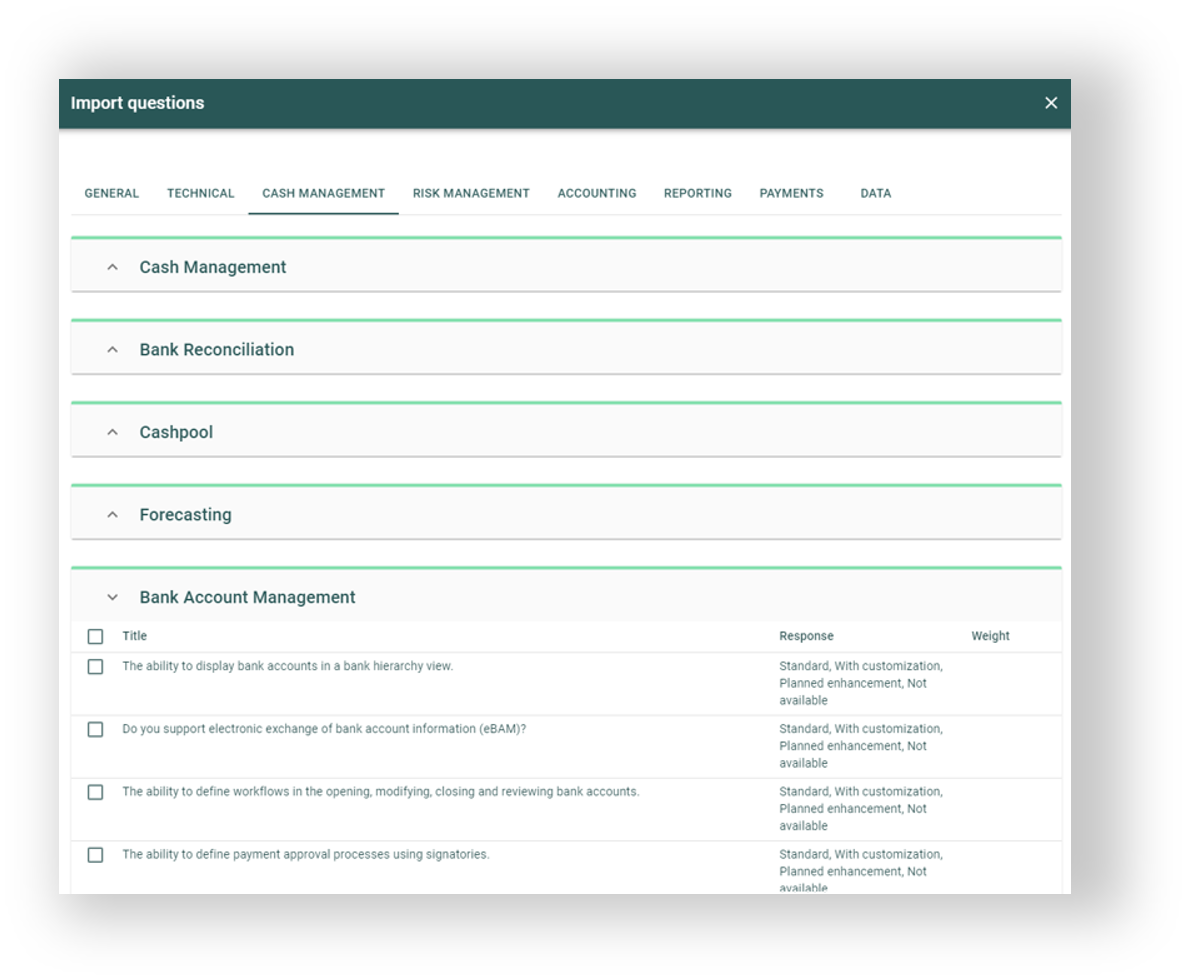
- When you are ready to launch your RfP, you simply click the ‘Issue’ button to automatically generate RfP invite emails quickly and easily to all chosen vendors. Once they receive the invite, vendors can use Zanders Tech-Select to access all document attachments, view your requirements, ask any questions, and respond to the RfP.

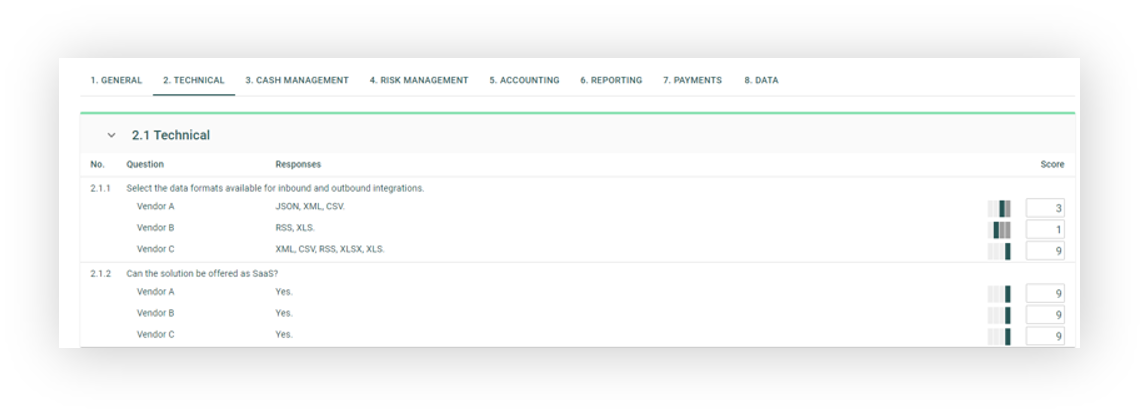
- Once vendors have completed submitting their RfP responses, multiple users from your treasury, finance, IT and procurement teams can use Zanders Tech-Select to independently compare each vendor’s responses to each requirement in a consolidated view, and can assign scores to each. When all users have completed their scoring, the system automatically consolidates their scores and provides you with the opportunity to review and moderate the final scores before moving forwards to analyze the results.
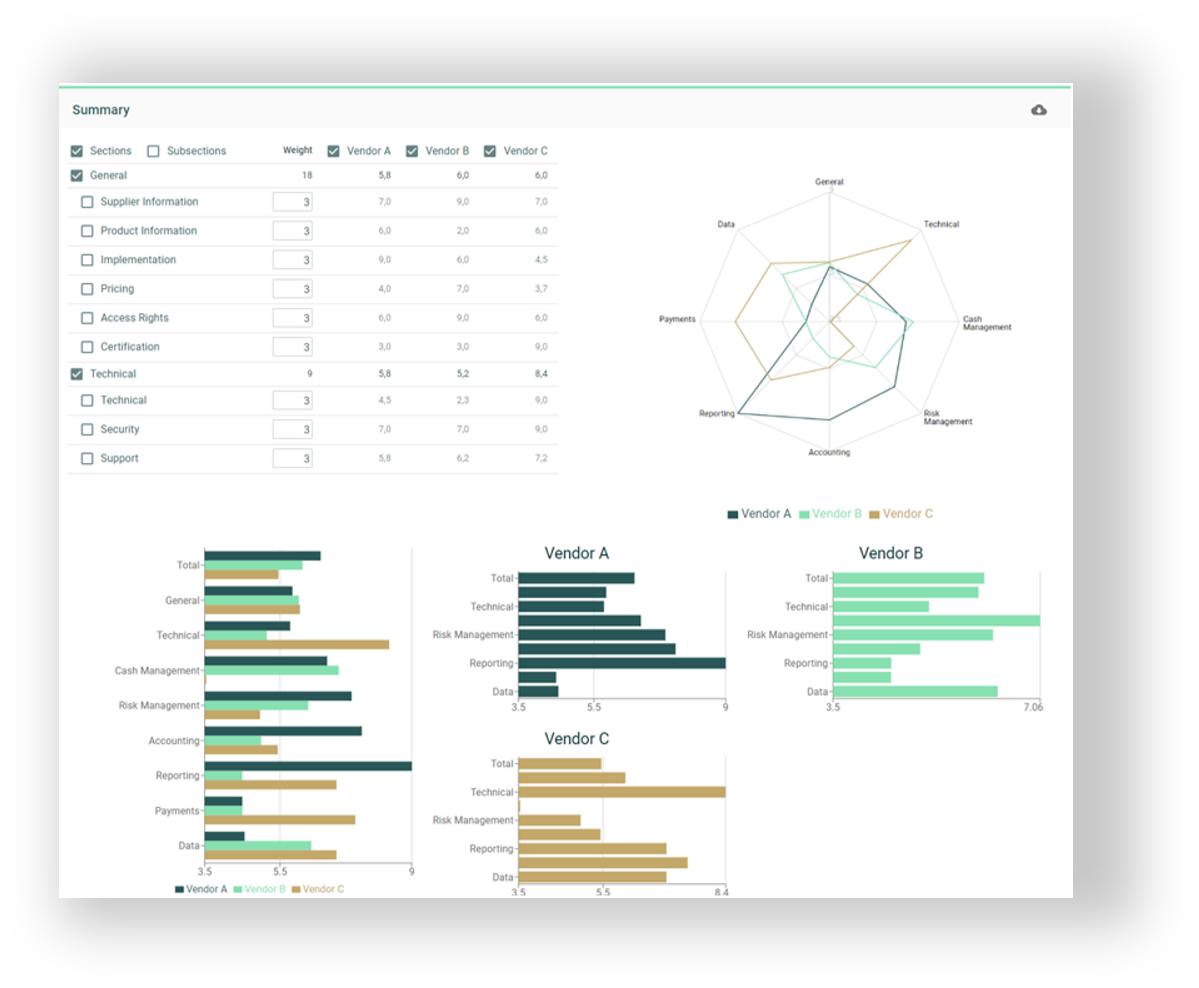
- At the final stage, Zanders Tech-Select’s interactive results analytics provide you with several ways to view and drill down into your results. Simply hover over data points to see more detailed information, check or uncheck to include or exclude vendors, sections and subsections, or most importantly click on specific scores to drilldown and quickly understand the reasons behind any scoring differences between vendors.
Based on experience from our clients, Zanders’ Treasury Technology Selection Service powered by Tech-Select drastically improves the current RfP processes many corporates are using today.
Zanders is unique in offering a system selection solution that includes an extensive library of the most common technology requirements alongside pre-populated and curated responses from over 90% of the leading treasury systems currently on the market. The structured, end-to-end process helps to streamline and automate your selection project and is applicable to a wide variety of use cases, enabling a consistent approach to vendor selection based on objective and rigorous evaluation.
Zanders Tech-Select uniquely provides the most efficient, thorough and cost-effective digital selection service within the treasury space, with Zanders experts to guide you throughout. If you would like to find out more about how Zanders can help to streamline your next technology or service selection process, get in touch now.
Article updated in May 2024


With year-end approaching quickly it is a natural moment to look back, zoom-out a bit and look forward to the coming year(s). Last year was, for most treasurers, a bumpy road. We witnessed another year with uncertainty and volatility in the financial markets due to the residual effects of the pandemic; the impact of the War in Ukraine; and rising inflation, interest rates and commodity prices. In this context, Corporate Treasuries are continuously facing internal and external challenges, and therefore need to operate in an increasingly complex and uncertain environment. Based on these challenges, we have identified four main Treasury themes for the year 2023 which are interlinked with each other and will be addressed in more detail in this article:
- Digital Treasury
- Fit for Future Treasury Teams
- Financial Resilience
- Increasing Treasury remit
Digital Treasury
Implementing and deploying fit-for-purpose technology in the Treasury function continues to be one of the main themes for Treasurers. The importance of embracing technology, with the aim to become a Digital Treasury function, stems from both internal and external drivers. Due to the strategic position of Treasury within the broader Finance function, different factors (like new regulations, volatility in financial markets, political decision making and economic instability, et cetera) lead to a broader and more complex remit. At the same time, treasurers are expected to implement cost reduction programs while simultaneously facing increasing performance requirements, and the expectation to present accurate and real-time transparency on liquidity, cash flows and exposures. Technology is the key enabler for a future proof value adding Treasury organization including to effectively manage the change in Treasury’s traditional tasks (e.g. requirement for real-time liquidity and exposure data) as well as new tasks (e.g. include ESG Financing, broader working capital responsibility or new B2C payment methods).
A Digital Treasury or Treasury 4.0 as it is often called is defined by certain characteristics:
- Treasury Target Operating Model which is ‘fit for purpose’, this means a formalized governance structure and mandate for the Treasury function in combination with the organizational structure in which ‘virtual’ centralization is achieved by means of technology.
- Fully integrated and automated Treasury operations to reach the highest degree of Straight Through Processing (STP) were possible, which effectively leads to a Manage by Exception (MBE) structure.
- Utilize exponential technology in a standardized way with a clear focus on the additional benefits of this new technology. Deploying exponential technology, like blockchain, AI, robotics, et cetera, should be a means to an end and not a goal in itself for Treasury.
- Enable a ‘Real-time’ Treasury by having real-time data available, process payments on a real-time basis and have access to real-time liquidity.
- Build a resilient Treasury framework of both governance, methodology and technology components to allow Treasury reacting to different scenarios and to anticipate them.
- Shift focus on the full financial supply chain and working capital management by expanding process design and data flow beyond the core Treasury activities.
By embedding Treasury into the financial supply chain regarding processes and data it enables Treasury to work in multiple unforeseen scenarios and make informed decisions based on analytics. When we talk about Treasury data and analytics the “ABCD of Digital Treasury” is paramount, which are:
- Artificial Intelligence (AI) & Application Programming interfaces (APIs)
- Blockchain & distributed ledger technology
- Cloud computing
- Data & advanced data analytics.
As part of the Treasury transformation towards a Digital Treasury, there should be a clear focus on deliverables and output to ensure these are fully aligned with CFO and other business partners expectations. Given the trend of increased focus on performance, it is key to utilize the power of technology which enable Treasury to elevate the quality of deliverables and output. For example, AI can be used to adjust forecasted cash flows based upon the historical patterns behind actuals and forecast variances as well as assisting in decision making in the area of foreign exchange risk or commodity price risk management.
The concept of real-time Treasury has become one of the hottest topics in Treasury over the last few years. The availability of real-time data, payments and liquidity can take away many inefficiencies in Treasury’s day-to-day operations. Thanks to growing adoption of exponential technologies such as APIs and Blockchain, Treasury teams can access external real-time data in a speedy and precise manner. Being able to obtain data from all relevant sources in real-time reduces the manual work, decreases the possibility of errors, and improves the decision-making capabilities of Treasury teams. Rather than having to wait and be constraint by bank cut-off times and end of day processing, Treasury teams can operate more efficiently by achieving actual real-time visibility from faster payments to settlements.
In the pursuit of a better payment system, real-time payments have been evolving and creating a safer, more efficient, and accessible environment. Numerous countries have been creating new payment rails and upgrading their infrastructure to support secure real-time payments. We are seeing blockchain technology challenging the existing payment solutions such as SWIFT to enable real-time payments with extended data and enhanced tracking and tracing at a lower cost.
Real-time payments give rise to the need of real-time liquidity. Banks might offer a solution that enables to leverage liquidity across multiple accounts (without the need to have intraday limits). So, if a bank account requires liquidity to make payments, the bank will look across other bank accounts to check whether other liquidity can be used to cover the payment need.
Enabling the ‘Real-time’ requires Treasury to have a resilient and automated technology landscape. Identifying the requirements and then selecting the technology provider(s is the key component to automated ‘real-time’ functionalities.
Fit for Future Treasury Teams
The most crucial asset of any Treasury organisation is its people. Building a Treasury team that can (a) quickly adapt to new circumstances, (b) understand the added value of the Treasury function for the business, and (c) leverage the use of technology, is a key differentiator when it comes to Treasury. The ability of an organisation to successfully deploy technology stems from aligning three interlinked forces:
- Translating business requirements into functional technology requirements;
- Understanding full capabilities of the new technology;
- Availability and development of functional, technical and change management skills within the team to drive successful implementation of new processes and activities.
Training, retaining the talent and maximizing the business partnering skills is the key to create a fit for future Treasury team. In the recent years, we observe many organisations struggle with building a high-quality talent pipeline and lack of succession planning when it comes to their Treasury functions. This combined with the widening ‘skill gaps’ created by the digitisation of Treasury, puts organisations in a very challenging position. For 2023, we expect companies to focus on developing and managing talent of individuals with digital acumen, ability to interpret data, and ability make forward-looking decisions. This can be done via training and upskilling of current staff, the revision of strategic positions to diminish key-person risk, implementing a broader finance rotation program in which technology plays a central role and lastly entering into strategic partnerships with external expertise and resource partners.
Financial Resilience
Financial Resilience is the ability of an organization to financially withstand and recover from diverse types of unexpected events, for example, external shocks. Coping with financial shocks means, for a Treasury, to have the analytical skills to devise both short-term and long-term strategies to measure and manage the impact of external shocks on the financial side of the organization. Financial resilience requires strategically planning ahead and putting preventive strategies in place, including amongst others detailed analysis of corporate finance strategies, pro-actively creating access to funding sources, and defining alternative risk transfer strategies.
After many years of low interest rates and inflation, treasurers had not to worry too much about interest rate risks (except for the negative yields on their investments). Given the recent interest rate increases by the central banks and the expectation that central banks will further increase interest rates to combat the high inflationary market, interest rate risk is back on the agenda for Treasurers! Treasurers should not only analyse the direct impact of increasing interest rates on the financial expense line, but should also consider how the increasing interest rates, in combination with the increasing commodity prices and volatile FX market impact the full supply chain. There are many (Zombie) companies out there which are on the brink of collapse given the current volatile financial markets in combination with ending government COVID-19 support programs. It is vital for a company to have a clear view on its risk bearing capacity; to which extent is the company able to absorb financial headwinds like increased interest rates, adverse movements in commodity and FX rates and potential defaults of key suppliers and/or customers. Traditional risk management measurement techniques, which consider the linear impact of a change in a single risk factor to a single line item in the financial statements (e.g. financial results), are not suitable in an environment of complexity and uncertainty. Treasurers should upskill their financial risk management practice by challenging the assumptions used in current measurement techniques, like scenario analysis. For example, it was not expected and not in line with economic theory that real interest rates would move below zero, which contradicts the current market conditions of high inflation rates accompanied with disproportionate increases in the nominal interest rate. As guardians of the company’s financial risks, Treasurers should expect the unexpected!
Increasing Treasury remit
Given the critical role of Treasury within an organization, we have already seen (for many years) an increase in the Treasury remit. As strategic partner to the CFO and the business, Treasury’s skills are leveraged for more and more activities. To continue the financial resilience trend, working capital management is a key example of Treasury’s increasing remit in many organizations, which stems from the risk capabilities within Treasury. Treasury is not only involved in securing that the company is resilient for financial market movements but is also acting as a business partner for both procurement and the commercial team to analyse how the full supply chain can be made more resilient. Potential hiccups in the physical supply chain as well as the impact of defaulting suppliers or customers can have a detrimental effect on working capital. Many treasuries have an increased focus on working capital management and evaluate how strategic and critical customers and suppliers can be supported via supply chain finance programs to strengthen the supply chain and thereby the position of the company.
Another key trend which is increasing the remit of Treasury, is the movement towards Environmental, Social and Governance (ESG) proof organizations. Treasurers are the trailblazers in sustainable funding and now need to work with accounting and ESG teams for the necessary reporting. Impact can also be expected in the banking relationship. The European Central Bank (ECB) and European Banking Authority (EBA) are rapidly increasing the pressure on banks to integrate ESG risks into their risk frameworks. For example, the ECB published their expectations with respect to the management of climate-related and environmental risks in 2020 and they are now requiring banks to achieve full compliance by the end of 2024. Among others, banks need to assess to what extent their counterparties are exposed to physical (e.g. floods and droughts) or transition risks (e.g. changes in regulation or consumer sentiment). These factors then need to be integrated in the loan origination process. Apart from the potential impact on the pricing of loans and facilities, corporates can also expect a more data-intensive process. Detailed data on emissions and the geographical location of production facilities may be requested.
Conclusion
To conclude, 2023 is expected to be another exciting year for Treasury professionals! The combination of the expanding Treasury remit, challenging labour market and continuing uncertainties in financial and geopolitical markets give rise to create clear and actionable analysis and advice towards the CFO and other business partners. The transformation towards a Digital Treasury is the path which enables Treasury to deliver in an environment which is increasingly focusing on performance while at the same time becoming more complex. We are optimistic for the future and look forward to collaborating with many of you on this exciting journey! For now, Zanders would like to wish you wonderful holidays with friends and family and a great start of the new year!


The recent decade has brought notable developments in both ERP and treasury management system (TMS) markets.
On one hand, the trend towards ERP system consolidation has progressed, most companies have centralized all their global entities and processes in a single environment with unique master data. At the same time, the trend towards cloud solutions has brought innovation and increased competition also to the TMS area. In this context, we are often asked: should the treasury function follow into the centralized ERP solution as well, or does a separate TMS instance have its justification?
Nowadays, all established TMS solutions are also available in the cloud or have disappeared from the market. The cloud technology brings disruption to the TMS market – high scalability of the cloud solutions has brought a number of new players to the global market – originally regional leaders seek to expand their footprint in other regions, some of them challenging the traditional market leaders. Established cloud TMS providers expand their functional covering in a very high pace and at relatively low marginal costs, which leads to increased competition in both functional capabilities and pricing.
In the segment of companies with more than USD 1 billion revenue, SAP occupies a special position among both ERP and TMS vendors (see numbers here) – it offers both a leading ERP system and a TMS with very broad functional coverage.
Benefit areas
In what areas can you find the benefits from integrating the TMS into ERP? We list them for you.
- Process integration
Treasury is usually involved closely in the following three cross-functional processes, with the following implications:
(a) Cash management
Short- and mid-term cash forecast reflects accounts payable and accounts receivable, but purchase and sales orders can also be used to enrich the report. Even when commercial accounts are cash-pooled to treasury accounts, expected movements on these accounts can be used to plan cash pool movements on treasury accounts.
(b) Payments
Various levels of integration can be found among the companies. While some leave execution of commercial payments locally, others implement payments factories to warehouse all types of payments centrally. Screening against payment frauds and sanction breach is facilitated with centralized payment flow. Centralized, well-maintained bank master used at payment origination helps to avoid the risk of declined payments.
(c) Exposure hedging
FX and commodity hedging activities are usually centralized with the treasury team.
In case FX or commodity exposure arises from individual purchase and sales orders or contracts, the treasury team needs tools to be directly involved in the exposure identification and hedge effectiveness controlling.
- System integration
Streamlined processes described above have implications for the required system integration. Depending on frequency and criticality of the data flows, different integration approaches can be considered.
All TMS on the market support file integration with the ERP systems in a reasonable way. They are also often very strong in supporting API integration with trading platforms and bank connectivity providers, but usually lag behind in API integration with the ERPs. Claims of available API integration need to be always critically reviewed on their maturity. API integration is preferred.
What are the benefits of API-based integration?
- It offers real-time process integration between the systems and empowers treasury to be tightly integrated in the cross-functional processes. It can be important when intraday cash positions are followed, payments are executed daily or exposure needs to be hedged continuously.
- It keeps the data flow responsibility with the users. Interfaces often fail because of master data are not aligned between the participating systems. If message cannot be delivered because of this reason, user receives the error message immediately and can initiate corrective actions. On the other hand, file-based interfaces are usually monitored by IT and errors resolution needs to be coordinated with multiple parties, requiring more effort and time.
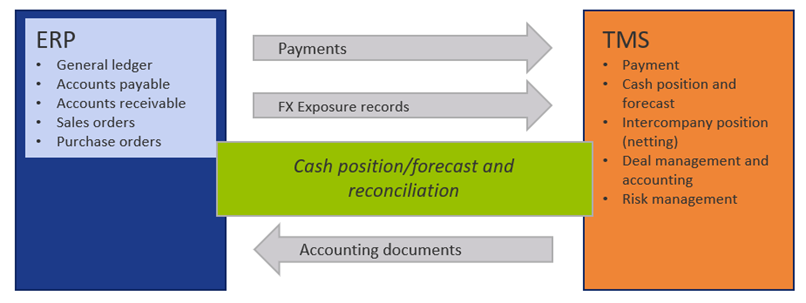
Figure 1 Usual data flow between ERP and TMS
- Parallel maintenance of master data
Integration flows require harmonization decisions in the area of master data. Financial master data (G/L accounts, cost centers, cost elements) are involved as well as bank master data and payment beneficiaries (vendors). TMS systems rarely offer an interface to automatically synchronize the master data with the ERP system – dual manual maintenance is assumed. Using one of the systems as leading system for the respective master data (e.g. bank masters) is usually not an available option.
- Redundant capabilities
Both the ERP and TMS systems need to cover certain functionalities for different purpose. ERP to support payments and cash management in purchase-to-pay and order-to-cash, while TMS supports the same in treasury process. Both systems need to cover creation of payment formats, reconciliation of electronic bank statement, update of cash position for their area. These functionalities need to be maintained in parallel, or specific solution defined, to avoid the redundancy.
Conclusion
So, should the treasury function follow into the centralized ERP solution as well, or does a separate TMS instance have its justification? The answer to this question depends strongly on your business model and the degree of functional centralization. If functional centralization and streamlined business operations across your global entities is important in your business, you are probably already very advanced in ERP centralization as well. You can expect benefits from integrating the treasury function into such system setup.
On the other hand, if the above does not apply, you may benefit from the rich choice of various TMS solutions available at competitive prices to fit your specific needs.
Every business runs differently. We are happy to support you in your specific situation.


Setting up a complete stand-alone treasury function from scratch is one of the most comprehensive activities for any Treasurer.
Having to do this as part of a transaction where part of an existing business is being sold adds a major challenging element: time.
Time pressure together with the uncertainty of who will be the ultimate buyer (Financial Investor vs. Strategic Investor with an existing treasury function) requires many key decisions to be made under uncertainty. One of these key decisions is the one about the Treasury Management System (TMS) and the corresponding functionalities that have to be available on the closing day of the transaction. This decision has two components: costs and time to go-live.
Considerations
Technical developments in recent years have led to a situation where basic functionalities can be provided in-time by deploying a standard TMS at a cost not higher than any individual spreadsheet-based solution provided by consultants. Therefore, it has become a standard that an integrated TMS is a must-have for Day-1. It provides cash visibility and forecasting, captures both internal and external financial transactions and valuates them for period-end closing, therefore a TMS is the main Treasury Enabler.
With the time remaining until closing usually being quite short (often not more than 3-6 months) the question regarding the long-term strategic fit however has been one of minor relevance. This was and still is the case when the ERP-System is SAP-based. Until now, SAP treasury and risk management and cash and liquidity management components have not been part of the shortlist for transaction related TMS requirements. Three major (valid) arguments have been the reason for this:
- Cost,
- Complexity and therefore the longer duration time for an SAP implementation
- & Usability, especially by treasury staff that are not necessarily familiar with SAP logic.
But every major technical development requires us to question existing narratives and ask whether certain arguments are still valid.
Making the Right Strategic Choice
Usually, SAP has been dropped from the discussion when an implementation time constraint of between 3-6 months exists. The same applies if the future ERP landscape hasn’t been decided upon. This uncertainty often leads to the decision to opt against SAP. Let’s start with this element. A feasible solution to overcome this uncertainty is that of a Treasury Sidecar, i.e., implement a separate SAP instance with the SAP Treasury components. This allows connection to the existing (SAP) landscape, as well as providing the option of a future migration into a single S/4HANA environment and mapping treasury to the new General Ledger. This means that there should be no strategic or technical reason not to consider SAP.
We also looked at the latest SAP Treasury developments regarding the cloud-based SAP S/4HANA Treasury components from a time perspective. We specifically looked at the Private and Public Cloud Solutions from two angles: What is the minimum implementation time considering that SAP Best Practices are applied and secondly what are the consequences when looking at the integration into either an existing SAP ERP Central Component (SAP ECC) environment or a future S/4HANA platform? What our evaluation revealed is quite astonishing.
Public or Private Cloud?
When looking at the tight timeline argument against SAP we should examine the two main alternatives: the public cloud solution and the private cloud alternative. The private cloud can be considered similar to an on-premise installation, with the main difference being that the private cloud solution can be hosted by SAP or built within in your own data center. A private cloud could also use one of the Infrastructure-as-a-Service (IaaS) providers, such as AWS, Azure, GCP, or Alibaba Cloud.
These alternatives have the advantage of a fixed timeline (3-6 Months) for their implementation based on SAP’s Best Practices approach, together with SAP’s Activate. A requirements gathering is still the starting point to call out what is included in the first phase during its 3 months of implementation. This phase delivers a comfortable solution based on an 80/20 approach and covers what is usually required on Day-1.
Pros & Cons of the Cloud Options
A typical question is: what can’t we do if we opt for either the public or the private cloud? The answer is quite simple: The public cloud is a common environment with restrictions on building what is not already there – i.e. a gap identified is a real gap (and remains so). The private cloud is much like an on-premise solution with certain variations – like the SAP hosted option – where additional restrictions apply in terms of how far you can go about extending functionality.
Building a treasury side car and applying SAP Best Practice and the SAP Activate methodology, and following them closely, leads to similar implementation times for both public and private cloud (or on-premise) options, given that the same functionalities are to be implemented. This means, that implementation duration is not a major decision point. This leaves one key decision element: the question is, what type of flexibility & functional requirements – beyond what’s available in the public cloud solution – are required in the future?
The answer to this may lead to adopting an implementation approach very much like public cloud but in a private cloud (or on-premise) environment in order to get the flexibility needed to extend and expand for the future.
So yes, there is a new kid on the block, and it has to be taken seriously.

The SAP Activate approach and Best Practices for SAP S/4HANA can help organizations deliver a fast, simplified adoption of SAP treasury functionality within S/4HANA.
Greg Williams, senior manager at Zanders, tells us what this is, how it can accelerate implementations, and informs us about new developments in 2023.
In previous articles we covered a perspective on the different types of deployment options available for SAP S/4HANA – i.e. On-Premise, Public Cloud and Private Cloud. In this article we look to provide insight into how to leverage SAP’s Activate implementation methodology and Best Practice content to accelerate your adoption of SAP’s S/4HANA treasury capability.
Previously, SAP had what they used to call ‘rapid deployment solutions’ (RDS) and content to aid implementation. But the replacement SAP Activate approach is a far more complete way to build and deploy systems. It has also evolved and matured over the years, since the first release in 2015, so it is important to keep up-to-date. The offering is now supported by very rich and mature Best Practice content that includes detailed business process documentation and test scripts.
Implementation Methodology
SAP Activate is an agile methodology that leverages the various accelerators mentioned above. In reality, most implementations will not necessarily adopt the full methodology completely, only taking what is relevant to them. However many aspects of it should be leveraged in formulating some type of hybrid agile / waterfall methodology for a treasuries implementation project – based on all of the complex real-world factors that any given organization has to accommodate.
In this article we will provide some insight into the SAP Activate elements and methodology and then look at it from a treasury perspective, examining the treasury specific scope items included in SAP’s Best Practices run-through. We will drill down into the specific detail so that you get a feel for both the breadth and depth of what SAP has to offer.
This will be like a visual tour from the highest level, with lots of graphs to come, through to the lowest level of detail. The key thing to remember is that the Best Practices content and SAP Activate methodology is applicable to the full array of system functionality and herein lies the benefit in that all parts of the business embrace this same content and approach.
SAP Activate
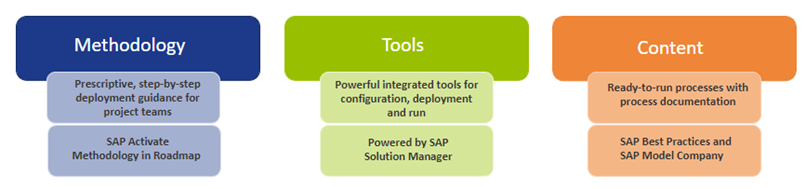
First let’s have a brief look into SAP Activate. Starting with the elements that are included and then looking at the phases in the project lifecycle, which will give greater insight into the methodology. The elements are:
- the methodology,
- tools, which are very much supported by SAP’s Solution Manager,
- & then the content, including for example the Best Practices advice, which we will unpack a bit later.
The elements provide the project team with ready-to-use templates and accelerators, which can be used in the entire Activate journey with the help of step-by-step guidelines. We will cover what needs to be delivered in each phase and how to deploy the solution in Cloud/On-premise, according to the business needs.
Figure 1: SAP Activate elements.
Source: SAP
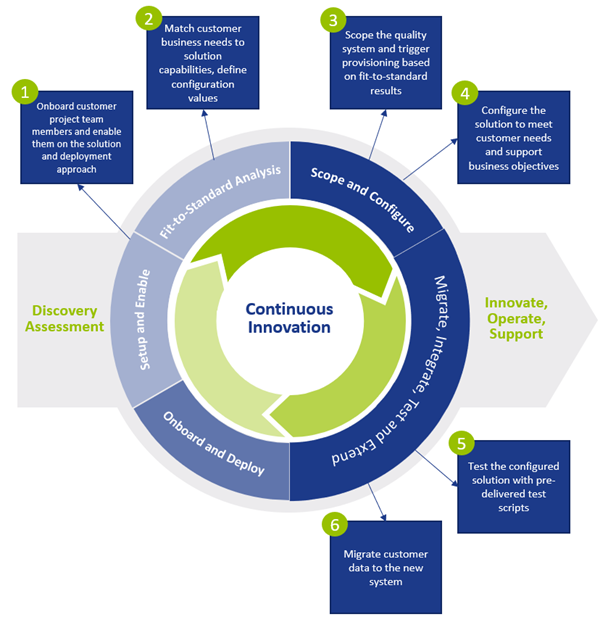
In SAP Activate, there are six phases. At the end of each phase, quality gates are present to make sure respective deliverables in each phase are completed, as per the standards.
This methodology is an agile framework and hence all these phases are run in an iterative manner in order to build a solution. The six phases are: Discover, Prepare, Explore, Realize, Deploy and Run.
Figure 2: SAP Activate phases.
Source: SAP.
SAP Best Practices Content
The SAP Best Practice content is currently accessed through the SAP Best Practices explorer. This application is planned to be discontinued by end of June 2023, whilst it will not be replaced SAP will provide an entirely different application that will also cover SAP Best Practices solutions. The first release of the new application is planned prior to the end of June 2023.
Turning to the SAP Best Practices advisory content next, there are two diagrams below that show all the lines of business and business areas included in Best Practices approach for SAP S/4HANA. These diagrams are logically split between what the vendor calls Operational ERP and Administrative ERP. Treasury Management forms part of the Finance subset under the Administrative ERP side.
Figure 3: SAP Best Practices – Operational & Administrative ERP.
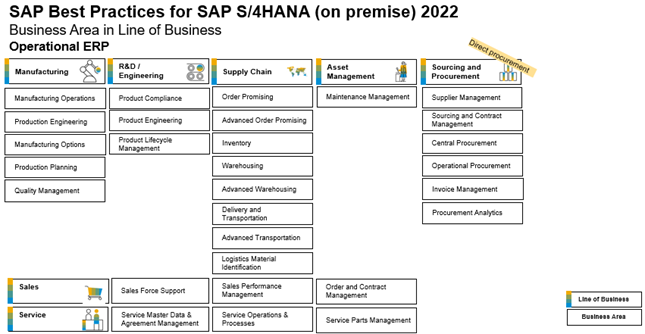
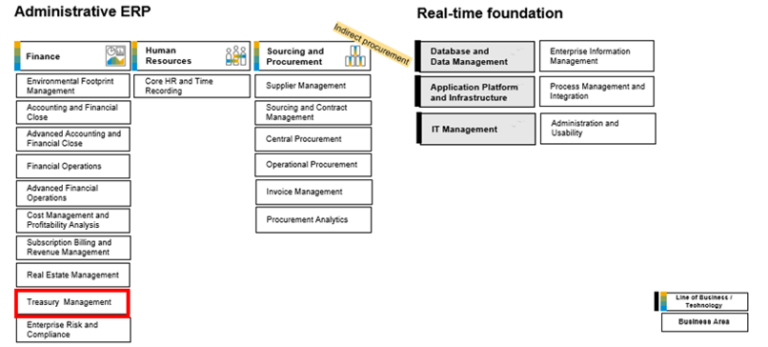
Source: SAP.
Here you can view the diagram (Figure 4: Treasury Management’s position in SAP’s Best Practices implementation methodology. (Source: SAP)). that shows the full set of Treasury Management scope items included in the coverage. From here we will then select a specific scope item to demonstrate some of the detail that is included for every scope item.
Treasury Management Scope Items, are important aspects of SAP’s Best Practices implementation methodology. We will now focus Debt and Investment Management, diving into the details. Scope Item 1WV (Debt and Investment Management) is shown on the Best Practice Explorer module below, Including Process Flows and Test Scripts.
Figure 5: An example of a scope item – for debt & investment management – in SAP’s Best Practices content.
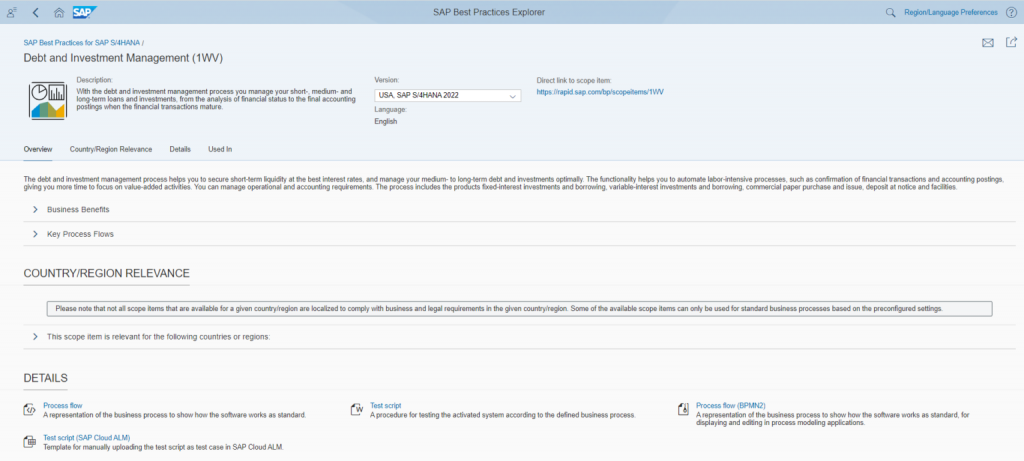
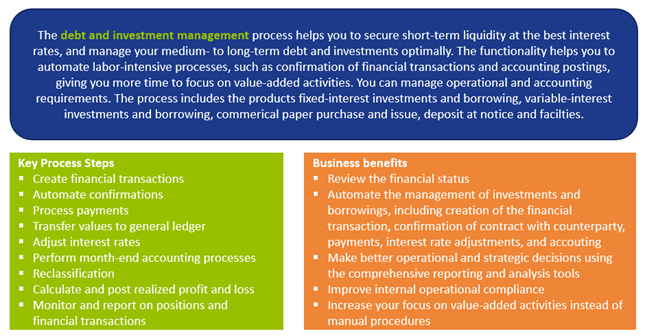
Source: SAP.
There are 13 Process flow diagrams for scope item 1WV – Debt and Investment – alone in SAP Best Practices. A view of the debt and investment management overview process flow diagram is provided in figure 7. The process steps in the Debt and Investment Overview include: (1) Create Debt and Investment Contract; (2) Correspondence; (3) Principal Payment; (4) Period End Closing; (5) Interest Rate Adjustment; (6) Interest Payment; (7) Nominal Amount Adjustment; (8) Reclassification; (9) Terminate Deposit at Notice; (10) Transaction is Premature; (11) Transaction is Mature; (12) Reports. Scope Item 1WV also has a 188-page word based test script document. Additionally, a test script template for Cloud Asset and Liability Management (ALM) risk purposes is also included in the same content.
A view of the debt and investment management overview process flow diagram is provided below:
Figure 6: Debt & investment management process flow.
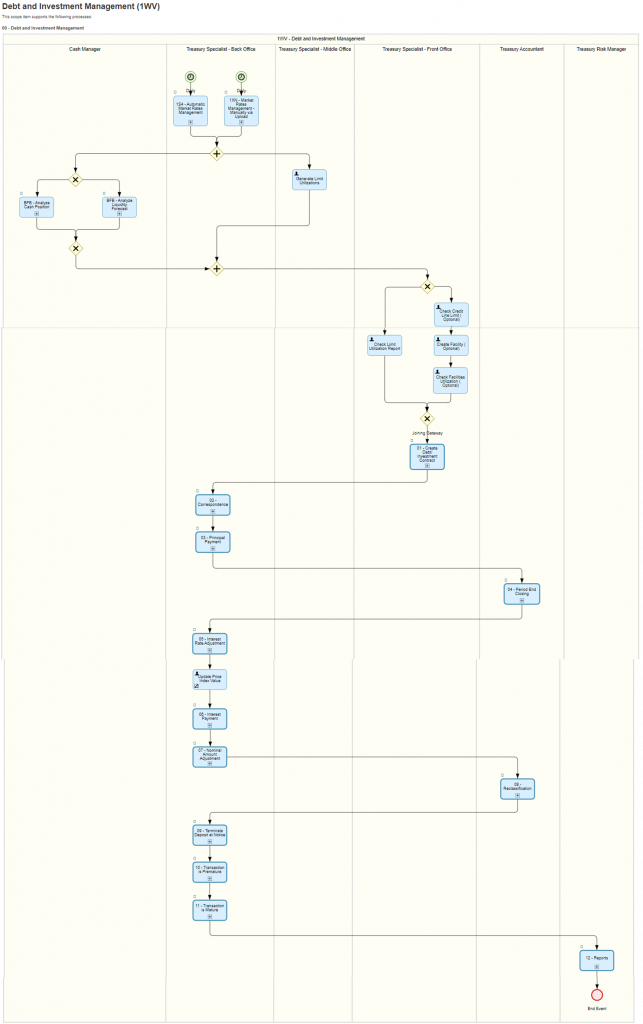
Source: SAP.
Conclusions: Solution Builder
When you embark on the initial phases of your treasury implementation you can also use the SAP Solution Builder to deploy the Best Practice content into a working sandbox test system.
You need to select the scope items for inclusion in the solution build option. It will then build the system, including configuration and master data, such that you will be able to follow the test scripts, and run the business processes. This means you can quickly and easily explore the system according to the documented functionality very early on in your project.
A good approach is to keep a dedicated Best Practices sandbox client in your development environment where you can deploy and explore content at the start of your project, and also use it for future initiatives.
It is clear that you should be able to leverage significantly faster implementation times and to get value quickly, using as much of this vendor provided advisory content as possible. In addition, it is going to be crucial to have a consistent approach for all lines of business and business areas within the project. All areas need to embrace what is on offer in a universal manner, so that the benefit of a more unified approach to your transformation journey can be fully realized. As ever, good project management and perhaps consultancy advice if it is deemed necessary, can improve any implementation template so bear in mind some thought power will still be needed by the project management team.
At Zanders we are striving to embrace the new approach to SAP S/4HANA implementations discussed in this article, while still drawing on the depth of experience and knowledge we’ve built up from both a treasury business and technology perspective over the years on more traditional approaches we’ve used in the past. This can and should be seen as a healthy tension – comparing what has worked previously with what is possible now to find the best pathway forward. This synthesis allows for the benefits of both schools of thought to be leveraged when guiding our customers through their treasury transformation journeys on SAP.

Zanders has strengthened its position in the Middle East treasury community through the launch of a new office in Abu Dhabi Global Market (ADGM).
From there, the financial consultant further expands its track record in the global market for treasury, risk and finance services.
As capital of the United Arab Emirates, Abu Dhabi is home to large corporates, investment banks, fintechs, private equity firms and venture capitalists, asset managers and the largest sovereign wealth funds in the world. ADGM is one of the region’s hotspots for financial services.
“We’re excited and very proud to host the launch of Zanders in the region. With various clientele, including multinational corporations and fintechs, Zanders’ roots in Abu Dhabi will roadmap a progressive journey forward thanks to the nation’s strategic location and ADGM’s robust global connections,” stated ADGM.
Laurens Tijdhof, CEO & Managing Partner at Zanders: “We are committed to enriching the region’s financial services sector and serving the growing need for independent treasury expertise within corporates in the region. ADGM is the ideal launch pad for our growth. This is a great opportunity for us to provide treasury thought leadership to the regional community.”
Zanders is an independent consultancy firm with a track record of innovation and success across the total spectrum of treasury, risk and finance. As a thought leader within these areas of expertise, Zanders combines thought leadership with a high-quality approach and client involvement ‘from ideas to implementation’. The company currently has over 250 specialist treasury and risk consultants globally who work from offices in Europe, the US, Asia and now the Middle East.
Zanders’ team for the Middle East consists of Fernanda De Genaro, Constantine Tyraskis, Sander van Tol and Mark van Ommen.
For direct questions related to this press release, please reach out to:
Sjoerd van Zoelen
+31 6 55 89 09 00
[email protected]
or
Laurens Tijdhof
+31 88 991 02 00
[email protected]

…in times of crises.
Much has been written about COVID-19, its related shutdowns, financial impact and high levels of disruption caused. Although the direct effects of the virus have probably come to a halt, corporates are still facing its (in)direct consequences to this day.
As the economy attempts to return to business as usual, their approach around working capital management will require more in terms of planning, forecasting and measures.
The aftermath of a global shock and its impact on supplies can be catastrophic for certain industries. The pandemic exposed the risks of highly concentrated supplier bases. Rapidly changing supply and demand in the semiconductor industry, that caused global shortages and delays in many related supply chains and ongoing lockdowns in China have demonstrated this.
Reviewing supply management strategies
In addition to the ongoing U.S.-China trade war, which reignited under the Trump administration, the war in Ukraine and associated sanctions and embargoes further exposed the vulnerability of global supply chains. Structural shortages in commodity markets, and especially energy prices, are increasing inflationary pressures. These impacts are rapidly building downstream in many supply chains as can be seen in the increasing producer price indices and can be felt by anyone who recently visited a supermarket. Rising prices further increases uncertainty which impacts interest rates and the availability of funds.
It is unlikely that any significant unclogging of global supply chains will happen very soon. Many corporates are reviewing their supply management strategies and practices. The longer a supply chain, the higher the risk of disruption. Western economies have become overly reliant on goods produced and sourced in Asia and with these rising geopolitical tensions, we have already seen countries and multinationals shift their sourcing to mitigate these risks. A great example is Intel’s investments in semiconductor plants in Germany.
Increased requirement
From a working capital perspective, a higher interest rate environment calls for a more efficient working capital performance – corporates would like to offset the higher cost of borrowing by improving their cash flows and reduce their capital requirements. Borrowing funds is becoming more expensive for both short- and long-term loans. Many lines of credit are repriced monthly and therefore higher interest rates hit corporates almost immediately.
Higher interest rates raise businesses’ cost of capital and negatively impact cash flow. Even if a corporate is not highly leveraged, upstream and downstream operational debt, accounts receivables and payables, will have an impact on its liquidity. With higher inflation, increased sales figures, even at constant quantities, means a higher level of balance in trade receivables. Higher purchase prices have a similar effect on the total inventory on the company’s balance sheet. For companies with a positive net working capital, where the sum of accounts receivables and inventory are greater than accounts payables, the extra investment needed in current assets means an increased requirement of working capital financing.
These are some of the main reasons why in these challenging times, focusing on working capital practices, preserving liquidity and cash flow optimization are paramount.
Working Capital Policies
Not in all corporates Treasury is responsible for working capital management. However, to ensure sufficient cash to fulfill all obligations, the impact lies with Treasury.
The working capital management concept pertains to how firms manage their current assets and liabilities to ensure continuous day-to-day operations. An important aspect of Working Capital Management is setting the policy, or set of rules, that best suits a specific corporate or industry.
The working capital policy comprised of two elements: (1) the level of investment in current assets and (2) the means of financing current assets. When selecting the most suitable policy, firms try to obtain an optimal level of working capital dependent on the trade-off between risk and return.
When examining these Working Capital Policies, three general approaches can be distinguished:
- The conservative policy, where firms aim to maintain high levels of working capital (high investment in working capital), as they rely more on long-term financing compared with short-term financing, decreasing both risk and return.
- The aggressive working capital approach, where the financing mix of a corporate leans more to the use of short-term capital to finance its investments, which indicates lower structural investment in working capital. Increasing risk and return.
- The hedging or matching policy, where short-term assets are matched with short-term liabilities and the permanent amount of short-term assets is financed by long-term financing resources. Thus, the investment in working capital may increase or decrease according to the firm’s activity.
Corporates that employ the conservative or hedging approach are least likely to be affected by the recent challenges of higher interest rates as the cost of capital has been locked in for a longer period of time. Companies that have taken a more aggressive stance are among the first to witness the inflationary impact in their overall cost of capital. Although the Working Capital Policies are mainly driven by business strategy and industry complexity, it might be worthwhile for businesses to reconsider these policies now capital structure is becoming a more important factor.
Working capital is often measured by the Cash Conversion Cycle (CCC): Days Sales Outstanding (DSO) + Days Inventory Outstanding (DIO) – Days Payables Outstanding (DPO). It indicates how long each net input currency is tied up in the production and sales process before it gets converted into cash received. It considers the time needed to collect receivables and the time it has to pay its bills without incurring interest or penalties. The cash conversion cycle is optimized (lowered) by increasing DPO and decreasing DSO and DIO.
While profitability is often the key focus point of many companies and managers, working capital and cash conversion are both the heart and the blood of a company. It is an undeniable truth for many Treasurers and CFOs: ‘Cash is king’. Businesses need cash to soldier on, build strategic alliances, propose items that will elevate its competitive stature over time and increase future profitability.
Unique times
Over the course of the last decade, corporates have grown accustomed to low, and even negative, interest rates and high availability of cash in the market and many have taken an aggressive stance in their working capital investment strategies. Especially corporates that operate in the lower margin and highly competitive industries. These recent challenges impact the way a corporate should manage its working capital and to maybe reconsider its working capital policy.
To mitigate the risk of disrupted supply chains, a corporate might first choose to have higher inventory levels that increase their DIO in their cash conversion cycle and their respective capital requirements. Although generally suboptimal, for companies with an aggressive stance, short-term and flexible credit were sensible temporary alternatives to overcome these challenges. In times of rising interest rates however, a corporate’s natural reaction is to decrease its overall capital requirements and reduce the effects of the interest component in their margin metrics.
Now both the challenges of disrupted supply chains and rising interest rates collide, their unique combination presents extra complications to corporates and their Treasurers as typical solutions for one problem are now counterproductive in tackling the second challenge. Furthermore, corporates tied to leverage covenants are faced with a double challenge as these circumstances simultaneously lower the profitability and extend the balance sheet, negatively impacting their leverage metric and consequently increasing interest charges.
What should the treasurer do?
Where in high times working capital management and its financing is ‘just’ a component in a business and corporates can concentrate on the happy flow, crises challenge us to think differently and creatively to overcome our problems. Instead of pushing the issues up and down the supply chain on the short term, a corporate should re-assess its capital structure and financing mix to check its robustness. It is the role of the Treasurer, during times like these, to raise company broad awareness of its impact, gain improved insight in all related processes and to find alternatives.
Businesses are looking for solutions to free up additional funding for their working capital. It is vital that Treasurers look to leverage every tool available to convert sales into cash. The longer that cash is uncollected, the longer it is effectively funding another business rather than the creditors.
Improve on data gather and information
The starting point of successful working capital management is improved insight in cash flows. Treasurers should invest time and resources to optimize cash flow forecasting using the correct data and metrics, which is a challenge on its own. In many instances, existing tools deployed do not take into account deviations from payment terms at a client’s level and the actual flows of cash. Corporates should cross-check credit terms captured in their systems against actual flows to improve their forecasting. Under normal circumstances, reconciliation between the two is already important, but even more so during times of uncertainty that could impact your counterparties and their payment behavior.
While standard practice for a credit insurer, continuously reassessing credit risk of clients and suppliers is something overlooked quite often by corporates. Shipping that order across the globe to your once best customer can become a costly affair when you are unaware of its most recent financial challenges. It is important to have this insight in your supply chain to avoid unpleasant surprises.
Without having a precise and complete insight when cash is coming in and needs to be reinvested, pinpointing your future capital requirement, and where to find these funds, is no simple matter.
Supply Chain Finance solutions to consider
While improving insights, Treasurers should also investigate flexible solutions specifically designed to overcome short-term funding shortages such as factoring and reverse factoring programs.
Factoring programs are initiated from the seller’s perspective within a supply chain and enable the corporate to sell its accounts receivable balances to a financial institution or an investing firm (the factor) for cash advances. This immediately improves the cash conversion cycle by decreasing the DSO component.
Reverse factoring caters to the other side of the supply chain and is focused on financing the downstream flow, initiated from a buyer’s perspective. Invoices to the supplier are paid early or against the originally negotiated credit terms by the factor party. Leveraging the creditworthiness of the buyer, smaller suppliers might benefit from these programs as the discount on the funds received will be lower than factoring programs initiated from their side and extend credit terms could be given. Using reverse factoring solutions increases the effective DPO for the buyer while simultaneously decreasing the DSO from the supplier’s perspective lowering their overall cash conversion cycle.
Whether factoring or reverse factoring is put into practice, the highest mutual benefits can be achieved by initiating the programs by the party with the highest credit rating as their cost of capital is generally lower.
As for everything in this world, it holds in both cases that there is no such thing as a free lunch. Payments are discounted and the costs of finance are similar to short-term loans, but offer increased flexibility on top of existing financial debt. Many of these programs are very user-friendly and most accompanying portals allow for direct integration with many ERP systems to automatically upload invoices to be factored.
Collaborate with key partners in your supply chain
Seek collaboration within your supply chain and adjust planning and mutual initiatives. When considering supply chain finance solutions, do not only investigate initiating your own programs, but reach out to your key suppliers and customers to see whether they are open for collaboration. It is possible that your company can be included in already existing (reverse) factoring programs initiated by your business partners.
Apart from programs involving a third party to finance the supply chain, static and dynamic discounting are other solutions to be investigated. It allows a corporate that is less cash constrained to make direct payments to their supplier at a discounted purchasing price. With static discounting, the discount rate is set in advance, whereas with the dynamic variant, the discount is adjusted to the actual date of payment.
These solutions not only optimize your cash inflow and/or honor the payment terms negotiated, it could also strengthen business relationships in the supply channels through improved cooperation.
Conclusion
In times where both disrupted supply chains and rising interest rates present corporates and their Treasurers with a unique combination of challenges, it is important to gain insight and knowledge about the particular position and needs of your company. Although the solutions to overcome the supply chain disruption by increasing inventory might naturally be counterproductive to lower capital requirements and financing costs, many flexible supply chain finance solutions exist to help a corporate with their cash constraints and to optimize its financing mix.
To gain a better understanding of your company’s working capital position, the potential risks and financing possibilities, Zanders can help you gain insight, explore supply chain finance solutions and make educated decisions.