


As the SWIFT MT-MX migration gains momentum, we are now starting to see more questions from the corporate community around the potential impact of this industry migration.
But the adoption of ISO 20022 XML messaging goes beyond SWIFT’s adoption in the interbank financial messaging space – SWIFT are currently estimating that by 2025, 80% of the RTGS (real time gross settlement) volumes will be ISO 20022 based with all reserve currencies either live or having declared a live date. What this means is that ISO 20022 XML is becoming the global language of payments. In this fourth article in the ISO 20022 series, Zanders experts Eliane Eysackers and Mark Sutton provide some valuable insights around what the version 9 payment message offers the corporate community in terms of richer functionality.
A quick recap on the ISO maintenance process?
So, XML version 9. What we are referencing is the pain.001.001.09 customer credit transfer initiation message from the ISO 2019 annual maintenance release. Now at this point, some people reading this article will be thinking they are currently using XML version 3 and now we talking about XML version 9. The logical question is whether version 9 is the latest message and actually, we expect version 12 to be released in 2024. So whilst ISO has an annual maintenance release process, the financial industry and all the associated key stakeholders will be aligning on the XML version 9 message from the ISO 2019 maintenance release. This version is expected to replace XML version 3 as the de-facto standard in the corporate to bank financial messaging space.
What new functionality is available with the version 9 payment message?
Comparing the current XML version 3 with the latest XML version 9 industry standard, there are a number of new tags/features which make the message design more relevant to the current digital transformation of the payment’s ecosystem. We look at the main changes below:
- Proxy: A new field has been introduced to support a proxy or tokenisation as its sometimes called. The relevance of this field is primarily linked to the new faster payment rails and open banking models, where consumers want to provide a mobile phone number or email address to mask the real bank account details and facilitate the payment transfer. The use of the proxy is becoming more widely used across Asia with the India (Unified Payments Interface) instant payment scheme being the first clearing system to adopt this logic. With the rise of instant clearing systems across the world, we are starting to see a much greater use of proxy, with countries like Australia (NPP), Indonesia (BI-FAST), Malaysia (DuitNow), Singapore (FAST) and Thailand (Promptpay) all adopting this feature.
- The Legal Entity Identifier (LEI): This is a 20-character, alpha-numeric code developed by the ISO. It connects to key reference information that enables clear and unique identification of legal entities participating in financial transactions. Each LEI contains information about an entity’s ownership structure and thus answers the questions of 'who is who’ and ‘who owns whom’. Simply put, the publicly available LEI data pool can be regarded as a global directory, which greatly enhances transparency in the global marketplace. The first country to require the LEI as part of the payment data is India, but the expectation is more local clearing system’s will require this identifier from a compliance perspective.
- Unique End-to-end Transaction Reference (commonly known as a UETR): This is a string of 36 unique characters featured in all payment instruction messages carried over the SWIFT network. UETRs are designed to act as a single source of truth for a payment and provide complete transparency for all parties in a payment chain, as well as enable functionality from SWIFT gpi (global payments innovation)1, such as the payment Tracker.
- Gender neutral term: This new field has been added as a name prefix.
- Requested Execution Date: The requested execution date now includes a data and time option to provide some additional flexibility.
- Structured Address Block: The structured address block has been updated to include the Building Name.
In Summary
Whilst there is no requirement for the corporate community to migrate onto the XML version 9 message, corporate treasury should now have the SWIFT ISO 20022 XML migration on their own radar in addition to understanding the broader global market infrastructure adoption of ISO 20022. This will ensure corporate treasury can make timely and informed decisions around any future migration plan.
Notes:
- SWIFT gpi is a set of standards and rules that enable banks to offer faster, more transparent, and more reliable cross-border payments to their customers.

The European Central Bank (ECB) is charting new territories in the realm of financial security with a groundbreaking thematic stress test slated for 2024
In the stress test methodology, participating banks are required to evaluate the impact of a cyber attack. They must communicate their response and recovery efforts by completing a questionnaire and submitting pertinent documentation. Banks undergoing enhanced assessment are further mandated to conduct and report the results of IT recovery tests specific to the scenario. The reporting of the cyber incident is to be done using the template outlined in the SSM Cyber-incident reporting framework.
Assessing Digital Fortitude: Scope and Objectives
The ECB's decision to conduct a thematic stress test on cyber resilience in 2024 holds profound significance. The primary objective is to assess the digital operational resilience of 109 Significant Institutions, contemplating the impact of a severe but plausible cybersecurity event. This initiative seeks to uncover potential weaknesses within the systems and derive strategic remediation actions. Notably, 28 banks will undergo an enhanced assessment, heightening the scrutiny on their cyber resilience capabilities. The outcomes are poised to reverberate across the financial landscape, influencing the 2024 SREP OpRisk Score and shaping qualitative requirements.
General Overview and Scope
- Supervisory Board of ECB has decided to conduct a thematic stress test on „cyber resilience“ in 2024.
- Main objective is to assess the digital operational resilience in case of a severe but plausible cybersecurity event, to identify potential weaknesses and derive remediation actions.
- Participants will be 109 Significant Institutions (28 banks will be in scope of an enhanced assessment).
- The outcome will have an impact on the 2024 SREP OpRisk Score and qualitative requirements.
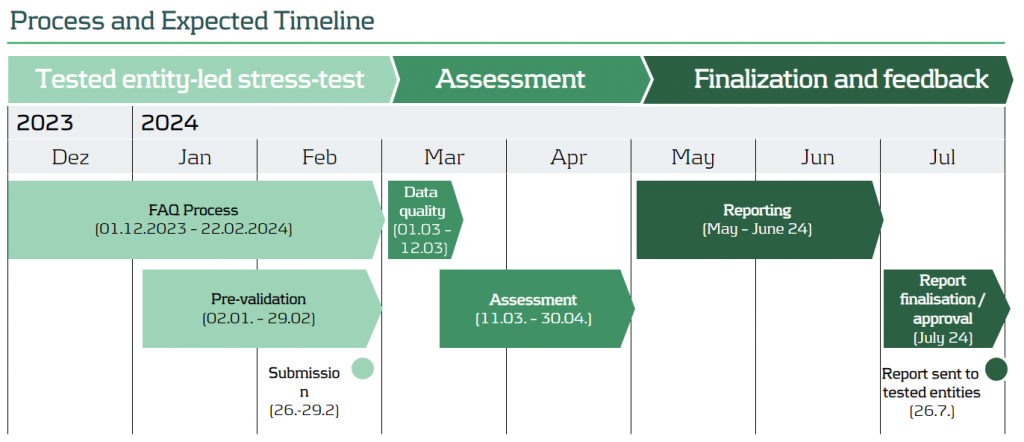
Navigating the Evaluation: Stress Test Methodology
Participating banks find themselves at the epicenter of this evaluative process. They are tasked with assessing the impact of a simulated cyber attack and meticulously reporting their response and recovery efforts. This involves answering a comprehensive questionnaire and providing relevant documentation as evidence. For those under enhanced assessment, an additional layer of complexity is introduced – the execution and reporting of IT recovery tests tailored to the specific scenario. The cyber incident reporting follows a structured template outlined in the SSM Cyber-incident reporting framework.
Stress Test Methodology
- Participating banks have to assess the impact of the cyber-attack and report their response and recovery by answering the questionnaire and providing relevant documentation as evidence.
- Banks under the enhanced assessment are additionally requested to execute and provide results of IT recovery tests tailored to the specific scenario.
- The cyber incident has to be reported by using the template of the SSM Cyber-incident reporting framework.
Setting the Stage: Scenario Unveiled
The stress test unfolds with a meticulously crafted hypothetical scenario. Envision a landscape where all preventive measures against a cyber attack have either been bypassed or failed. The core of this simulation involves a cyber-attack causing a loss of integrity in the databases supporting a bank's main core banking system. Validation of the affected core banking system is a crucial step, overseen by the Joint Supervisory Team (JST). The final scenario details will be communicated on January 2, 2024, adding a real-time element to this strategic evaluation.
Scenario
- The stress test will consist of a hypothetical scenario that assumes that all preventive measures have been bypassed or have failed.
- The cyber-attack will cause a loss of integrity of the database(s) that support the bank’s main core banking system.
- The banks have to validate the selection of the affected core banking system with the JST.
- The final scenario will be communicated on 2 January 2024.
Partnering for Success: Zanders' Service Offering
In the complex terrain of the Cyber Resilience Stress Test, Zanders stands as a reliable partner. Armed with deep knowledge in Non-Financial Risk, we navigate the intricacies of the upcoming stress test seamlessly. Our support spans the entire exercise, from administrative aspects to performing assessments that determine the impact of the cyber attack on key financial ratios as requested by supervisory authorities. This service offering underscores our commitment to fortifying financial institutions against evolving cyber threats.
Zanders Service Offering
- Our deep knowledge in Non-Financial Risk enables us to navigate smoothly through the complexity of the upcoming Cyber Resilience Stress Test.
- We support participating banks during the whole exercise of the upcoming Stress Test.
- Our Services cover the whole bandwidth of required activities starting from administrative aspects and ending up at performing assessments to determine the impact of the cyber-attack in regard of key financial ratios requested by the supervisory authority.

The 2023 Global Risk Report by the World Economic Forum investigates the potential hazards for humanity in the next decade.
In this report, biodiversity loss ranks as the fourth most pressing concern after climate change adaptation, mitigation failure, and natural disasters. For financial institutions (FIs), it is therefore a relevant risk that should be taken into account. So, how should FIs implement biodiversity risk in their risk management framework?
Despite an increasing awareness of the importance of biodiversity, human activities continue to significantly alter the ecosystems we depend on. The present rate of species going extinct is 10 to 100 times higher than the average observed over the past 10 million years, according to Partnership for Biodiversity Accounting Financials[i]. The Intergovernmental Science-Policy Platform on Biodiversity and Ecosystem Services (IPBES) reports that 75% of ecosystems have been modified by human actions, with 20% of terrestrial biomass lost, 25% under threat, and a projection of 1 million species facing extinction unless immediate action is taken. Resilience theory and planetary boundaries state that once a certain critical threshold is surpassed, the rate of change enters an exponential trajectory, leading to irreversible changes, and, as noted in a report by the Nederlandsche Bank (DNB), we are already close to that threshold[ii].
We will now explain biodiversity as a concept, why it is a significant risk for financial institutions (FIs), and how to start thinking about implementing biodiversity risk in a financial institutions’ risk management framework.
What is biodiversity?
The Convention on Biological Diversity (CBD) defines biodiversity as “the variability among living organisms from all sources including, i.a., terrestrial, marine and other aquatic ecosystems and the ecological complexes of which they are part.”[iii] Humans rely on ecosystems directly and indirectly as they provide us with resources, protection and services such as cleaning our air and water.
Biodiversity both affects and is affected by climate change. For example, ecosystems such as tropical forests and peatlands consist of a diverse wildlife and act as carbon sinks that reduce the pace of climate change. At the same time, ecosystems are threatened by the accelerating change caused by human-induced global warming. The IPBES and Intergovernmental Panel on Climate Change (IPCC), in their first-ever collaboration, state that “biodiversity loss and climate change are both driven by human economic activities and mutually reinforce each other. Neither will be successfully resolved unless both are tackled together.”[iv]
Why is it relevant for financial institutions?
While financial institutions’ own operations do not materially impact biodiversity, they do have impact on biodiversity through their financing. ASN Bank, for instance, calculated that the net biodiversity impact of its financed exposure is equivalent to around 516 square kilometres of lost biodiversity – which is roughly equal to the size of the isle of Ibiza in Spain[v]. The FIs’ impact on biodiversity also leads to opportunities. The Institute Financing Nature (IFN) report estimates that the financing gap for biodiversity is close to $700 billion annually[vi]. This emphasizes the importance of directing substantial financial resources towards biodiversity-positive initiatives.
At the same time, biodiversity loss also poses risks to financial institutions.
The global economy highly depends on biodiversity as a result of the increasedglobalization and interconnectedness of the financial system. Due to these factors, the effects of biodiversity losses are magnified and exacerbated through the financial system, which can result in significant financial losses. For example, approximately USD 44 trillion of the global GDP is highly or moderately dependent on nature (World Economic Forum, 2020). Specifically for financial institutions, the DNB estimated that Dutch FIs alone have EUR 510 billionof exposure to companies that are highly or very highly dependent on one or more ecosystems services[vii]. Furthermore, in the 2010 World Economic Forum report worldwide economic damage from biodiversity loss is estimated to be around USD 2 to 4.5 trillion annually. This is remarkably high when compared to the negative global financial damage of USD 1.7 trillion per year from greenhouse gas emissions (based on 2008 data), which demonstrates that institutions should not focus their attention solely on the effects of climate change when assessing climate & environmental risks[viii].
Examples of financial impact
Similarly to climate risk, biodiversity risk is expected to materialize through the traditional risk types a financial institution faces. To illustrate how biodiversity loss can affect individual financial institutions, we provide an example of the potential impact of physical biodiversity risk on, respectively, the credit risk and market risk of an institution:
Credit risk:
Failing ecosystem services can lead to disruptions of production, reducing the profits of counterparties. As a result, there is an increase in credit risk of these counterparties. For example, these disruptions can materialize in the following ways:
- A total of 75% of the global food crop rely on animals for their pollination. For the agricultural sector, deterioration or loss of pollinating species may result in significant crop yield reduction.
- Marine ecosystems are a natural defence against natural hazards. Wetlands prevented USD 650 million worth of damages during the 2012 Superstorm Sandy [OECD, 2019), while the material damage of hurricane Katrina would have been USD 150 billion less if the wetlands had not been lost.
Market risk:
The market value of investments of a financial institution can suffer from the interconnectedness of the global economy and concentration of production when a climate event happens. For example:
- A 2011 flood in Thailand impacted an area where most of the world's hard drives are manufactured. This led to a 20%-40% rise in global prices of the product[ix]. The impact of the local ecosystems for these type of products expose the dependency for investors as well as society as a whole.
Core part of the European Green Deal
The examples above are physical biodiversity risk examples. In addition to physical risk, biodiversity loss can also lead to transition risk – changes in the regulatory environment could imply less viable business models and an increase in costs, which will potentially affect the profitability and risk profile of financial institutions. While physical risk can be argued to materialize in a more distant future, transition risk is a more pressing concern as new measures have been released, for example by the European Commission, to transition to more sustainable and biodiversity friendly practices. These measures are included in the EU biodiversity strategy for 2030 and the EU’s Nature restoration law.
The EU’s biodiversity strategy for 2030 is a core part of European Green Deal. It is a comprehensive, ambitious, and long-term plan that focuses on protecting valuable or vulnerable ecosystems, restoring damaged ecosystems, financing transformation projects, and introducing accountability for nature-damaging activities. The strategy aims to put Europe's biodiversity on a path to recovery by 2030, and contains specific actions and commitments. The EU biodiversity strategy covers various aspects such as:
- Legal protection of an additional 4% of land area (up to a total of 7%) and 19% of sea area (up to a total of 30%)
- Strict protection of 9% of sea and 7% of land area (up to a total of 10% for both)
- Reduction of fertilizer use by at least 20%
- Setting measures for sustainable harvesting of marine resources
A major step forwards towards enforcement of the strategy is the approval of the Nature restoration law by the EU in July 2023, which will become the first continent-wide comprehensive law on biodiversity and ecosystems. The law is likely to impact the agricultural sector, as the bill allows for 30% of all former peatlands that are currently exploited for agriculture to be restored or partially shifted to other uses by 2030. By 2050, this should be at least 70%. These regulatory actions are expected to have a positive impact on biodiversity in the EU. However, a swift implementation may increase transition risk for companies that are affected by the regulation.
The ECB Guide on climate-related and environmental risks explicitly states that biodiversity loss is one of the risk drivers for financial institutions[x]. Furthermore, the ECB Guide requires financial institutions to asses both physical and transition risks stemming from biodiversity loss. In addition, the EBA Report on the Management and Supervision of ESG Risk for Credit Institutions and Investment Firms repeatedly refers to biodiversity when discussing physical and transition risks[xi].
Moreover, the topic ‘biodiversity and ecosystems’ is also covered by the Corporate Sustainability Reporting Directive (CSRD), which requires companies within its scope to disclose on several sustainability related matters using a double materiality perspective.[1] Biodiversity and ecosystems is one of five environmental sustainability matters covered by CSRD. At a minimum, financial institutions in scope of CSRD must perform a materiality assessment of impacts, risks and opportunities stemming from biodiversity and ecosystems. Furthermore, when biodiversity is assessed to be material, either from financial or impact materiality perspective, the institution is subject to granular biodiversity-related disclosure requirements covering, among others, topics such as business strategy, policies, actions, targets, and metrics.
Where to start?
In line with regulatory requirements, financial institutions should already be integrating biodiversity into their risk management practices. Zanders recognizes the challenges associated with biodiversity-related risk management, such as data availability and multidimensionality. Therefore, Zanders suggests to initiate this process by starting with the following two steps. The complexity of the methodologies can increase over time as the institution’s, the regulator’s and the market’s knowledge on biodiversity-related risks becomes more mature.
- Perform materiality assessment using the double materiality concept. This means that financial institutions should measure and analyze biodiversity-related financial materiality through the identification of risks and opportunities. Institutions should also assess their impacts on biodiversity, for example, through calculation of their biodiversity footprint. This can start with classifying exposures’ impact and dependency on biodiversity based on a sector-level analysis.
- Integrate biodiversity-related risks considerations into their business strategy and risk management frameworks. From a business perspective, if material, financial institutions are expected to integrate biodiversity in their business strategy, and set policies and targets to manage the risks. Such actions could be engagement with clients to promote their sustainability practices, allocation of financing to ‘biodiversity-friendly’ projects, and/or development of biodiversity specific products. Moreover, institutions are expected to adjust their risk appetites to account for biodiversity-related risks and opportunities, establish KRIs along with limits and thresholds. Embedding material ESG risks in the risk appetite frameworks should include a description on how risk indicators and limits are allocated within the banking group, business lines and branches.
Considering the potential impact of biodiversity loss on financial institutions, it is crucial for them to extend their focus beyond climate change and also start assessing and managing biodiversity risks. Zanders can support financial institutions in measuring biodiversity-related risks and taking first steps in integrating these risks into risk frameworks. Curious to hear more on this? Please reach out to Marije Wiersma, Iryna Fedenko, or Jaap Gerrits.
[1] CSRD applies to large EU companies, including banks and insurance firms. The first companies subject to CSRD must disclose according to the requirements in the European Sustainability Reporting Standards (ESRS) from 2025 (over financial year 2024), and by the reporting year 2029, the majority of European companies will be subject to publishing the CSRD reports. The sustainability report should be a publicly available statement with information on the sustainability-matters that the company considers material. This statement needs to be audited with limited assurance.
[i] PBAF. (2023). Dependencies - Pertnership for Biodiversity Acccounting Financials (PBAF)
[ii] De Nederlandche Bank. (2020). Indepted to nature - Exploring biodiversity risks for the Dutch Financial Sector.
[iii] CBD. (2005). Handbook of the convention on biological diversity
[iv] IPBES. (2021). Tackling Biodiversity & Climate Crises Together & Their Combined Social Impacts
[v] ASN Bank (2022). ASN Bank Biodiversity Footprint
[vi] Paulson Institute. (2021). Financing nature: Closing the Global Biodiversity
[vii] De Nederlandche Bank. (2020). Indepted to nature - Exploring biodiversity risks for the Dutch Financial Sector
[viii] PwC for World Economic Forum. (2010). Biodiversity and business risk
[ix] All the examples related to credit and market risk are presented in the report by De Nederlandsche Bank. (2020). Biodiversity Opportunities and Risks for the Financial Sector
[x] ECB. (2020). Guide on climate-related and environmental risks.
[xi] EBA. (2021). EBA Report on Management and Supervision of ESG Risk for Credit Institutions and Investment Firms

Current carbon offset processes are opaque and rely on centralized players; blockchain technology can provide improvements by assuring transparency and decentralization.
Carbon offset processes are currently dominated by private actors providing legitimacy for the market. The two largest of these, Verra and Gold Standard, provide auditing services, carbon registries and a marketplace to sell carbon offsets, making them ubiquitous in the whole process. Due to this opacity and centralisation, the business models of the existing companies was criticised regarding its validity and the actual benefit for climate action. By buying an offset in the traditional manner, the buyer must place trust in these players and their business models. Alternative solutions that would enhance the transparency of the process as well as provide decentralised marketplaces are thus called for.
The conventional process
Carbon offsets are certificates or credits that represent a reduction or removal of greenhouse gas emissions from the atmosphere. Offset markets work by having companies and organizations voluntarily pay for carbon offsetting projects. Reasons for partaking in voluntary carbon markets vary from increased awareness of corporate responsibility to a belief that emissions legislation is inevitable, and it is thus better to partake earlier.
Some industries also suffer prohibitively expensive barriers for lowering their emissions, or simply can’t reduce them because of the nature of their business. These industries can instead benefit from carbon offsets, as they manage to lower overall carbon emissions while still staying in business. Environmental organisations run climate-friendly projects and offer certificate-based investments for companies or individuals who therefore can reduce their own carbon footprint. By purchasing such certificates, they invest in these projects and their actual or future reduction of emissions. However, on a global scale, it is not enough to simply lower our carbon footprint to negate the effects of climate change. Emissions would in practice have to be negative, so that even a target of 1,5-degree Celsius warming could be met. This is also remedied by carbon credits, as they offer us a chance of removing carbon from the atmosphere. In the current process, companies looking to take part in the offsetting market will at some point run into the aforementioned behemoths and therefore an opaque form of purchasing carbon offsets.
The blockchain approach
A blockchain is a secure and decentralised database or ledger which is shared among the nodes of a computer network. Therefore, this technology can offer a valid contribution addressing the opacity and centralisation of the traditional procedure. The intention of the first blockchain approaches were the distribution of digital information in a shared ledger that is agreed on jointly and updated in a transparent manner. The information is recorded in blocks and added to the chain irreversibly, thus preventing the alteration, deletion and irregular inclusion of data.
In the recent years, tokenization of (physical) assets and the creation of a digital version that is stored on the blockchain gained more interest. By utilizing blockchain technology, asset ownership can be tokenized, which enables fractional ownership, reduces intermediaries, and provides a secure and transparent ledger. This not only increases liquidity but also expands access to previously illiquid assets (like carbon offsets). The blockchain ledger allows for real-time settlement of transactions, increasing efficiency and reducing the risk of fraud. Additionally, tokens can be programmed to include certain rules and restrictions, such as limiting the number of tokens that can be issued or specifying how they can be traded, which can provide greater transparency and control over the asset.
Blockchain-based carbon offset process
The tokenisation process for carbon credits begins with the identification of a project that either captures or helps to avoid carbon creation. In this example, the focus is on carbon avoidance through solar panels. The generation of solar electricity is considered an offset, as alternative energy use would emit carbon dioxide, whereas solar power does not.
The solar panels provide information regarding their electricity generation, from which a figure is derived that represents the amount of carbon avoided and fed into a smart contract. A smart contract is a self-executing application that exist on the blockchain and performs actions based on its underlying code. In the blockchain-based carbon offset process, smart contracts convert the different tokens and send them to the owner’s wallet. The tokens used within the process are compliant with the ERC-721 Non-Fungible Token (NFT) standard, which represents a unique token that is distinguishable from others and cannot be exchanged for other units of the same asset. A practical example is a work of art that, even if replicated, is always slightly different.
In the first stage of the process, the owner claims a carbon receipt, based on the amount of carbon avoided by the solar panel. Thereby the aggregated amount of carbon avoided (also stored in a database just for replication purposes) is sent to the smart contract, which issues a carbon receipt of the corresponding figure to the owner. Carbon receipts can further be exchanged for a uniform amount of carbon credits (e.g. 5 kg, 10 kg, 15 kg) by interacting with the second smart contract. Carbon credits are designed to be traded on the decentralised marketplace, where the price is determined by the supply and demand of its participants. Ultimately, carbon credits can be exchanged for carbon certificates indicating the certificate owner and the amount of carbon offset. Comparable with a university diploma, carbon certificates are tied to the address of the owner that initiated the exchange and are therefore non-tradable. Figure 1 illustrates the process of the described blockchain-based carbon offset solution:
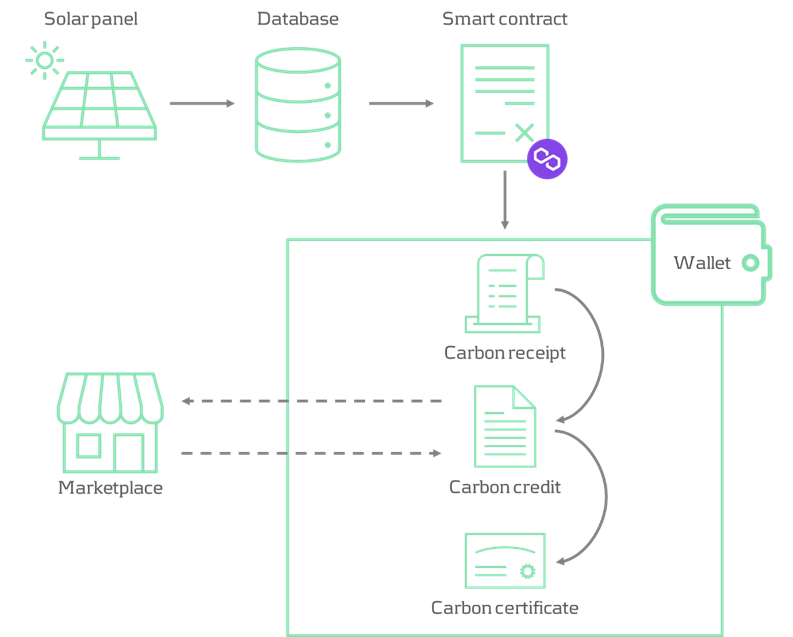
Figure 1: Process flow of a blockchain-based carbon offset solution
Conclusion
The outlined blockchain-based carbon offset process was developed by Zanders’ blockchain team in a proof of concept. It was designed as an approach to reduce dependence on central players and a transparent method of issuing carbon credits. The smart contracts that the platform interacts with are implemented on the Mumbai test network of the public Polygon blockchain, which allows for fast transaction processing and minimal fees. The PoC is up and running, tokenizing the carbon savings generated by one of our colleagues photovoltaic system, and can be showcased in a demo. However, there are some clear optimisations to the process that should be considered for a larger scale (commercial) setup.
If you're interested in exploring the concept and benefits of a blockchain-based carbon offset process involving decentralised issuance and exchange of digital assets, or if you would like to see a demo, you can contact Robert Richter or Justus Schleicher.


Take-aways for bank risk management, supervision and regulation
Early October, the Basel Committee on Banking Supervision (BCBS) published a report[1] on the 2023 banking turmoil that involved the failure of several US banks as well as Credit Suisse. The report draws lessons for banking regulation and supervision which may ultimately lead to changes in banking regulation as well as supervisory practices. In this article we summarize the main findings of the report[2]. Based on the report’s assessment, the most material consequences for banks, in our view, could be in the following areas:
- Reparameterization of the LCR calculation and/or introduction of additional liquidity metrics
- Inclusion of assets accounted for at amortized cost at their fair value in the determination of regulatory capital
- Implementation of extended disclosure requirements for a bank's interest rate exposure and liquidity position
- More intensive supervision of smaller banks, especially those experiencing fast growth and concentration in specific client segments
- Application of the full Basel III Accord and the Basel IRRBB framework to a larger group of banks
Bank failures and underlying causes
The BCBS report first describes in some detail the events that led to the failure of each of the following banks in the spring of 2023:
- Silicon Valley Bank (SVB)
- Signature Bank of New York (SBNY)
- First Republic Bank (FRB)
- Credit Suisse (CS)
While each failure involved various bank-specific factors, the BCBS report highlights common features (with the relevant banks indicated in brackets).
- Long-term unsustainable business models (all), in part due to remuneration incentives for short-term profits
- Governance and risk management did not keep up with fast growth in recent years (SVB, SBNY, FRC)
- Ineffective oversight of risks by the board and management (all)
- Overreliance on uninsured customer deposits, which are more likely to be withdrawn in a stress situation (SVB, SBNY, FRC)
- Unprecedented speed of deposit withdrawals through online banking (all)
- Investment of short-term deposits in long-term assets without adequate interest-rate hedges (SVB, FRC)
- Failure to assess whether designated assets qualified as eligible collateral for borrowing at the central bank (SVB, SBNY)
- Client concentration risk in specific sectors and on both asset and liability side of the balance sheet (SVB, SBNY, FRC)
- Too much leniency by supervisors to address supervisory findings (SVB, SBNY, CS)
- Incomplete implementation of the Basel Framework: SVB, SBNY and FRB were not subject to the liquidity coverage ratio (LCR) of the Basel III Accord and the BCBS standard on interest rate risk in the banking book (IRRBB)
Of the four failed banks, only Credit Suisse was subject to the LCR requirements of the Basel III Accord, in relation to which the BCBS report includes the following observations:
- A substantial part of the available high quality liquid assets (HQLA) at CS was needed for purposes other than covering deposit outflows under stress, in contrast to the assumptions made in the LCR calculation
- The bank hesitated to make use of the LCR buffer and to access emergency liquidity so as to avoid negative signalling to the market
Although not part of the BCBS report, these observations could lead to modifications to the LCR regulation in the future.
Lessons for supervision
With respect to supervisory practices, the BCBS report identifies various lessons learned and raises a few questions, divided into four main areas:
1. Bank’s business models
- Importance of forward-looking assessment of a bank’s capital and liquidity adequacy because accounting measures (on which regulatory capital and liquidity measures are based) mostly are not forward-looking in nature
- A focus on a bank’s risk-adjusted profitability
- Proactive engagement with ‘outlier banks’, e.g., banks that experienced fast growth and have concentrated funding sources or exposures
- Consideration of the impact of changes in the external environment, such as market conditions (including interest rates) and regulatory changes (including implementation of Basel III)
2. Bank’s governance and risk management
- Board composition, relevant experience and independent challenge of management
- Independence and empowerment of risk management and internal audit functions
- Establishment of an enterprise-wide risk culture and its embedding in corporate and business processes.
- Senior management remuneration incentives
3.Liquidity supervision
- Do the existing metrics (LCR, NSFR) and supervisory review suffice to identify start of material liquidity outflows?
- Should the monitoring frequency of metrics be increased (e.g., weekly for business as usual and daily or even intra-day in times of stress)?
- Monitoring of concentration risks (clients as well as funding sources)
- Are sources of liquidity transferable within the legal entity structure and freely available in times of stress?
- Testing of contingency funding plans
4. Supervisory judgment
- Supplement rules-based regulation with supervisory judgment in order to intervene pro-actively when identifying risks that could threaten the bank’s safety and soundness. However, the report acknowledges that a supervisor may not be able to enforce (pre-emptive) action as long as an institution satisfies all minimum requirements. This will also depend on local legislative and regulatory frameworks
Lessons for regulation
In addition, the BCBS report identifies various potential enhancement to the design and implementation of bank regulation in four main areas:
1. Liquidity standards
- Consideration of daily operational and intra-day liquidity requirements in the LCR, based on the observation that a material part of the HQLA of CS was used for this purpose but this is not taken into account in the determination of the LCR
- Recalibration of deposit outflows in the calculation of LCR and NSFR, based on the observation that actual outflow rates at the failed banks significantly exceeded assumed outflows in the LCR and NSFR calculations
- Introduction of additional liquidity metrics such as a 5-day forward liquidity position, survival period and/or non-risk based liquidity metrics that do not rely on run-off assumptions (similar to the role of the leverage ratio in the capital framework)
2. IRRBB
- Implementation of the Basel standard on IRRBB, which did not apply to the US banks, could have made the interest rate risk exposures transparent and initiated timely action by management or regulatory intervention.
- More granular disclosure, covering for example positions with and without hedging, contractual maturities of banking book positions and modeling assumptions
3. Definition of regulatory capital
- Reflect unrealised gains and losses on assets that are accounted for at amortised cost (AC) in regulatory capital, analogous to the treatment of assets that are classified as available-for-sale (AFS). This is supported by the observation that unrealised losses on fixed-income assets held at amortised cost, resulting from to the sharp rise in interest rates, was an important driver of the failure of several US banks when these assets were sold to create liquidity and unrealised losses turned into realised losses. The BCBS report includes the following considerations in this respect:
- If AC assets can be repo-ed to create liquidity instead of being sold, then there is no negative impact on the financial statement
- Treating unrealised gains and losses on AC assets in the same way as AFS assets will create additional volatility in earnings and capital
- The determination of HQLA in the LCR regulation requires that assets are measured at no more than market value. However, this does not prevent the negative capital impact described above
- Reconsideration of the role, definition and transparency of additional Tier-1 (AT1) instruments, considering the discussion following the write-off of AT1 instruments as part of the take-over of CS by UBS
4. Application of the Basel framework
- Broadening the application of the full Basel III framework beyond internationally active banks and/or developing complementary approaches to identify risks at domestic banks that could pose a threat to cross-border financial stability. The events in the spring of this year have demonstrated that distress at relatively small banks that are not subject to the (full) Basel III regulation can trigger broader and cross-border systemic concerns and contagion effects.
- Prudent application of the ‘proportionality’ principle to domestic banks, based on the observation that financial distress at such banks can have cross-border financial stability effects
- Harmonization of approaches that aim to ensure that sufficient capital and liquidity is available at individual legal entity level within banking groups
Conclusion
The BCBS report identifies common shortcomings in bank risk management practices and governance at the four banks that failed during the 2023 banking turmoil and summarizes key take-aways for bank supervision and regulation.
The identified shortcomings in bank risk management include gaps in the management of traditional banking risks (interest rate, liquidity and concentration risks), failure to appreciate the interrelation between individual risks, unsustainable business models driven by short-term incentives at the expense of appropriate risk management, poor risk culture, ineffective senior management and board oversight as well as a failure to adequately respond to supervisory feedback and recommendations.
Key take-aways for effective supervision include enforcing prompt action by banks in response to supervisory findings, actively monitoring and assessing potential implications of structural changes to the banking system, and maintaining effective cross-border supervisory cooperation.
Key lessons for regulatory standards include the importance of full and consistent implementation of Basel standards as well as potential enhancements of the Basel III liquidity standards, the regulatory treatment of interest rate risk in the banking book, the treatment of assets that are accounted for at amortised cost within regulatory capital and the role of additional Tier-1 capital instruments.
The BCBS report is intended as a starting point for discussion among banking regulators and supervisors about possible changes to banking regulation and supervisory practices. For those interested in engaging in discussions related to the insights and recommendations in the BCBS report, please feel free to contact Pieter Klaassen.
[1] Report on the 2023 banking turmoil (bis.org) (accessed on October 19, 2023)
[2] Although recognized as relevant in relation to the banking turmoil, the BCBS report explicitly excludes from its consideration the role and design of deposit guarantee schemes, the effectiveness of resolution arrangements, the use and design of central bank lending facilities and FX swap lines, and public support measures in banking crises.

As per March 2023, SWIFT has taken a major step in its MT/MX migration journey. How does this impact your activities in SAP?
SWIFT now supports the exchange of ISO 20022 XML or MX message via the so-called FINplus network. In parallel, the legacy MT format messages remain to be exchanged over the ‘regular’ FIN network; The MT flow for message categories 1 (customer payments), 2 (FI transfers) and 9 (statements) through the FIN network will be decommissioned per November 2025.
As such, between March 2023 and November 2025, financial institutions need to be able to receive and process MX messages through FINplus on the inbound side, and optionally send MX messages or MT messages for outbound messaging. After that period, only MX will be allowed.
CBPR+ and HVPS+
Another important aspect of the MX migration is the development of the CBPR+ and HVPS+ specifications within the ISO20022 XML standard. These specifications dictate how an XML message should be populated in terms of data and field requirements for Cross Border Payments (CBPR+) and Domestic High Value Payments (HVPS+). Note that HVPS+ refers to domestic RTGS clearing systems and a number of countries are in the process of making the domestic clearing systems native ISO20022 XML-compliant.
Impact for Corporates
As of today, there should be no immediate need for corporates to change. However, it is advised to start assessing impact and to start planning for change if needed. We give you some cases to consider:
- A corporate currently exchanging e.g. MT101/MT103/MT210 messages towards its house bank via SWIFT FIN Network to make cross border payments, e.g. employing a SWIFT Service Bureau or an Alliance connection. This flow will cease to work after November 2025. If this flow is relevant to your company, it needs attention to be replaced.
- Another case is where, for example, an MT101 is exchanged with a house bank as a file over the FileAct network. Now it depends purely on the house bank’s capabilities to continue supporting this flow after 2025; it could offer a service to do a remapping of your MT message into an MX. This needs to be checked with the house banks.
- The MT940 message flow from the house bank via FIN also requires replacement.
- With respect to the MT940 file flow from house bank via FileAct, we expect little impact as we think most banks will continue supporting the MT940 format exchange as files. We do recommend to check with your house bank to be sure.
- High Value Payments for Domestic Japanese Yen using Zengin format; the BOJ-NET RTGS clearing system has already completed the migration to ISO20022 XML standard. Check with your house bank when the legacy payment format will become unsupported and take action accordingly.
These were just some examples and should not be considered an exhaustive list.
In addition, moving to the ISO20022 XML standard can also provide some softer benefits. We discussed this in a previously published article.
Impact on your SAP implementation
So you have determined that the MT/MX migration has impact and that remediating actions need to be taken. What does that look like in SAP?
First of all, it is very important to onboard the bank to support you with your change. Most typically, the bank needs to prepare its systems to be able to receive a new payment file format from your end. It is good practice to first test the payment file formatting and receive feedback from the banks implementation manager before going live with it.
On the incoming side, it is advisable to first request a number of production bank statements in e.g. the new CAMT.053 format, which can be analyzed and loaded in your test system. This will form a good basis for understanding the changes needed in bank statement posting logic in the SAP system.
PAYMENTS
In general, there are two ways of generating payment files in SAP. The classical one is via a payment method linked to a Payment Medium Workbench (PMW) format and a Data Medium Exchange (DME) tree. This payment method is then linked to your open items which can be processed with the payment run. The payment run then outputs the files as determined in your DME tree.
In this scenario, the idea is to simply setup a new payment method and link it to a desired PMW/DME output like pain.001.001.03. These have long been pre-delivered in standard SAP, in both ECC and S/4. It may be necessary to make minor mapping corrections to meet country- or bank-specific data requirements. Under most circumstances this can be achieved with a functional consultant using DME configuration. Once the payment method is fully configured, it can be linked to your customer and vendor master records or your treasury business partners, for example.
The new method of generating payment files is via the Advanced Payment Management (SAP APM) module. SAP APM is a module that facilitates the concepts of centralizing payments for your whole group in a so-called payment factory. APM is a module that’s only available in S/4 and is pushed by SAP AG as the new way of implementing payment factories.
Here it is a matter of linking the new output format to your applicable scenario or ‘payment route’.
BANK STATEMENTS
Classical MT940 bank statements are read by SAP using ABAP logic. The code interprets the information that is stored in the file and saves parts of it to internal database tables. The stored internal data is then interpreted a second time to determine how the posting and clearing of open items will take place.
Processing of CAMT.053 works a bit differently, interpreting the data from the file by a so-called XSLT transformation. This XSLT transformation is a configurable mapping where a CAMT.053 field maps into an internal database table field. SAP has a standard XSLT transformation package that is fairly capable for most use cases. However, certain pieces of useful information in the CAMT.053 may be ignored by SAP. An adjustment to the XSLT transformation can be added to ensure the data is picked up and made available for further interpretation by the system.
Another fact to be aware of is the difference in Bank Transaction Codes (BTC) between MT940 and CAMT.053. There could be a different level of granularity and the naming convention is different. BTC codes are the main differentiator in SAP to control posting logic.
SAP Incoming File Mapping Engine (IFME)
SAP has also put forward a module called Incoming File Mapping Engine (IFME). It serves the purpose as a ‘remapper’ of one output format to another output format. As an example, if your current payment method outputs an MT101, the remapper can take the pieces of information from the MT101 and save it in a pain.001 XML file.
Although there may be some fringe scenarios for this solution, we do not recommend such an approach as MT101 is generally weaker in terms of data structure and content than XML. Mapping it into some other format will not solve the problems that MT101 has in general. It is much better to directly generate the appropriate format from the internal SAP data directly to ensure maximum richness and structure. However, this should be considered as a last resort or if the solution is temporary.

On 17–19 July 2023, Zanders participated as a proud sponsor at the SAP Treasury conference in Chicago.
As the first conference in the US since its 4-year hiatus, there was good attendance among corporates and partners. The SAP Treasury conference is an excellent opportunity for customers to see the latest developments within the S/4 HANA Treasury suite.
Christian Mnich, VP and Head of Solution Management Treasury and Working Capital Management at SAP, gave the opening keynote titled: "SAP Opening Keynote: Increase Financial Resiliency with SAP Treasury and Working Capital Management Solutions."
Corporate Structure changes
Ronda De Groodt, Applications Integration Architect at Leprino Foods, presented a case study that covered how Leprino Foods embarked on a company-wide migration from SAP ECC to S/4HANA, specifically implementing SAP Treasury, Cash Management, and Payments solutions in a 6-month time frame. The presentation also had a focus on leveraging SAP S/4HANA Cash Management and SAP machine learning capabilities while migrating to S/4 HANA.
Trading Platform Integration
In a joint presentation, Justin Brimfield from ICD and Jonathon Kluding from SAP discussed the strategic partnership between the two companies in developing a streamlined Trading Platform Integration. This presentation went into detail on how SAP leverages Trading Platform Integration between SAP and ICD and the efficiencies this integration can create for Treasury.
Multi-Bank Connectivity (MBC)
Another area of focus at the conference was the capabilities of SAP Multi-Bank Connectivity and how it can simplify and automate financial processes associated while having multiple banks. This was presented by Kweku Biney-Assan from HanesBrands. The presentation focused on answering some crucial questions corporates may have about SAP MBC, ranging from the possible improvements MBC can make to your Treasury Operations and Cash Management processes, to the typical timeline for an implementation.
Cash Management & Liquidity Forecasting
Renee Fan from Freeport LNG, gave a presentation overviewing the challenges the company faced in terms of cash management, reporting, and analytics. She gave an overview of Freeport LNG’s Treasury Transformation Journey and insights into the upgrades they had made, as well as a further focus on the benefits they have seen as a result of their new cash and liquidity solution.
In addition, the conference offered attendees the opportunity to share ideas, build networks, and discuss topics face-to-face. All this made this edition of the event a success!

On 20-22 June 2023, Zanders joined the SAP Treasury conference in Amsterdam as proud sponsor.
Of the many attending corporates and partners were offered the opportunity to hear the latest ins and outs of treasury transformation with S/4HANA.
Next to the enhancements in S/4HANA Treasury, customers had a clear need to understand what it could means for their Treasury and how they could achieve it. The conference provided an excellent opportunity to exchange ideas with each other and learn from the many case studies presented on treasury transformation.
Treasury Transformation with SAP S/4HANA
Alongside Ernst Janssen, Digital Treasury and Banking Manager at dsm-firmenich, Zanders director Deepak Aggarwal presented the value drivers for treasury in an S/4HANA migration. The presentation also included the different target architecture and deployment options, as Ernst talked about the choices made at dsm-firmenich and the rationale behind them in a real-life business case study. Zanders has a long-standing relationship with DSM going back as far as 2001, and has supported them in a number of engagements within SAP treasury.
In addition, there were similar other presentations on treasury transformation with S/4HANA. BioNTech presented the case study on centralization of their bank connectivity via APIs for both inbound and outbound bank communication. They are also the first adopters of the new In-House Bank under Advanced Payment Management (APM) solution and integrate the Morgan Money trading platform for money market funds. ABB and PwC talked about their treasury transformation journey on centralization of cash management in a side-car, functionality enhancement through APM, and integration with Central Finance system for balance sheet FX management. Alter Domus and Deloitte presented their treasury transformation via S/4HANA Public Cloud including integrated market data feed and Multi-Bank Connectivity.
Digital and Streamlined Treasury Management System
Christian Mnich from SAP laid out the vision of SAP Treasury and Working Capital Management solution as an agile, resilient and sustainable solution delivering end-to-end business processes to all customers in all industries. Christian referred to the market challenges of high inflation and rising interest rates calling for a greater need of bank resiliency and cash forecasting to reduce dependencies on business partners and improve cash utilization while avoiding dipping into debt facilities. The sustainability duties like ESG reporting and carbon offsetting appear to be more relevant than ever to meet global assignments. SAP’s 2023 product strategy was presented with Cloud ERP (public or private) at the core, Business Technology Platform as integration and extension layer, and the surrounding SAP and ecosystem applications, delivering end-to-end integrated processes to the business.
Trading Platform Integration
Another focus area was SAP Integration with ICD for Money Market Funds (MMFs) through Trading Platform Integration (TPI) application. MMFs are seen as an attractive alternative to deposits, yielding better returns and diversifying risk through investment in multiple counterparties. Quite often the business is restricted on MMF dealing as a result of system limitations and overhead due to the manual processes. Integration with ICD via TPI offers benefits of single sign on, automated mapping from ICD to SAP Treasury, auto-creation of securities transaction in SAP, email notification and integrated reporting in SAP Treasury.
Embedded Receivables Finance
Lastly, SAP integration with Taulia was another focus area to facilitate liquidity management in the companies. Taulia was presented as driving Working Capital Management (WCM) in the companies through its WCM platform and Taulia Multi Funder for efficient share of wallet or discovery of new liquidity. The embedded receivables finance solution in Taulia automates the receivables sales process by automating the status updates of all invoices in Taulia platform and the seller ERP.
If you are interested in joining SAP Treasury conferences in future, or any of the topics covered, please do reach out to your Zanders’ contacts.


In this article, we will delve deeper into some of the key offerings of SAP BTP for treasury and explore how it can contribute to driving innovation within treasury.
The SAP Business Technology Platform (BTP) is not just a standalone product or a conventional module within SAP's suite of ERP systems; rather, it serves as a strategic platform from SAP, serving as the foundational underpinning for all company-wide innovations. In this article, we will delve deeper into some of the key offerings of SAP BTP for treasury and explore how it can contribute to driving innovation within treasury.
The platform is designed to offer a versatile array of tools and services, aiming to enhance, extend, and seamlessly integrate with your existing SAP systems and other applications. Ultimately enabling a more efficient realization of your business objectives, delivering enhanced operational efficacy and flexibility.
Analytics and AI
One of the standout features of SAP BTP for treasury is its analytics and planning solution, SAP Analytics Cloud (SAC). This feature seamlessly connects with different data sources and other SAP applications. It supports Extended Planning & Analysis and Predictive Planning using machine learning models.
At the core of SAC, various planning areas – like finance, supply chain, and workforce – are combined into a cloud-based interconnected plan. This plan is based on a single version of the truth, bringing planning content together. Enhanced by predictive AI and ML models, the plan achieves more accurate forecasting and supports near-real-time planning. Users can also compare different scenarios and perform what-if analysis to evaluate the impact of changes on the plan equipping organizations to prepare for uncertainties effectively.
Application Development and Integration
An organization's treasury architecture landscape often involves numerous systems, custom applications, and enhancements. However, this complexity can result in challenges related to maintenance, technical debt, and operational efficiency.
Addressing these challenges, SAP BTP offers a solution known as the SAP Build apps tool. The tool enables users to adapt standard functionalities and create custom business applications through intuitive no-code/low-code tools. This allows that all custom development takes place outside your SAP ERP system, thereby preserving a ‘clean core’ of your SAP system. This will allow for a simpler, more streamlined maintenance process and a reduced risk of compatibility issues when upgrading to newer versions of SAP.
In addition, SAP BTP facilitates seamless connectivity through a range of connectors and APIs integrated within the SAP Integration Suite. Enabling a harmonious integration of data and processes across diverse systems and applications, whether they are on-premise or cloud-based.
Process Automation and Workflow Management
Efficient process automation and workflow management play a pivotal role in enhancing treasury operations. SAP BTP offers an efficient solution named SAP Build Process Automation which enables users to design and oversee business processes using either low-code or no-code methods. It combines workflow management, robotic process automation, decision management, process visibility, and AI capabilities, all consolidated within a user-friendly interface.
A significant advantage of SAP BTP's workflow approach over conventional SAP workflows is the unification of workflows across diverse systems, including non-SAP systems and increased flexibility, enabling smoother interaction between processes and systems.
The integration of SAP BTP for workflow with different SAP modules such as TRM, IHC, BAM is facilitated through the SAP Workflow Management APIs within your SAP S/4 HANA system.
In the context of treasury functions, SAP Build Process Automation proves invaluable for automating and refining diverse processes such as cash management, risk management, liquidity planning, payment processing, and reporting. For instance, users can leverage the integrated AI functionalities for tasks like collecting bank statements/account balance information from different systems, consolidating information, saving and/or distributing the cash position information to the appropriate people and systems. Furthermore, the automation recorder can be employed to mechanize the extraction and input of data from diverse systems. Finally, the SAP Build Process Automation can also be utilized to create workflows for complex payment approval scenarios, including exceptions and escalations.
Extensions to the Treasury Ecosystem
SAP BTP extends the treasury ecosystem with multiple treasury-specific developed solutions, seamlessly enhancing your treasury SAP S/4 HANA system functionality. These extensions include: Multi-Bank Connectivity for simplified and secure banking interactions, SAP Digital Payment Add-On for efficiently connecting to payment service providers. Trading Platform Integration for streamlined financial instrument trading, SAP Cloud for Credit Integration to assess business partner credit risk, SAP Taulia for Working Capital Management, Cash Application for automatic bank statement processing and cash application, and lastly, SAP Market Rates Management for the reliable retrieving of market data.
Empowering organizations with extensive treasury needs by enabling them to selectively adopt these value-added capabilities and solutions offered by SAP.
Alternatives to SAP BTP
The primary driving factor to consider integrating SAP BTP as an addon to your SAP ERP is when there is an integrated company-wide approach towards adopting BTP. Furthermore, if the standard SAP functionalities fall short of meeting the specific demands of the treasury department, or if the need for seamless integration with other systems arises.
It's important to prioritize the optimization of complex processes whenever feasible first, avoiding the pitfall of optimizing inherently flawed processes using advanced technologies such as SAP BTP. It is worth noting that the standard SAP functionality, which is already substantial, could very well suffice. Consequently, we recommend conducting an analysis of your processes first, utilizing the Zanders best practices process taxonomy, before deciding on possible technology solutions.
Ultimately, while considering technology options, it's wise to explore offerings from best-of-breed treasury solution providers as well – keeping in mind the potential need for integration with SAP.
Getting Started
The above highlights just a glimpse of SAP BTP's capabilities. SAP offers a free trial that allows users to explore its services. Instead of starting from scratch, you can leverage predefined business content such as intelligent RPA bots, workflow packages, predefined decision and business rules and over 170 open connectors with third-party products to get inspired. Some examples relevant for treasury include integration with Trading Brokers, S4HANA SAP Analytics Cloud, workflows designed for managing free-form payments and credit memos, as well as connectors linking to various accounting systems such as Netsuite Finance, Microsoft Dynamics, and Sage.
Conclusion
SAP BTP for Treasury is a powerful platform that can significantly enhance treasury. Its advanced analytics, app development and integration, and process automation capabilities enable organizations to gain valuable insights, automate tasks, and improve overall efficiency. If you are looking to revolutionize your treasury operations, SAP BTP is a compelling option to consider.

Seamless and automated connectivity between a Treasury Management System (TMS) and banks has always been an arduous task to accomplish.
Treasurers dealing with multiple jurisdictions, scattered banking landscape, and local requirements face many challenges in this regard. Japan is one of the markets where bank connectivity is indeed a challenge, especially when it comes to connecting with local banks.
Traditional options
The initial reaction from treasurers not familiar with local market conventions might be to seek connection through the SWIFT network. However, in Japan only a handful of banks offer SWIFT connectivity. Second natural choice is the Host-to-Host connection (H2H). This is the classic File Transfer Protocol (FTP), or preferably the secured version (sFTP) setup. Some will say old fashioned, rather than classic, since it is as old as the internet. Nonetheless, it is still popular, and frankly quite often the best fit for the purpose. However, if there are dozens of local banks to connect to, it can be difficult to be expected to connect to each of them with a direct H2H. While this could be technically feasible, it would be nothing short of a nightmare to maintain, with the initial setup being time-consuming in the first place.
Other solutions
There is an answer, or should we rather say ANSER, to this question. ANSER, an abbreviation of ‘Automatic answer Network System for Electrical Request’, is a data transfer system provided by NTT Data Corporation since 1981, which links banks with firms.[1] ANSER then is a way to connect a corporate client to the bank. The system has been around for a while, and together with Cash Management Service (CMS) centers it is a part of the so-called Firm Banking solution in Japan. Since its inception, ANSER offered a wider range of services, through which corporates could access their banking information. Among the offered channels are telephone, fax, firm banking terminal, and personal computer. With the ever-increasing need for speedy and accurate information exchange, the more traditional ways, such as telephone and fax, gave way to the more sophisticated and automated solution, namely eBAgent.
eBAgent making use of API
The said eBAgent is a proprietary middleware platform offered by NTT Data. The solution establishes an automated connection with banks through the above-mentioned ANSER network. In short, eBAgent offers a gateway to multiple local banking partners in Japan utilizing the ANSER network. The remaining part for the corporate is then to establish a connection between the TMS and eBAgent, and secure appropriate contracts with the eBAgent provider, NTT Data, as well as the banks.
As for the connection protocol, the choice is between the classic sFTP, or Application Programming Interface (API). The latter has the real-time advantage, with less lag between the pick-and-drop sFTP connection. API seems to be a choice for an increasing number of corporates these days in this area. What is also interesting, apart from the API connection, are the supported formats for transfers and bank statements. In addition to the local Japanese ZENGIN, the protocol also offers data transmission in a proprietary XML format. This XML format is actually quite simple, with a very limited amount of tags. In addition to this, unlike the ISO 20022 standard, it contains only one level of tags, without the nesting function. Depending on the exact ERP/TMS infrastructure, eBAgent can also provide conversion services from and to the IS 20022 standard. As for the connection to eBAgent, the whole setup seems easier said than done. However, some TMS providers, in response to the demand from the market, started offering off-the-shelf solutions for a plug-and-play connection to eBAgent. Kyriba and Reval already offer it, with SAP set to roll out its solution on the S/4HANA and Multi Bank Connectivity (MBC) platform in early 2024.
Various ways to connect TMS / ERP with banks in Japan
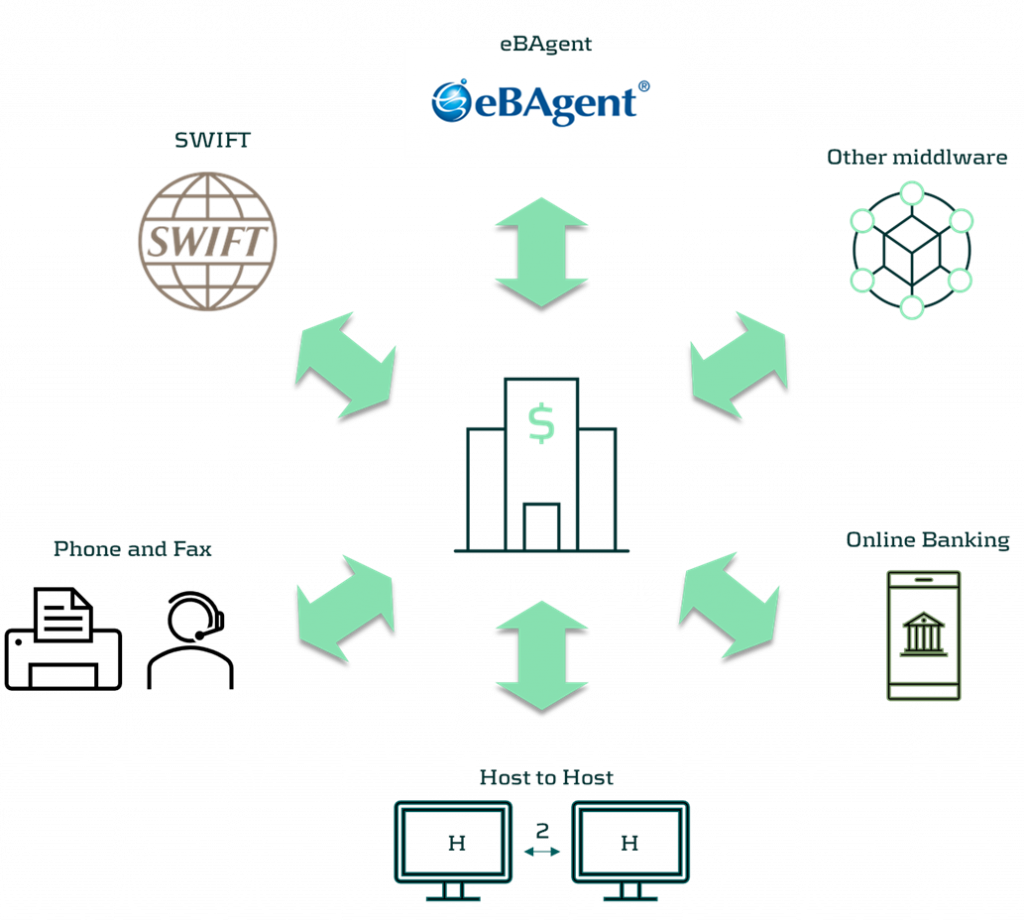
How to connect with local banks in Japan?
It all depends on the exact landscape of banks and systems. It may just as well turn out that a hybrid solution would be best suited. There is no one-size fits all, as each corporate is unique, thus careful consideration and design will be paramount for a stable and reliable connection with banks. One thing is certain, solutions that involve obtaining bank statement information and enact payments by telephone or fax are simply no longer sufficient. In this day and age, when much sensitive information is exchanged between corporates and banks, having a reliable, automated solution is indispensable.
Learn more about Zanders' Japan office
If you would like to know more, do not hesitate to get in touch with Michal Zelazko via [email protected] or via + 81 (0) 8 3255 9966
[1] https://www.boj.or.jp/en/paym/outline/pay_boj/pss0305a.pdf


