

Are you leveraging the SAP Credit Risk Analyzer to its full potential?
While many business and SAP users are familiar with its core functionalities, such as limit management applying different limit types and the core functionality of attributable amount determination, several less known SAP standard features can enhance your credit risk management processes.
In this article, we will explore these hidden gems, such as Group Business Partners and the ways to manage the limit utilizations using manual reservations and collateral.
Group Business Partner Use
One of the powerful yet often overlooked features of the SAP Credit Risk Analyzer is the ability to use Group Business Partners (BP). This functionality allows you to manage credit and settlement risk at a bank group level rather than at an individual transactional BP level. By consolidating credit and settlement exposure for related entities under a single group business partner, you can gain a holistic view of the risks associated with an entire banking group. This is particularly beneficial for organizations dealing with banking corporations globally and allocating a certain amount of credit/settlement exposure to banking groups. It is important to note that credit ratings are often reflected at the group bank level. Therefore, the use of Group BPs can be extended even further with the inclusion of credit ratings, such as S&P, Fitch, etc.
Configuration: Define the business partner relationship by selecting the proper relationship category (e.g., Subsidiary of) and setting the Attribute Direction to "Also count transactions from Partner 1 towards Partner 2," where Partner 2 is the group BP.
Master Data: Group BPs can be defined in the SAP Business Partner master data (t-code BP). Ensure that all related local transactional BPs are added in the relationship to the appropriate group business partner. Make sure the validity period of the BP relationship is valid. Risk limits are created using the group BP instead of the transactional BP.
Reporting: Limit utilization (t-code TBLB) is consolidated at the group BP level. Detailed utilization lines show the transactional BP, which can be used to build multiple report variants to break down the limit utilization by transactional BP (per country, region, etc.).
Having explored the benefits of using Group Business Partners, another feature that offers significant flexibility in managing credit risk is the use of manual reservations and collateral contracts.
Use of Manual Reservations
Manual reservations in the SAP Credit Risk Analyzer provide an additional layer of flexibility in managing limit utilization. This feature allows risk managers to manually add a portion of the credit/settlement utilization for specific purposes or transactions, ensuring that critical operations are not hindered by unexpected credit or settlement exposure. It is often used as a workaround for issues such as market data problems, when SAP is not able to calculate the NPV, or for complex financial instruments not yet supported in the Treasury Risk Management (TRM) or Credit Risk Analyzer (CRA) settings.
Configuration: Apart from basic settings in the limit management, no extra settings are required in SAP standard, making the use of reservations simpler.
Master data: Use transaction codes such as TLR1 to TLR3 to create, change, and display the reservations, and TLR4 to collectively process them. Define the reservation amount, specify the validity period, and assign it to the relevant business partner, transaction, limit product group, portfolio, etc. Prior to saving the reservation, check in which limits your reservation will be reflected to avoid having any idle or misused reservations in SAP.
While manual reservations provide a significant boost to flexibility in limit management, another critical aspect of credit risk management is the handling of collateral.
Collateral
Collateral agreements are a fundamental aspect of credit risk management, providing security against potential defaults. The SAP Credit Risk Analyzer offers functionality for managing collateral agreements, enabling corporates to track and value collateral effectively. This ensures that the collateral provided is sufficient to cover the exposure, thus reducing the risk of loss.
SAP TRM supports two levels of collateral agreements:
- Single-transaction-related collateral
- Collateral agreements.
Both levels are used to reduce the risk at the level of attributable amounts, thereby reducing the utilization of limits.
Single-transaction-related collateral: SAP distinguishes three types of collateral value categories:
- Percentual collateralization
- Collateralization using a collateral amount
- Collateralization using securities
Configuration: configure collateral types and collateral priorities, define collateral valuation rules, and set up the netting group.
Master Data: Use t-code KLSI01_CFM to create collateral provisions at the appropriate level and value. Then, this provision ID can be added to the financial object.
Reporting: both manual reservations and collateral agreements are visible in the limit utilization report as stand- alone utilization items.
By leveraging these advanced features, businesses can significantly enhance their risk management processes.
Conclusion
The SAP Credit Risk Analyzer is a comprehensive tool that offers much more than meets the eye. By leveraging its hidden functionalities, such as Group Business Partner use, manual reservations, and collateral agreements, businesses can significantly enhance their credit risk management processes. These features not only provide greater flexibility and control but also ensure a more holistic and robust approach to managing credit risk. As organizations continue to navigate the complexities of the financial landscape, unlocking the full potential of the SAP Credit Risk Analyzer can be a game-changer in achieving effective risk management.
If you have questions or are keen to see the functionality in our Zanders SAP Demo system, please feel free to contact Aleksei Abakumov or any Zanders SAP consultant.


We explore how the Bayesian Gaussian Process Classifier (GPC) injects much needed agility and interpretability into default modeling.
In brief:
- Prevailing uncertainty in geopolitical, economic and regulatory environments demands a more dynamic approach to default modeling.
- Traditional methods such as logistic regression fail to address the non-linear characteristics of credit risk.
- Score-based models can be cumbersome to calibrate with expertise and can lack the insight of human wisdom.
- Machine learning lacks the interpretability expected in a world where transparency is paramount.
- Using the Bayesian Gaussian Process Classifier defines lending parameters in a more holistic way, sharpening a bank’s ability to approve creditworthy borrowers and reject proposals from counterparties that are at a high risk of default.
Historically high levels of economic volatility, persistent geopolitical unrest, a fast-evolving regulatory environment – a perpetual stream of disruption is highlighting the limitations and vulnerabilities in many credit risk approaches. In an era where uncertainty persists, predicting risk of default is becoming increasingly complex, and banks are increasingly seeking a modeling approach that incorporates more flexibility, interpretability, and efficiency.
While logistic regression remains the market standard, the evolution of the digital treasury is arming risk managers with a more varied toolkit of methodologies, including those powered by machine learning. This article focuses on the Bayesian Gaussian Process Classifier (GPC) and the merits it offers compared to machine learning, score-based models, and logistic regression.
A non-parametric alternative to logistic regression
The days of approaching credit risk in a linear, one-dimensional fashion are numbered. In today’s fast paced and uncertain world, to remain resilient to rising credit risk, banks have no choice other than to consider all directions at once. With the GPC approach, the linear combination of explanatory variables is replaced by a function, which is iteratively updated by applying Bayes’ rule (see Bayesian Classification With Gaussian Processes for further detail).
For default modeling, a multivariate Gaussian distribution is used, hence forsaking linearity. This allows the GPC to parallel machine learning (ML) methodologies, specifically in terms of flexibility to incorporate a variety of data types and variables and capability to capture complex patterns hidden within financial datasets.
A model enriched by expert wisdom
Another way GPC shows similar characteristics to machine learning is in how it loosens the rigid assumptions that are characteristic of many traditional approaches, including logistic regression and score-based models. To explain, one example is the score-based Corporate Rating Model (CRM) developed by Zanders. This is the go-to model of Zanders to assess the creditworthiness of corporate counterparties. However, calibrating this model and embedding the opinion of Zanders’ corporate rating experts is a time-consuming task. The GPC approach streamlines this process significantly, delivering both greater cost- and time-efficiencies. The incorporation of prior beliefs via Bayesian inference permits the integration of expert knowledge into the model, allowing it to reflect predetermined views on the importance of certain variables. As a result, the efficiency gains achieved through the GPC approach don’t come at the cost of expert wisdom.
Enabling explainable lending decisions
As well as our go-to CRM, Zanders also houses machine learning approaches to default modeling. Although this generates successful outcomes, with machine learning, the rationale behind a credit decision is not explicitly explained. In today’s volatile environment, an unexplainable solution can fall short of stakeholder and regulator expectations – they increasingly want to understand the reasoning behind lending decisions at a forensic level.
Unlike the often ‘black-box’ nature of ML models, with GPC, the path to a decision or solution is both transparent and explainable. Firstly, the GPC model’s hyperparameters provide insights into the relevance and interplay of explanatory variables with the predicted outcome. In addition, the Bayesian framework sheds light on the uncertainty surrounding each hyperparameter. This offers a posterior distribution that quantifies confidence in these parameter estimates. This aspect adds substantial risk assessment value, contrary to the typical point estimate outputs from score-based models or deterministic ML predictions. In short, an essential advantage of the GPC over other approaches is its ability to generate outcomes that withstand the scrutiny of stakeholders and regulators.
A more holistic approach to probability of default modeling
In summary, if risk managers are to tackle the mounting complexity of evaluating probability of default, they need to approach it non-linearly and in a way that’s explainable at every level of the process. This is throwing the spotlight onto more holistic approaches, such as the Gaussian Process Classifier. Using this methodology allows for the incorporation of expert intuition as an additional layer to empirical evidence. It is transparent and accelerates calibration without forsaking performance. This presents an approach that not only incorporates the full complexity of credit risk but also adheres to the demands for model interpretability within the financial sector.
Are you interested in how you could use GPC to enhance your approach to default modeling? Contact Kyle Gartner for more information.

Commodity risk management has become a top CFO priority in some companies recently. Mastering commodity risk requires an integrated approach across business functions. SAP’s comprehensive solution can make a difference.
The recent periods of commodity price volatility have brought commodity risk management to the spotlight in numerous companies, where commodities constitute a substantial component of the final product, but pricing arrangements prevented a substantial hit of the bottom line in the past calm periods.
Understanding Commodity Risk Management is ingrained in the individual steps of the whole value chain, encompassing various business functions with different responsibilities. Purchasing is responsible for negotiating with the suppliers: the sales or pricing department negotiates the conditions with the customers; and Treasury is responsible for negotiating with the banks to secure financing and eventually hedge the commodity risk on the derivatives market. Controlling should have clarity about the complete value chain flow and make sure the margin is protected. Commodity risk management should be a top item on the CFO's list nowadays.
SAP's Solution: A Comprehensive Overview

Each of these functions need to be supported with adequate information system functionality and integrated well together, bridging the physical supply chain flows with financial risk management.
SAP, as the leading provider of both ERP and Treasury and risk management systems, offers numerous functionalities to cover the individual parts of the process. The current solution is the result of almost two decades of functional evolution. The first functionalities were released in 2008 on the ECC 6.04 version to support commodity price risk in the metal business. The current portfolio supports industry solutions for agriculture, oil, and gas, as well as the metal business. Support for power trading is considered for the future. In the recent releases of S/4HANA, many components have been redeveloped to reflect the experience from the existing client implementations, to better cover the trading and hedging workflow, and to leverage the most recent SAP technological innovations, like HANA database and the ABAP RESTful Application Programming Model (RAP).
Functionalities of SAP Commodity Management
Let us take you on a quick journey through the available functionalities.
The SAP Commodity Management solution covers commodity procurement and commodity sales in an end-to-end process, feeding the data for commodity risk positions to support commodity risk management as a dedicated function. In the logistics process, it offers both contracts and orders with commodity pricing components, which can directly be captured through the integrated Commodity Price Engine (CPE). In some commodity markets, products need to be invoiced before the final price is determined based on market prices. For this scenario, provisional and differential invoicing are available in the solution.
The CPE allows users to define complex formulas based on various commodity market prices (futures or spot prices from various quotation sources), currency exchange translation rules, quality and delivery condition surcharges, and rounding rules. The CPE conditions control how the formula results are calculated from term results, e.g., sum, the highest value, provisional versus final term. Compound pricing conditions can be replicated using routines: Splitting routines define how the formula quantity will be split into multiple terms, while Combination routines define how multiple terms will be combined together to get the final values.
Pricing conditions from active contracts and orders for physical delivery of commodities constitute the physical exposure position. Whether in procurement, in a dedicated commodity risk management department, or in the treasury department, real-time recognition and management of the company’s commodity risk positions rely on accurate and reliable data sources and evaluation functionalities. This is provided by the SAP Commodity Risk Management solution. Leveraging the mature functionalities and components of the Treasury and Risk Management module, it allows for managing paper trades to hedge the determined physical commodity risk position. Namely, listed and OTC commodity derivatives are supported. In the OTC area, swaps, forwards, and options, including the Asian variants with average pricing periods, are well covered. These instruments fully integrate into the front office, back office, and accounting functionalities of the existing mature treasury module, allowing for integrated and seamless processing. The positions in the paper deals can be included within the existing Credit Risk Analyser for counterparty risk limit evaluation as well as in the Market Risk Analyser for complex market risk calculations and simulations.
Managing Commodity Exposures
Physical commodity exposure and paper deals are bundled together via the harmonized commodity master data Derivative Contract Specification (DCS), representing individual commodities traded on specific exchanges or spot markets. It allows for translating the volume information of the physical commodity to traded paper contracts and price quotation sources.
In companies with extensive derivative positions, broker statement reconciliation can be automated via the recent product SAP Broker Reconciliation for Commodity Derivatives. This cloud-based solution is natively integrated into the SAP backend to retrieve the derivative positions. It allows for the automatic import of electronic brokers' statements and automates the reconciliation process to investigate and resolve deviations with less human intervention.
To support centralized hedging with listed derivatives, the Derivative Order and Trade execution component has been introduced. It supports a workflow in which an internal organizational unit raises a Commodity Order request, which in turn is reviewed and then fully or partially fulfilled by the trader in the external market.
Innovations in SAP Commodity Management
Significant innovations were released in the S/4HANA 2022 version.
The Commodity Hedge Cockpit supports the trader view and hedging workflow.
In the area of OTC derivatives (namely commodity swaps and commodity forwards), the internal trading and hedging workflow can be supported by Commodity Price Risk Hedge Accounting. It allows for separating various hedging programs through Commodity Hedging areas and defining various Commodity Hedge books. Within the Hedge books, Hedge specifications allow for the definition of rules for concluding financial trades to hedge commodity price exposures, e.g., by defining delivery period rules, hedge quotas, and rules for order utilization sequence. Individual trade orders are defined within the Hedge specification. Intercompany (on behalf of) trading is supported by the automatic creation of intercompany mirror deals, if applicable.
Settings under the hedge book allow for automatically designating cash flow hedge relationships in accordance with IFRS 9 principles, documenting the hedge relationships, running effectiveness checks, using valuation functions, and generating hedge accounting entries. All these functions are integrated into the existing hedge accounting functionalities for FX risk available in SAP Treasury and Risk Management.
The underlying physical commodity exposure can be uploaded as planned data reflecting the planned demand or supply from supply chain functions. The resulting commodity exposure can be further managed (revised, rejected, released), or additional commodity exposure data can be manually entered. If the physical commodity exposure leads to FX exposure, it can be handed over to the Treasury team via the automated creation of Raw exposures in Exposure Management 2.0.
Modelled deals allow for capturing hypothetical deals with no impact on financial accounting. They allow for evaluating commodity price risk for use cases like exposure impact from production forecasts, mark-to-intent for an inventory position (time, location, product), and capturing inter-strategy or late/backdated deals.
Even though a separate team can be responsible for commodity risk management (front office) - and it usually is - bundling together the back office and accounting operations under an integrated middle and back office team can help to substantially streamline the daily operations.
Last but not least, the physical commodity business is usually financed by trade finance instruments. SAP has integrated Letters-of-Credit, as well as Guarantees into the Treasury module and enhanced the functionality greatly in 2016.
All-in-all, every commodity-driven business, upstream or downstream, consumer or producer, works under different setups and business arrangements. The wide variety of available functionalities allows us to define the right solution for every constellation. Especially with commodity management functionalities active in the supply chain modules of the ERP system, SAP commodity risk management can offer a lot of efficiencies in an integrated and streamlined solution. We are happy to accompany you on the journey of defining the best solution for your enterprise.

We investigate different model options for prepayments, among which survival analysis
In brief
- Prepayment modeling can help institutions successfully prepare for and navigate a rise in prepayments due to changes in the financial landscape.
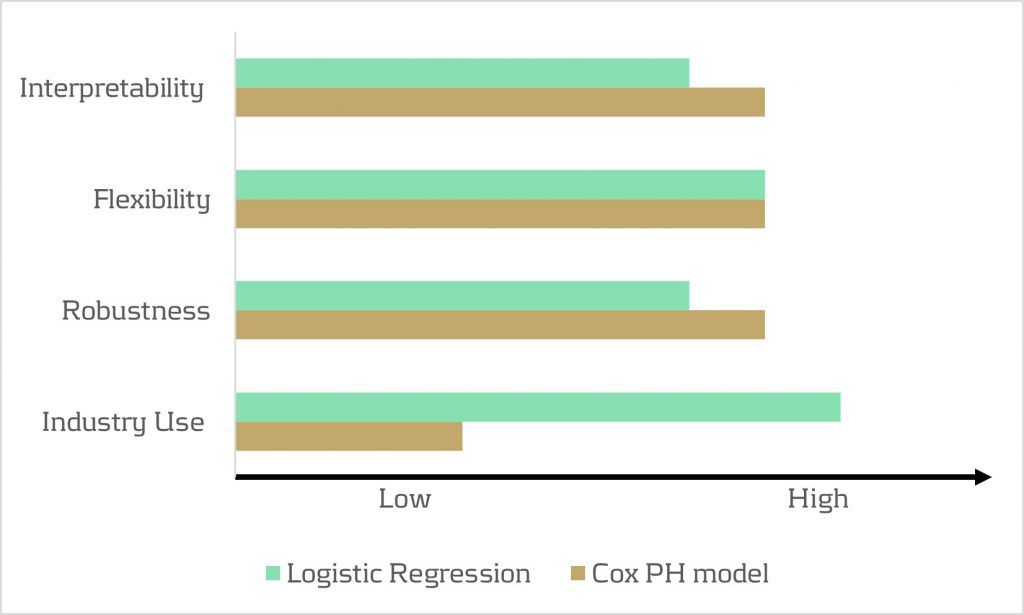
- Two important prepayment modeling types are highlighted and compared: logistic regression vs Cox Proportional Hazard.
- Although the Cox Proportional Hazard model is theoretically preferred under specific conditions, the logical regression is preferred in practice under many scenarios.
The borrowers' option to prepay on their loan induces uncertainty for lenders. How can lenders protect themselves against this uncertainty? Various prepayment modeling approaches can be selected, with option risk and survival analyses being the main alternatives under discussion.
Prepayment options in financial products spell danger for institutions. They inject uncertainty into mortgage portfolios and threaten fixed-rate products with volatile cashflows. To safeguard against losses and stabilize income, institutions must master precise prepayment modeling.
This article delves into the nuances and options regarding the modeling of mortgage prepayments (a cornerstone of Asset Liability Management (ALM)) with a specific focus on survival models.
Understanding the influences on prepayment dynamics
Prepayments are triggered by a range of factors – everything from refinancing opportunities to life changes, such as selling a house due to divorce or moving. These motivations can be grouped into three overarching categories: refinancing factors, macroeconomic factors, and loan-specific factors.
- Refinancing factors
This encompasses key financial drivers (such as interest rates, mortgage rates and penalties) and loan-specific information (including interest rate reset dates and the interest rate differential for the customer). Additionally, the historical momentum of rates and the steepness of the yield curve play crucial roles in shaping refinancing motivations. - Macro-economic factors
The overall state of the economy and the conditions of the housing market are pivotal forces on a borrower's inclination to exercise prepayment options. Furthermore, seasonality adds another layer of variability, with prepayments being notably higher in certain months. For example, in December, when clients have additional funds due to payment of year-end bonusses and holiday budgets. - Loan-specific factors
The age of the mortgage, type of mortgage, and the nature of the property all contribute to prepayment behavior. The seasoning effect, where the probability of prepayment increases with the age of the mortgage, stands out as a paramount factor.
These factors intricately weave together, shaping the landscape in which customers make decisions regarding prepayments. Prepayment modeling plays a vital role in helping institutions to predict the impact of these factors on prepayment behavior.
The evolution of prepayment modeling
Research on prepayment modeling originated in the 1980s and initially centered around option-theoretic models that assume rational customer behavior. Over time, empirical models that cater for customer irrationality have emerged and gained prominence. These models aim to capture the more nuanced behavior of customers by explaining the relationship between prepayment rates and various other factors. In this article, we highlight two important types of prepayment models: logistic regression and Cox Proportional Hazard (Survival Model).
Logistic regression
Logistic regression, specifically its logit or probit variant, is widely employed in prepayment analysis. This is largely because it caters for the binary nature of the dependent variable indicating the occurrence of prepayment events and it moreover flexible. That is, the model can incorporate mortgage-specific and overall economic factors as regressors and can handle time-varying factors and a mix of continuous and categorical variables.
Once the logistic regression model is fitted to historical data, its application involves inputting the characteristics of a new mortgage and relevant economic factors. The model’s output provides the probability of the mortgage undergoing prepayment. This approach is already prevalent in banking practices, and frequently employed in areas such as default modeling and credit scoring. Consequently, it’s favored by many practitioners for prepayment modeling.
Despite its widespread use, the model has drawbacks. While its familiarity in banking scenarios offers simplicity in implementation, it lacks the interpretability characteristic of the Proportional Hazard model discussed below. Furthermore, in terms of robustness, a minimal drawback is that any month-on-month change in results can be caused by numerous factors, which all affect each other.
Cox Proportional Hazard (Survival model)
The Cox Proportional Hazard (PH) model, developed by Sir David Cox in 1972, is one of the most popular models in survival analysis. It consists of two core parts:
- Survival time. With the Cox PH model, the variable of interest is the time to event. As the model stems from medical sciences, this event is typically defined as death. The time variable is referred to as survival time because it’s the time a subject has survived over some follow-up period.
- Hazard rate. This is the distribution of the survival time and is used to predict the probability of the event occurring in the next small-time interval, given that the event has not occurred beforehand. This hazard rate is modelled based on the baseline hazard (the time development of the hazard rate of an average patient) and a multiplier (the effect of patient-specific variables, such as age and gender). An important property of the model is that the baseline hazard is an unspecified function.
To explain how this works in the context of prepayment modeling for mortgages:
- The event of interest is the prepayment of a mortgage.
- The hazard rate is the probability of a prepayment occurring in the next month, given that the mortgage has not been prepaid beforehand. Since the model estimates hazard rates of individual mortgages, it’s modelled using loan-level data.
- The baseline hazard is the typical prepayment behavior of a mortgage over time and captures the seasoning effect of the mortgage.
- The multiplier of the hazard rate is based on mortgage-specific variables, such as the interest rate differential and seasonality.
For full prepayments, where the mortgage is terminated after the event, the Cox PH model applies in its primary format. However, partial prepayments (where the event is recurring) require an extended version, known as the recurrent event PH model. As a result, when using the Cox PH model, , the modeling of partial and full prepayments should be conducted separately, using slightly different models.
The attractiveness of the Cox PH model is due to several features:
- The interpretability of the model. The model makes it possible to quantify the influence of various factors on the likelihood of prepayment in an intuitive way.
- The flexibility of the model. The model offers the flexibility to handle time-varying factors and a mix of continuous and categorical variables, as well as the ability to incorporate recurrent events.
- The multiplier means the hazard rate can’t be negative. The exponential nature of mortgage-specific variables ensures non-negative estimated hazard rates.
Despite the advantages listed above presenting a compelling theoretical case for using the Cox PH model, it faces limited adoption in practical prepayment modeling by banks. This is primarily due to its perceived complexity and unfamiliarity. In addition, when loan-level data is unavailable, the Cox PH model is no longer an option for prepayment modeling.
Logistic regression vs Cox Proportional Hazard
In scenarios with individual survival time data and censored observations, the Cox PH model is theoretically preferred over logistic regression. This preference arises because the Cox PH model leverages this additional information, whereas logistic regression focuses solely on binary outcomes, disregarding survival time and censoring.
However, practical considerations also come into play. Research shows that in certain cases, the logistic regression model closely approximates the results of the Cox PH model, particularly when hazard rates are low. Given that prepayments in the Netherlands are around 3-10% and associated hazard rates tend to be low, the performance gap between logistic regression and the Cox PH model is minimal in practice for this application. Also, the necessity to create a different PH model for full and partial prepayment adds an additional burden on ALM teams.
In conclusion, when faced with the absence of loan-level data, the logistic regression model emerges as a pragmatic choice for prepayment modeling. Despite the theoretical preference for the Cox PH model under specific conditions, the real-world performance similarities, coupled with the familiarity and simplicity of logistic regression, provide a practical advantage in many scenarios.
How can Zanders support?
Zanders is a thought leader on IRRBB-related topics. We enable banks to achieve both regulatory compliance and strategic risk goals by offering support from strategy to implementation. This includes risk identification, formulating a risk strategy, setting up an IRRBB governance and framework, and policy or risk appetite statements. Moreover, we have an extensive track record in IRRBB and behavioral models such as prepayment models, hedging strategies, and calculating risk metrics, both from model development and model validation perspectives.
Are you interested in IRRBB-related topics such as prepayments? Contact Jaap Karelse, Erik Vijlbrief, Petra van Meel (Netherlands, Belgium and Nordic countries) or Martijn Wycisk (DACH region) for more information.

Mergers, divestments, and other M&A activities reshape Treasury management, posing strategic challenges for Treasurers as they navigate disentanglement and build Treasury functions for stand-alone companies.
The corporate landscape is continuously reshaped by strategic realignments such as mergers, divestments, and other M&A activities, wherein a company divests a portion of its business or acquires other businesses to refocus its operations or unlock shareholder value. These transactions greatly affect Treasury management, influencing cash flow, banking structures, financial risk management, financing, and technology. This article explores the challenges Treasurers face during the disentanglement or carve-out process, emphasizing the need for strategic realignment of Treasury activities and focusing on the Treasury perspective of a divesting company. It acknowledges the transitional complexities that arise and the demand for agile response strategies to safeguard against financial instability. We will have a look at the special carve-out situation of building a Treasury function for a stand-alone company in a second part of this article.
Treasury Challenges in Carve-Out Situations
In the dynamic world of corporate restructuring, carve-outs present both a new frontier of opportunity and a multifaceted challenge for Treasurers. While divesting a part of an organization can streamline focus and potentially increase shareholder value, it can place unique pressures on treasury management to reassess and realign financial strategies.
When a corporation decides to execute a carve-out, the Treasury immediately takes on the critical task of separating financial operations and managing transitional service agreements. From the perspective of the divesting company, preserving liquidity and ensuring compliance with financial covenants is a key priority. This intricate division process demands the disentanglement of complex cash flows, re-evaluation and unwinding of cash pooling and internal as well as external debt structures, as well as a review of financial risk and investment policies. Such an endeavour requires rigorous planning and flawless execution to ensure that operational continuity is maintained. Additionally, it requires going into the details, such as the allocation of planning objects (e.g., vendor contracts, machines, vehicles) to the right business for purposes of liquidity forecasting.
Our experience shows that factors like company revenue, industry complexity, and operating countries affect the volume and frequency of treasury transactions. This can increase complexity and workload, especially for intricate transactions. An interesting remark is that carve-out transactions also impact the remaining group. Potentially, the geographic footprint is smaller, or the number of individual business models within the group is less than before – with a significant impact on Treasury.
The Role of Technology in Carve-Outs
A key component in the disentanglement process is represented by Treasury technology. In evaluating treasury technology during a carve-out, scrutiny of the landscape and meticulous planning are paramount to ensuring a smooth transition. The systems must not only handle specific needs such as segmenting data, independent entity reporting, and tracking discrete cash flows and risks, but they must also facilitate a seamless detachment and swift reconfiguration for the newly autonomous entities in the course of the disentanglement of a business. It is essential that these systems support operational independence and continuity with minimal disruptions during the restructuring process.
Implementing the right technology for the new entity, e.g., to cover stand-alone requirements, is crucial. It must meet current transaction needs and be robust enough to handle future demands. Given our breadth of experience across various technological domains and in various M&A scenarios, we have enriched many discussions on which solutions possess the adaptability and scalability necessary to accommodate the evolving needs of a redefined business. 'Right-sizing' the systems, structures, and processes, tailored specifically to the unique contours of the carved-out entity, is a decisive factor for laying the groundwork for sustainable success post-divestiture.
Strategic Realignment for Treasury
Any M&A transaction significantly changes the Treasury Process Map for both the remaining group and the carved-out entity. It has inherited risk and different risk types. We think that Treasury should deal with operational risks first, such as filling resource needs and/or stabilizing business operations. The resource issue requires an analysis of the available employees and their specific skill sets. Onboarding interim resources and back-filling resource gaps until the onboarding of dedicated new staff are alternative options to cover shortfalls.
The operational issue focuses on the impact on cash management and payment operations. Treasury needs to assess the impact on the existing banking and cash management structure and on liquidity as funds received by one entity are required by another. Bank relationships are foundational to Treasury operations and must be revisited and sometimes reinvented. Treasuries must work diligently to maintain trust and communication with old and new banking partners, articulating changes in the company's profile, needs, objectives, and strategies. Beyond negotiation and administration, the process often entails renegotiating terms and ensuring that the newly formed entity's financial needs will continue to be met effectively. The technical and operational ability to execute and receive payments through the company’s (new) bank accounts is a core requirement, which needs to be at the top of the list of priorities. Next, centralization of liquidity and cash structures is essential to avoid cash drag if inflows cannot be invested and/or concentrated in a relatively short time.
Treasury may also deal with different types of financial risk, such as interest rate or foreign exchange exposures. The financial risk management perspective is a crucial one for companies, but in the context of carve-out activities, it is often a second-order priority (depending on the financial risk profile of a company). However, proper identification and assessment of financial risk shall always be a top priority in a disentanglement process. Process implementation can be approached following the establishment of sound business and treasury processes if there is no significant financial risk.
If your organization is contemplating or in the midst of a carve-out, contact Zanders for support. Our consultative expertise in Treasury is your asset in ensuring financial stability and strategic advantage during and post-carve-out. Let Zanders be your partner in transforming challenges into successes.

Explore the crucial role of treasury in value creation and financial performance in private equity.
The evolving economic landscape has placed a spotlight on the critical role of treasury in value creation. Our latest roundtable, themed ‘Treasury’s Role in Value Creation,’ delved into the challenges and strategies private equity firms must navigate to enhance financial performance and prepare for successful exits. This event gathered industry leaders to discuss the expectations from treasury functions, the integration of post-merger processes, and the use of innovative technologies to drive growth. Read more as we explore the insights and key takeaways from this engaging and timely discussion, offering a roadmap for treasurers to elevate their impact within portfolio companies.
Roundtable theme: Treasury’s Role in Value Creation
The roundtable’s theme, ‘Treasury’s Role in Value Creation,’ was chosen to address the pressing economic and operational challenges that resulted in longer holding periods and slowed exits in 2023. In this context, private equity firms are increasingly focusing on growth and optimization strategies to drive long-term financial performance improvements, positioning their portfolio companies for successful exits once deal markets rebound. Key questions explored included: What is expected from the treasury function? How can treasurers navigate priorities and challenges to deliver productivity, financial performance, and value-added analysis to their company and PE sponsor? How can successful treasury post-merger integration be achieved in a buy & build scenario? And how should one prepare for an exit?
Key Insights and Strategic Directions
One of the significant discussion points was the value of cash management as a directly measurable lever of value creation. The panel emphasized the importance of focusing on free cash flow, EBITDA, and debt levels, which form the backbone of a successful investment. These metrics are crucial during due diligence, as they are scrutinized by Limited Partners (LPs). The consensus advocated for a focus on organic growth and business transformation over multiple expansions, which can signal stability and long-term value to LPs, and therefore add significant value to PE firms.
Moreover, it was discussed that, LPs intensely evaluate the financial models of portfolio companies, focusing on recurring revenue, Capex, margins, and debt levels. These factors often determine the soundness of an investment. The robustness of financial operations and the sophistication of the technologies employed are crucial in investment decisions, underscoring the important role of treasury in due diligence.
Enhancing ‘Buy and Build’ Strategies
Effective cash management was highlighted as a key factor influencing the success of ‘buy and build’ strategies, which involve acquiring companies and then integrating and growing them to enhance value. Effective cash management ensures the necessary liquidity and financial oversight during the integration and growth phases. An attendee noted that firms often "buy but forget to build." Quantifying the impact of effective treasury management is essential to addressing this gap.
A way of realizing operational improvements is through increased automation. Despite some pushback from PE firms on automating treasury functions, there are instances where sponsors are willing to invest in technologies to support the treasury function. For instance, an attendee mentioned receiving a sponsor’s support to invest in technology that will improve cash flow forecasting. Additionally, the approach to value creation at the portfolio company level depends on the sponsor's type and level of commitment.
The use of Artificial Intelligence (AI) in search of value creation was also discussed. Notably, various tangible use cases for AI in Treasury are envisaged. One example highlighted was ASML’s use of AI for forecasting optimization. Even though the large chip-manufacturer is not PE-owned, ASML’s use of AI for forecasting optimization served as a prime example in the discussion. In 2023, ASML implemented an AI-powered material intake forecast model to enhance the effectiveness and efficiency of its purchase FX hedging program1. This sharpened focus on FX risk management is a visible trend across private market firms. Deploying more sophisticated tools to increase FX hedging effectiveness at the PE fund or portfolio company level is an area worth exploring.
Looking Ahead
We reflect on a successful inaugural edition of the Private Equity Roundtable. We learned that effective cash management is crucial for value creation, focusing on free cash flow, EBITDA, and debt levels to ensure liquidity and financial oversight, particularly in ‘buy and build’ strategies. Moreover, automation and technology investments in treasury functions, such as improved cash flow forecasting, are essential for operational improvements and enhancing value creation in portfolio companies. After the event, participants shared that the event added significant value to their roles as treasurers of PE-owned companies. The positive feedback energizes us to organize similar sessions in other countries.
Is your company about to be or already owned by private equity? We can share our experiences regarding the added complexities of being a treasurer for a PE-owned company. For further information, you can reach out to Pieter Kraak.

As businesses continue to face challenges and uncertainty, it’s time to pick up the pace of change. And to do this corporate treasury requires a new roadmap.
This article highlights key points mentioned in our whitepaper: Treasury 4.x - The age of productivity, performance and steering. You can download the full whitepaper here.
Summary: Resilience amid uncertainty
Tectonic geopolitical shifts leading to fragile supply chains, inflation, volatility on financial markets and adoption of business models, fundamental demographic changes leading to capacity and skill shortages on relevant labor markets – a perpetual stream of disruption is pushing businesses to their limits, highlighting vulnerabilities in operations, challenging productivity, and leading to damaging financial consequences. Never has there been a greater need for CFOs to call on their corporate treasury for help steering their business through the persistent market and economic volatility. This is accelerating the urgency to advance the role of treasury to perform this broadened mandate. This is where Treasury 4.x steps in.
Productivity. Performance. Steering.
Treasury deserves a well-recognized place at the CFO's table - not at the edge, but right in the middle. Treasury 4.x recognizes the measurable impact treasury has in navigating uncertainty and driving corporate success. It also outlines what needs to happen to enable treasury to fulfil this strategic potential, focusing on three key areas:
1. Increasing productivity: Personnel, capital, and data – these three factors of production are the source of sizeable opportunities to drive up efficiency, escape an endless spiral of cost-cutting programs and maintain necessary budgets. This can be achieved by investing in highly efficient, IT-supported decision-making processes and further amplified with analytics and AI. Another option is outsourcing activities that require highly specialized expert knowledge but don’t need to be constantly available. It’s also possible to reduce the personnel factor of production through substitution with the data factor of production (in this context knowledge) and the optimization of the capital factor of production. We explain this in detail in Chapter 4 – Unlocking the power of productivity.
2. Performance enhancements: Currency and commodity price risk management, corporate financing, interest rate risk management, cash and liquidity management and, an old classic, working capital management – it’s possible to make improvements across almost all treasury processes to achieve enhanced financial results. Working capital management is of particular importance as it’s synonymous with the focus on cash and therefore, the continuous optimization of processes which are driving liquidity. We unpick each of these performance elements in Chapter 5 – The quest for peak performance.
3. Steering success: Ideologically, the door has opened for the treasurer into the CFO’s room. But many uncertainties remain around how this role and relationship will work in practice, with persistent questions around the nature and scope of the function’s involvement in corporate management and decision-making. In this document, we outline the case for making treasury’s contribution to decision-making parameters available at an early stage, before investment and financing decisions are made. The concept of Enterprise Liquidity Performance Management (ELPM) provides a more holistic approach to liquidity management and long-needed orientation. This recognizes and accounts for cross-function dependencies and how these impact the balance sheet, income statement and cash flow. Also, the topic of company ratings bears further opportunities for treasury involvement and value-add: through optimization of both tactical and strategic measures in processes such as financing, cash management, financial risk management and working capital management. These are the core subjects we debate in Chapter 6 – The definition of successful steering.
The foundations for a more strategic treasury have been in place for years as part of a concept which is named Treasury 4.0 . But now, as businesses continue to face challenges and uncertainty, it’s time to pick up the pace of change. And to do this corporate treasury requires a new roadmap.


The adoption of ISO 20022 XML standards significantly enhances invoice reconciliation and operational efficiency, improving working capital management and Days Sales Outstanding (DSO).
Whether a corporate operates through a decentralized model, shared service center or even global business services model, identifying which invoices a customer has paid and in some cases, a more basic "who has actually paid me" creates a drag on operational efficiency. Given the increased focus on working capital efficiencies, accelerating cash application will improve DSO (Days Sales Outstanding) which is a key contributor to working capital. As the industry adoption of ISO 20022 XML continues to build momentum, Zanders experts Eliane Eysackers and Mark Sutton provide some valuable insights around why the latest industry adopted version of XML from the 2019 ISO standards maintenance release presents a real opportunity to drive operational and financial efficiencies around the reconciliation domain.
A quick recap on the current A/R reconciliation challenges
Whilst the objective will always be 100% straight-through reconciliation (STR), the account reconciliation challenges fall into four distinct areas:
1. Data Quality
- Partial payment of invoices.
- Single consolidated payment covering multiple invoices.
- Truncated information during the end to end payment processing.
- Separate remittance information (typically PDF advice via email).
2. In-country Payment Practices and Payment Methods
- Available information supported through the in-country clearing systems.
- Different local clearing systems – not all countries offer a direct debit capability.
- Local market practice around preferred collection methods (for example the Boleto in Brazil).
- ‘Culture’ – some countries are less comfortable with the concept of direct debit collections and want full control to remain with the customer when it comes to making a payment.
3. Statement File Format
- Limitations associated with some statement reporting formats – for example the Swift MT940 has approximately 20 data fields compared to the ISO XML camt.053 bank statement which contains almost 1,600 xml tags.
- Partner bank capability limitations in terms of the supported statement formats and how the actual bank statements are generated. For example, some banks still create a camt.053 statement using the MT940 as the data source. This means the corporates receives an xml MT940!
- Market practice as most companies have historically used the Swift MT940 bank statement for reconciliation purposes, but this legacy Swift MT first mindset is now being challenged with the broader industry migration to ISO 20022 XML messaging.
4. Technology & Operations
- Systems limitations on the corporate side which prevent the ERP or TMS consuming a camt.053 bank statement.
- Limited system level capabilities around auto-matching rules based logic.
- Dependency on limited IT resources and budget pressures for customization.
- No global standardized system landscape and operational processes.
How can ISO20022 XML bank statements help accelerate and elevate reconciliation performance?
At a high level, the benefits of ISO 20022 XML financial statement messaging can be boiled down into the richness of data that can be supported through the ISO 20022 XML messages. You have a very rich data structure, so each data point should have its own unique xml field. This covers not only more structured information around the actual payment remittance details, but also enhanced data which enables a higher degree of STR, in addition to the opportunity for improved reporting, analysis and importantly, risk management.
Enhanced Data
- Structured remittance information covering invoice numbers, amounts and dates provides the opportunity to automate and accelerate the cash application process, removing the friction around manual reconciliations and reducing exceptions through improved end to end data quality.
- Additionally, the latest camt.053 bank statement includes a series of key references that can be supported from the originator generated end to end reference, to the Swift GPI reference and partner bank reference.
- Richer FX related data covering source and target currencies as well as applied FX rates and associated contract IDs. These values can be mapped into the ERP/TMS system to automatically calculate any realised gain/loss on the transaction which removes the need for manual reconciliation.
- Fees and charges are reported separately, combined a rich and very granular BTC (Bank Transaction Code) code list which allows for automated posting to the correct internal G/L account.
- Enhanced related party information which is essential when dealing with organizations that operate an OBO (on-behalf-of) model. This additional transparency ensures the ultimate party is visible which allows for the acceleration through auto-matching.
- The intraday (camt.052) provides an acceleration of this enhanced data that will enable both the automation and acceleration of reconciliation processes, thereby reducing manual effort. Treasury will witness a reduction in credit risk exposure through the accelerated clearance of payments, allowing the company to release goods from warehouses sooner. This improves customer satisfaction and also optimizes inventory management. Furthermore, the intraday updates will enable efficient management of cash positions and forecasts, leading to better overall liquidity management.
Enhanced Risk Management
- The full structured information will help support a more effective and efficient compliance, risk management and increasing regulatory process. The inclusion of the LEI helps identify the parent entity. Unique transaction IDs enable the auto-matching with the original hedging contract ID in addition to credit facilities (letters of credit/bank guarantees).
In Summary
The ISO 20022 camt.053 bank statement and camt.052 intraday statement provide a clear opportunity to redefine best in class reconciliation processes. Whilst the camt.053.001.02 has been around since 2009, corporate adoption has not matched the scale of the associated pain.001.001.03 payment message. This is down to a combination of bank and system capabilities, but it would also be relevant to point out the above benefits have not materialised due to the heavy use of unstructured data within the camt.053.001.02 message version.
The new camt.053.001.08 statement message contains enhanced structured data options, which when combined with the CGI-MP (Common Global Implementation – Market Practice) Group implementation guidelines, provide a much greater opportunity to accelerate and elevate the reconciliation process. This is linked to the recommended prescriptive approach around a structured data first model from the banking community.
Finally, linked to the current Swift MT-MX migration, there is now agreement that up to 9,000 characters can be provided as payment remittance information. These 9,000 characters must be contained within the structured remittance information block subject to bilateral agreement within the cross border messaging space. Considering the corporate digital transformation agenda – to truly harness the power of artificial intelligence (AI) and machine learning (ML) technology – data – specifically structured data, will be the fuel that powers AI. It’s important to recognize that ISO 20022 XML will be an enabler delivering on the technologies potential to deliver both predictive and prescriptive analytics. This technology will be a real game-changer for corporate treasury not only addressing a number of existing and longstanding pain-points but also redefining what is possible.


Entities must consider numerous factors when transitioning to the new DRM model, it is crucial for entities to develop a clear implementation plan.
The final article from Zanders on the DRM model presents the lifecycle of the DRM model over a single hedge accounting period and the prospective and retrospective assessments that are required to be carried out to ensure that the entity is correctly mitigating its interest rate risk for the assets/liabilities designated for the Current Net Open Risk Position (CNOP). The cycle will be illustrated by Scenario 1C taken from Agenda Paper 4A – May 20231. This is a relatively simple example, more complex ones can be found within the staff paper.
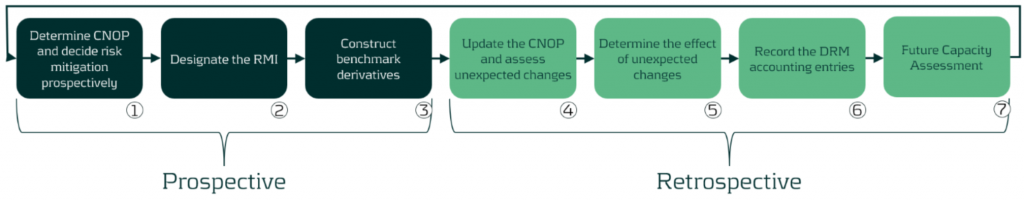
Figure 1: DRM Cycle
Prospective (start of the hedge accounting period)
The first three steps are related to the prospective assessment in the DRM model cycle.
The use of the prospective assessment is to ensure that the model is being used to mitigate interest rate risk and achieve the target profile that is set out in the RMS. The RMS should include the following:
- The risk mitigation cannot create new risks
- The RMI has to transform the CNOP position to a residual risk position that sits within the target profile (TP)
Step 1: The entity decides on the securities to be hedged and calculates the net open risk position (from an outstanding notional perspective) per time bucket.
In the example below the company has floating and fixed exposures. The business in this case has a five-year fixed mortgage starting in 20x2 which is fully funded by a five-year floating rate liability. The focus period is 20x2 (start of the hedge accounting period) to 20x3 (end of the hedge accounting period) and so the first period 20x1 has been removed. The entity manages its entity-level interest rate risk for a 5-year time horizon, based on notional exposure in ∆NII and has decided to set the TP to be +/-EUR 500 in each of the repricing periods. Below we present the total fixed and total floating exposures from the product defined above). The individual breakdown of the fixed and floating is not required as each exposure is hedged as a total. The exposure are positions at year end.
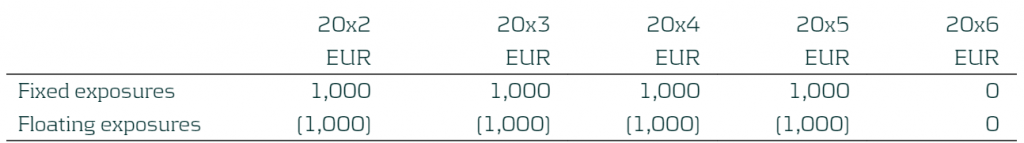
Table 1: CNOP of the Entity with yearly buckets
Step 2: The entity will calculate the RMI based on the designated derivatives. The entity decided to mitigate 80% of the risk through the use of the following derivatives (existing and new). Please note that is a combination of derivatives from all the derivatives available in the books:
- A 5-year pay fixed receive floating IR swap with notional of EUR 1,000, traded on 1st January 20x1 (DD Swap 1) (existing deal).
- A 4-year receive fixed pay floating IR swap with notional of EUR 200, traded on 1st January 20x2 (DD Swap 2)
This leads to the designated derivatives with the following exposures:
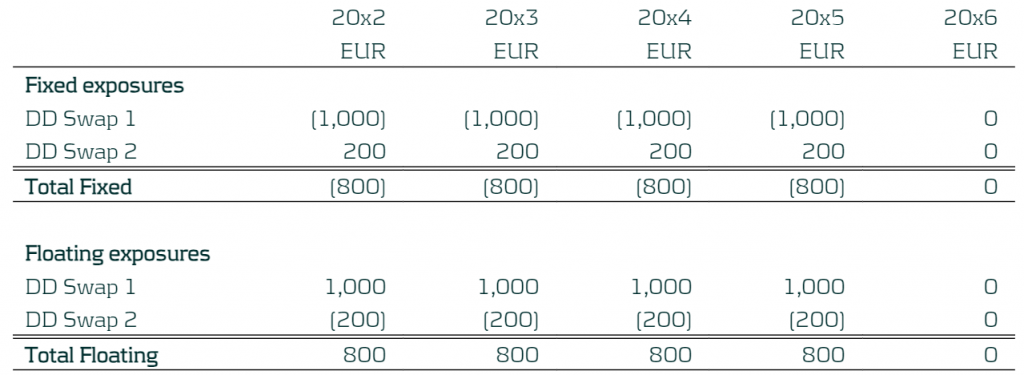
Table: Exposures of the Designated Derivatives
The exposures of the designated derivatives can then be compared to the CNOP as shown below:
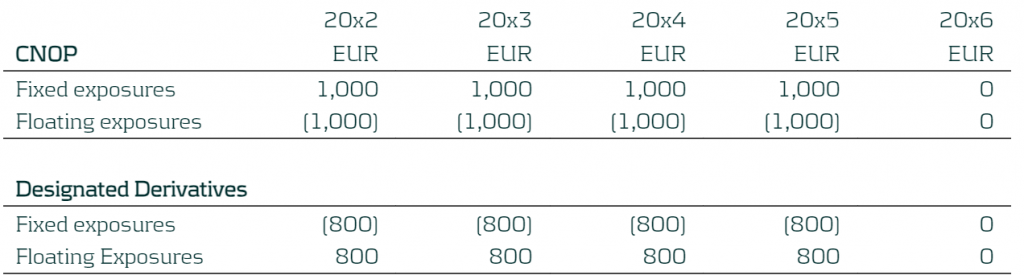
Table 2: Exposures of the CNOP and Designated Derivatives
As the entity manages its interest rate risk based on ∆NII, the RMI focuses on the floating exposure.
The prospective test is performed by comparing the CNOP and Designated Derivatives exposures at each time bucket to see whether this moves the residual risk inside the TP (+/- EUR 500) set out within the RMS and not providing an over-hedge position. In this case the residual risk will be 0 (80% of CNOP versus DD exposures) and so the prospective assessments pass for all the time buckets.
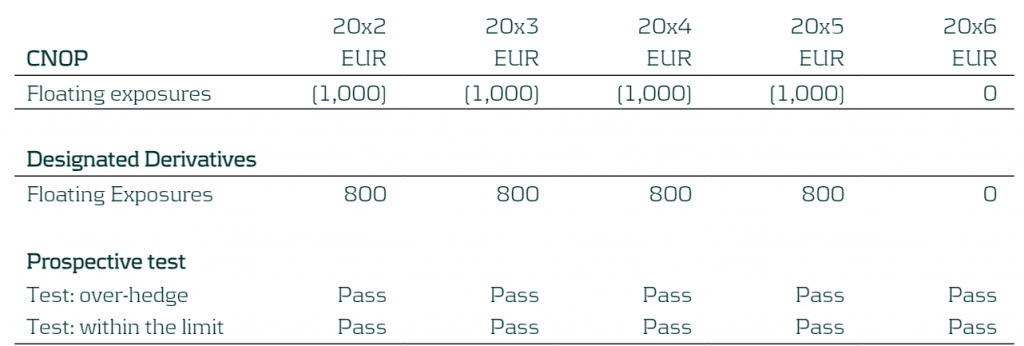
Table 3: Prospective test
Step 3: Benchmark derivatives (hypothetical derivatives) are constructed based on the RMI calculated above.

Table 4: Benchmark Derivatives created for the Fixed and Floating Exposures
Retrospective (end of the hedge accounting period)
The following steps are related to the retrospective assessment of the DRM model.
The IASB requires a retrospective assessment, to check that risks have been mitigated, as well as a future capacity assessment for each period2. This is to ensure the company is correctly mitigating its interest rate risk, ensuring the CNOP sits within their TP and to quantify the potential misalignment arising from unexpected changes (during the hedge accounting period).
Step 4: The entity updates the CNOP with the latest ALM information (note that new business is excluded from the updated CNOP).
In this example, the financial asset was repaid fully at the end of 20x5. The revised expectation is that it will be partially repaid per end 20x4 and the rest repaid end 20x5.
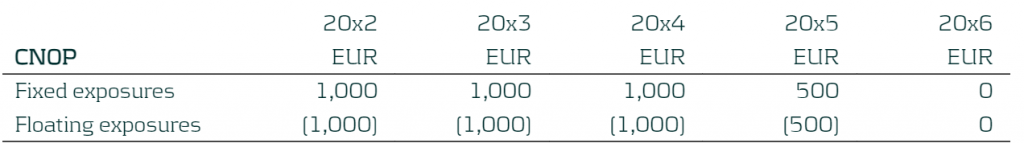
Table 5: Updated CNOP
Step 5: The potential misalignment due to unexpected changes is calculated. The new CNOP is compared to the RMI that was set in Step 2. Misalignments can occur due to:
- Difference in changes in the fair value of the designated derivatives and benchmark derivatives (i.e: different fixed rate, fair value adjustments)
- The effect of the unexpected changes in the current net open position during the period

Table 6: Updated CNOP
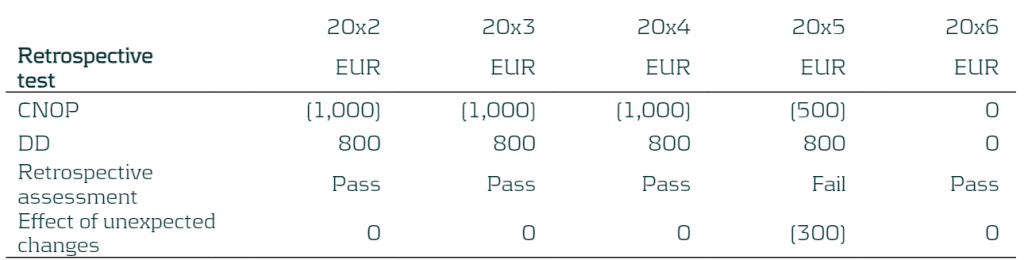
Table 7: Determining the effect of unexpected changes
If there are misalignments and the entity breaches the retrospective assessment, meaning that it has been over-mitigating its risk, the benchmark derivatives will need to be revised. One way in which this can be achieved is through the creation of additional benchmark derivatives which can represent the misalignment occurring. These will be based on the prevailing benchmark interest rates.
Therefore, for this example, the entity will construct two additional benchmark derivatives to represent these changes:
- A 4-year pay fixed rate receive floating IR swap with notional of EUR 300, maturing on the 31st December 20x5 (BD Swap 3)
- A 3-year receive fixed pay floating IR swap with notional of EUR 300, maturing on 31st December 20x4 (BD Swap 4)
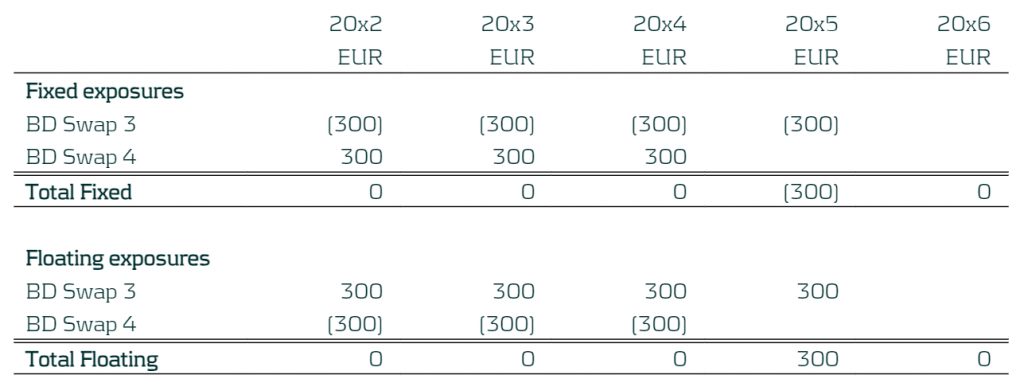
Table 8: Additional Benchmark Derivatives
Step 6: The hedge accounting adjustments are calculated, and the DRM model outputs are required to be booked3:
- a) The designated derivatives to be measured at fair value in the statement of financial position.
- b) The DRM adjustments to be recognised in the statement of financial position, as the lower of (in absolute amounts):
- The cumulative gain or loss on the designated derivatives from the inception of the DRM model.
- The cumulative change in the fair value of the risk mitigation intention attributable to repricing risk from the inception of the DRM model. This would be calculated using the benchmark derivatives (from step 3 and step 5) as a proxy.
- c) The net gain or loss from the designated derivatives calculated in accordance with (a) and the DRM adjustment calculated in accordance with (b) would be recognised in the statement of profit or loss.
The table below presents the EUR booking figures for this example. Figures are for the period 20x2 to 20x3.
The underlying items block represents the interest rate paid/received for the financial asset and financial liability for the period.
The designated derivative block presents the fair value movement of the designated derivatives for the period and the realised cash flow (net interest rate paid or received) on these instruments (trading income).
The DRM adjustment block presents the fair value movement of the benchmark derivatives for the period and the realised cash flow on these instruments (trading income).
BS represents a balance sheet account when IS represents an income statement account.
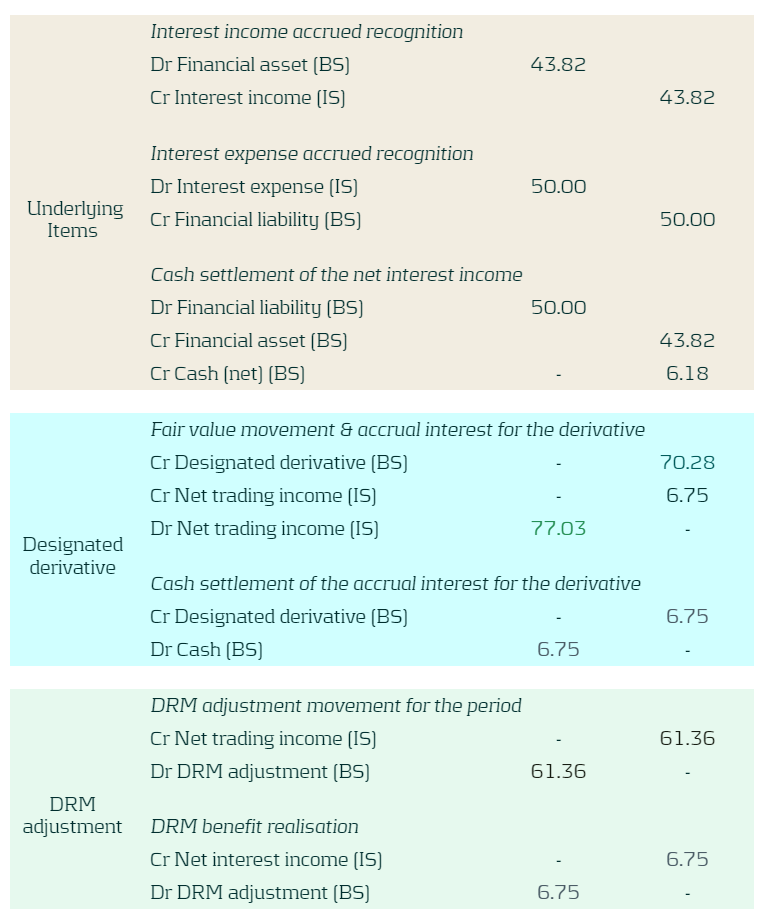
Table 9: Booking figures
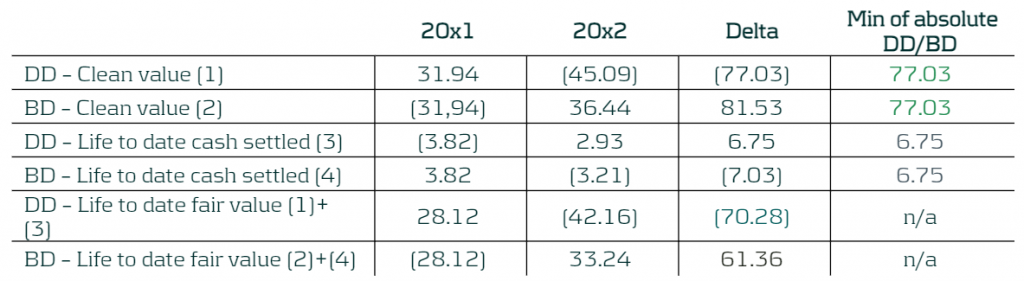
Table 10: Booking figures calculation
Step 7: The last step is the future capacity assessment which was introduced by the IASB in February 2023 and is still under development so the final implementation of this is still to be released. This step is used to replace the previous retrospective assessment that compared the CNOP sensitivity to the TP. The IASB have yet to release more information on the methodology. The example shown does not assume that the future capacity assessment is carried out.
What Next?
The IASB plans to publish an exposure draft by 2025 and so companies start thinking about their process for onboarding the DRM model in their accounting process. The DRM model introduces a range of changes to the hedge accounting framework and the transition process will not be an easy switch. Therefore, companies need to ensure that they have a clear and concise implementation plan to ensure a smooth transition. Involvement from stakeholders from across the company such as (IT, Front Office, Risk, Accounting, Treasury) is required to ensure the project is implemented correctly and in time.
What can Zanders offer?
Transitioning to the new DRM model can be difficult due to the dynamic nature of the model, especially with a more complex balance sheet. Zanders can provide a wide range of expertise to support in the onboarding of the DRM model into your company’s hedging and accounting. We have supported various clients with hedge accounting– including impact analyses, derivative pricing and model validation, and are familiar with the underlying challenges. Zanders can manage the whole project lifecycle from strategizing the implementation, alignment with key stakeholders and then helping design and implement the required models to successfully carry out the hedge accounting at every valuation period.
For further information, please contact Pierre Wernert, or Alexander Oldroyd.
Read our other blogs and learn more on Rethinking Macro Hedging: Introduction to DRM, and Rethinking Macro Hedging: What are the Key Components of the DRM Model?
Citations
- Agenda Paper 4A ↩︎
- The capacity, introduced in Staff Paper 4B – February 2023, assessment is still subject to further development. ↩︎
- Staff Paper 4A – May 2022 ↩︎

The Swift MT-MX migration and global industry adoption of ISO 20022 XML are more than just a simple compliance change.
The corporate treasury agenda continues to focus on cash visibility, liquidity centralization, bank/bank account rationalization, and finally digitization to enable greater operational and financial efficiencies. Digital transformation within corporate treasury is a must have, not a nice to have and with technology continuing to evolve, the potential opportunities to both accelerate and elevate performance has just been taken to the next level with ISO 20022 becoming the global language of payments. In this 6th article in the ISO 20022 XML series, Zanders experts Fernando Almansa, Eliane Eysackers and Mark Sutton provide some valuable insights around why this latest global industry move should now provide the motivation for corporate treasury to consider a cash management RFP (request for proposal) for its banking services.
Why Me and Why Now?
These are both very relevant important questions that corporate treasury should be considering in 2024, given the broader global payments industry migration to ISO 20022 XML messaging. This goes beyond the Swift MT-MX migration in the interbank space as an increasing number of in-country RTGS (real-time gross settlement) clearing systems are also adopting ISO 20022 XML messaging. Swift are currently estimating that by 2025, 80% of the domestic high value clearing RTGS volumes will be ISO 20022-based with all reserve currencies either live or having declared a live date. As more local market infrastructures migrate to XML messaging, there is the potential to provide richer and more structured information around the payment to accelerate and elevate compliance and reconciliation processes as well as achieving a more simplified and standardized strategic cash management operating model.
So to help determine if this really applies to you, the following questions should be considered around existing process friction points:
- Is your current multi-banking cash management architecture simplified and standardised?
- Is your account receivables process fully automated?
- Is your FX gain/loss calculations fully automated?
- Have you fully automated the G/L account posting?
- Do you have a standard ‘harmonized’ payments message that you send to all your banking partners?
If the answer is yes to all the above, then you are already following a best-in-class multi-banking cash management model. But if the answer is no, then it is worth reading the rest of this article as we now have a paradigm shift in the global payments landscape that presents a real opportunity to redefine best in class.
What is different about XML V09?
Whilst structurally, the XML V09 message only contains a handful of additional data points when compared with the earlier XML V03 message that was released back in 2009, the key difference is around the changing mindset from the CGI-MP (Common Global Implementation – Market Practice) Group1 which is recommending a more prescriptive approach to the banking community around adoption of its published implementation guidelines. The original objective of the CGI-MP was to remove the friction that existed in the multi-banking space as a result of the complexity, inefficiency, and cost of corporates having to support proprietary bank formats. The adoption of ISO 20022 provided the opportunity to simplify and standardize the multi-banking environment, with the added benefit of providing a more portable messaging structure. However, even with the work of the CGI-MP group, which produced and published implementation guidelines back in 2009, the corporate community has encountered a significant number of challenges as part of their adoption of this global financial messaging standard.
The key friction points are highlighted below:
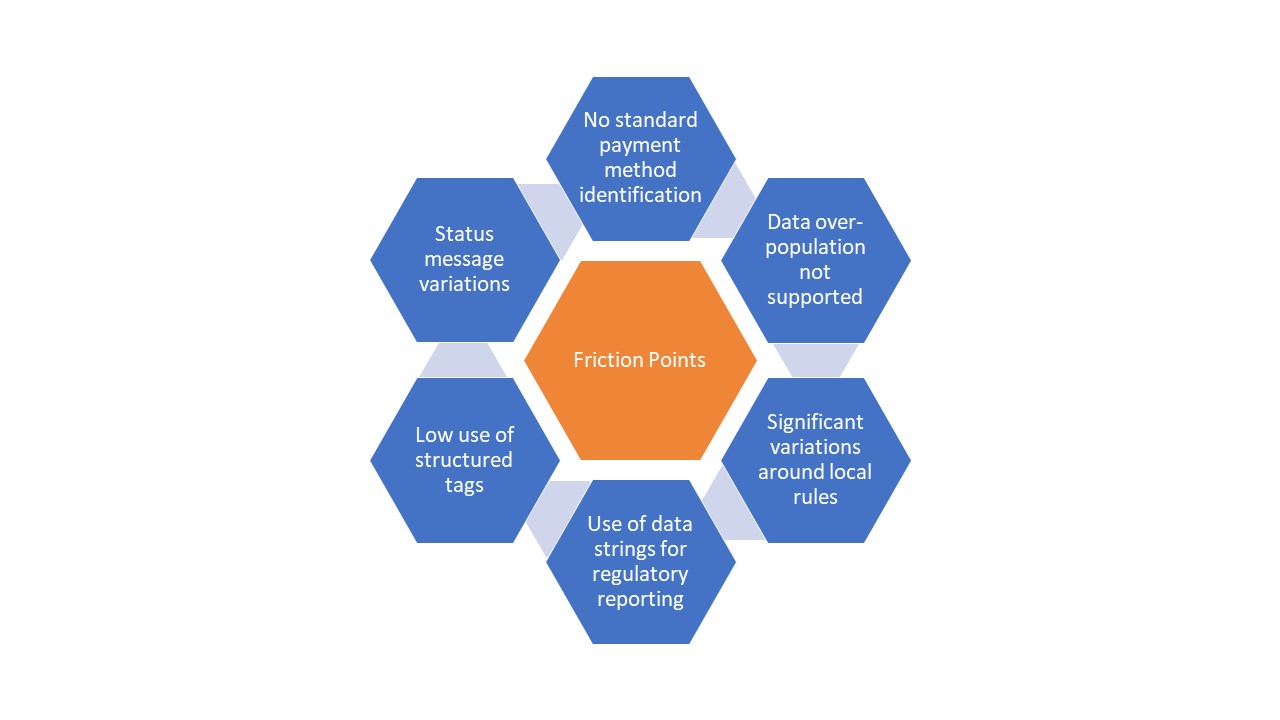
Diagram 1: Key friction points encountered by the corporate community in adopting XML V03
The highlighted friction points have resulted in the corporate community achieving a sub-optimal cash management architecture. Significant divergence in terms of the banks’ implementation of this standard covers a number of aspects, from non-standard payment method codes and payment batching logic to proprietary requirements around regulatory reporting and customer identification. All of this translated into additional complexity, inefficiency, and cost on the corporate side.
However, XML V09 offers a real opportunity to simplify, standardise, accelerate and elevate cash management performance where the banking community embraces the CGI-MP recommended ‘more prescriptive approach’ that will help deliver a win-win situation. This is more than just about a global standardised payment message, this is about the end to end cash management processes with a ‘structured data first’ mindset which will allow the corporate community to truly harness the power of technology.
What are the objectives of the RFP?
The RFP or RFI (request for information) process will provide the opportunity to understand the current mindset of your existing core cash management banking partners. Are they viewing the MT-MX migration as just a compliance exercise. Do they recognize the importance and benefits to the corporate community of embracing the recently published CGI-MP guidelines? Are they going to follow a structured data first model when it comes to statement reporting? Having a clearer view in how your current cash management banks are thinking around this important global change will help corporate treasury to make a more informed decision on potential future strategic cash management banking partners. More broadly, the RFP will provide an opportunity to ensure your core cash management banks have a strong strategic fit with your business across dimensions such as credit commitment, relationship support to your company and the industry you operate, access to senior management and ease of doing of business. Furthermore, you will be in a better position to achieve simplification and standardization of your banking providers through bank account rationalization combined with the removal of non-core partner banks from your current day to day banking operations.
In Summary
The Swift MT-MX migration and global industry adoption of ISO 20022 XML should be viewed as more than just a simple compliance change. This is about the opportunity to redefine a best in class cash management model that delivers operational and financial efficiencies and provides the foundation to truly harness the power of technology.
Citations
- Common Global Implementation–Market Practice (CGI-MP) provides a forum for financial institutions and non-financial institutions to progress various corporate-to-bank implementation topics on the use of ISO 20022 messages and to other related activities, in the payments domain. ↩︎


