
In the high-stakes world of private equity, where the pressure to deliver exceptional returns is relentless, the playbook is evolving.
In the high-stakes world of private equity, where the pressure to deliver exceptional returns is relentless, the playbook is evolving. Gone are the days when financial engineering—relying heavily on leveraged buyouts and cost-cutting—was the silver bullet for value creation. Today, the narrative is shifting toward a more sustainable, operationally driven approach, with treasury and finance optimization emerging as pivotal levers in this transformation.
In this article, we blend fictional examples, use cases and other real-world examples to vividly illustrate key concepts and drive our points home.
The Disconnect Between Promised and Delivered Operational Value
Limited Partners (LPs) are becoming more discerning in their investment decisions, increasingly demanding more than just financial returns. They expect General Partners (GPs) to deliver on promises of operational improvements that go beyond mere financial engineering. However, there is often a significant disconnect between the operational value creation promised by GPs and the reality, which frequently relies too heavily on short-term financial tactics.
A report by McKinsey highlights that while 60% of GPs claim to focus on operational improvements, only 40% of LPs feel that these efforts significantly impact portfolio performance. This gap between intention and execution underscores the need for GPs to align their value creation strategies with LP expectations. LPs are particularly focused on consistent investment strategies, strong management teams, and robust operational processes that drive sustainable growth. They view genuine operational value creation as the cornerstone of a repeatable and sustainable investment strategy, offering reassurance that future fund generations will perform consistently.
Treasury: The Unsung Hero of Value Creation
Treasury functions, once seen as mere back-office operations, are increasingly recognized as crucial drivers of value in private equity. These functions—ranging from cash management to financial risk mitigation—are the lifeblood of any portfolio company.
The evolution of treasury functions, now known as Treasury 4.x, has transformed them into pivotal drivers of value. These modernized treasury roles—encompassing advanced cash management and risk mitigation—now align financial operations with broader strategic goals, leveraging technology and data analytics to optimize performance.
Yet, many firms struggleto appreciate just how much inefficiencies in these areas can erode value. Poor liquidity management, fragmented cash operations, and outdated financial processes can strangle a company's ability to invest in growth and hamstring its potential to capitalize on market opportunities.
Consider the example of a mid-sized European manufacturing firm acquired by a private equity investor. Initially, the focus was solely on scaling revenue by entering new markets. However, it soon became apparent that fragmented treasury operations were hemorrhaging resources, particularly due to decentralized cash management systems across multiple jurisdictions.
By centralizing these operations into a single source of truth, like a treasury management system (TMS), the company was able to cut down on redundant processes, improve visibility and central control on cash, reduce external borrowing cost and cash related operational costs by 20%. This freed up capital that was then reinvested into R&D and expansion efforts, positioning the firm to seize new growth opportunities with agility.
Cash Flow Forecasting: The Financial Crystal Ball
In the realm of private equity, where every dollar counts, cash flow forecasting is not just a routine exercise—it’s a strategic imperative. Accurate cash flow forecasting provides a clear window into a company's financial future, offering transparency that is invaluable for both internal decision-makers and external stakeholders, especially Limited Partners (LPs) who demand rigorous insights into their investments.
Take, for example, a mid-market technology firm backed by private equity, poised to launch a groundbreaking product. Initially, the firm’s cash flow forecasts were rudimentary, lacking the sophistication needed to anticipate the working capital needs for the product launch phase. As a result, the company nearly ran into a liquidity crisis that could have delayed the launch.
By overhauling its cash flow forecasting processes and incorporating scenario analysis, the company was able to better anticipate cash needs, secure bridge financing, and ensure a successful product rollout, which ultimately boosted investor confidence.
Navigating Financial Risks in a Volatile World
In today’s unpredictable economic landscape, managing financial risks such as currency fluctuations and interest rate spikes is more critical than ever. As private equity firms increasingly engage in cross-border acquisitions, the exposure to foreign exchange risk has become a significant concern. Similarly, the current high-interest-rate environment complicates debt management, adding layers of complexity to financial operations.
Consider a global consumer goods company within a private equity portfolio, operating in regions with volatile currencies like Brazil or South Africa. Without a robust FX hedging strategy, the company was previously exposed to unpredictable swings in cash flows due to exchange rate fluctuations, which affected its ability to meet debt obligations denominated in foreign currencies.
By implementing a comprehensive FX hedging strategy, including the use of natural hedges, the firm was able to lock in favorable exchange rates, stabilize its cash flows, and protect its margins. This not only ensured financial stability but also allowed the company to reinvest profits into expanding its footprint in emerging markets.
Treasury in M&A: A Crucial Integration Component
Treasury management is often the linchpin in the success or failure of mergers and acquisitions (M&A). The ability to seamlessly integrate treasury operations is essential for realizing the synergies promised by a merger. Failure to do so can lead to significant financial inefficiencies, eroding the anticipated value.
A cautionary tale can be seen in General Electric’s acquisition of Alstom Power, where unforeseen integration challenges led to substantial restructuring costs. The treasury teams faced difficulties in aligning the cash management systems and integrating different financial cultures, which delayed synergies realization and led to missed financial targets.
Conversely, in another M&A scenario involving the merger of two mid-sized logistics firms, a pre-emptive focus on treasury integration—such as harmonizing cash pooling arrangements and consolidating banking relationships—enabled the new entity to achieve cost synergies ahead of schedule, saving millions in operational expenses and improving free cash flow.
Streamlined Treasury and Finance: Driving Strategic Value and Returns in Private Equity
Streamlined treasury and finance operations are crucial for maximizing value in private equity. These enhancements go beyond cost savings, improving a company's agility and resilience by ensuring financial resources are available precisely when needed. This empowers portfolio companies to seize growth opportunities while driving cost savings and better resource utilization through operational efficiency. Optimizing cash management and liquidity also enables companies to better navigate market volatility, reducing risks such as poor cash flow forecasting.
Enhanced transparency and real-time data visibility lead to more informed decision-making, aligning with long-term value creation strategies. This not only strengthens investor confidence but also prepares companies for successful exits by making them more attractive to potential buyers. Improved free cash flow directly boosts the money-on-money multiple, enhancing financial outcomes for private equity investors.
Conclusion
In today’s private equity landscape, the strategic importance of treasury and finance optimization is undeniable. The era of relying solely on financial engineering is over. A comprehensive approach that includes robust treasury management and operational efficiency is now essential for driving sustainable growth and maximizing value. By addressing treasury inefficiencies, private equity firms can unlock significant value, ensuring portfolio companies have the financial health to thrive. This approach meets the rising expectations of Limited Partners, setting the stage for long-term success and profitable exits.
If you're interested in delving deeper into the benefits of strategic treasury management for private equity firms, you can contact Job Wolters.

Explore how Basel IV reforms and enhanced due diligence requirements will transform regulatory capital assessments for credit risk, fostering a more resilient and informed financial sector.
The Basel IV reforms, which are set to be implemented on 1 January 2025 via amendments to the EU Capital Requirement Regulation, have introduced changes to the Standardized Approach for credit risk (SA-CR). The Basel framework is implemented in the European Union mainly through the Capital Requirements Regulation (CRR3) and Capital Requirements Directive (CRD6). The CRR3 changes are designed to address shortcomings in the existing prudential standards, by among other items, introducing a framework with greater risk sensitivity and reducing the reliance on external ratings. Action by banks is required to remain compliant with the CRR. Overall, the share of RWEA derived through an external credit rating in the EU-27 remains limited, representing less than 10% of the total RWEA under the SA with the CRR.
Introduction
The Basel Committee on Banking Supervision (BCBS) identified the excessive dependence on external credit ratings as a flaw within the Standardised Approach (SA), observing that firms frequently used these ratings to compute Risk-Weighted Assets (RWAs) without adequately understanding the associated risks of their exposures. To address this issue, regulators have implemented changes aimed to reduce the mechanical reliance on external credit ratings and to encourage firms to use external credit ratings in a more informed manner. The objective is to diminish the chances of underestimating financial risks in order to further build a more resilient financial industry. Overall, the share of Risk Weighted Assets (RWA) derived through an external credit rating remains limited, and in Europe it represents less than 10% of the total RWA under the SA.
The concept of due diligence is pivotal in the regulatory framework. It refers to the rigorous process financial institutions are expected to undertake to understand and assess the risks associated with their exposures fully. Regulators promote due diligence to ensure that banks do not solely rely on external assessments, such as credit ratings, but instead conduct their own comprehensive analysis.
The due diligence is a process performed by banks with the aim of understanding the risk profile and characteristics of their counterparties at origination and thereafter on a regular basis (at least annually). This includes assessing the appropriateness of risk weights, especially when using external ratings. The level of due diligence should match the size and complexity of the bank's activities. Banks must evaluate the operating and financial performance of counterparties, using internal credit analysis or third-party analytics as necessary, and regularly access counterparty information. Climate-related financial risks should also be considered, and due diligence must be conducted both at the solo entity level and consolidated level.
Banks must establish effective internal policies, processes, systems, and controls to ensure correct risk weight assignment to counterparties. They should be able to prove to supervisors that their due diligence is appropriate. Supervisors are responsible for reviewing these analyses and taking action if due diligence is not properly performed.
Banks should have methodologies to assess credit risk for individual borrowers and at the portfolio level, considering both rated and unrated exposures. They must ensure that risk weights under the Standardised Approach reflect the inherent risk. If a bank identifies that an exposure, especially an unrated one, has higher inherent risk than implied by its assigned risk weight, it should factor this higher risk into its overall capital adequacy evaluation.
Banks need to ensure they have an adequate understanding of their counterparties’ risk profiles and characteristics. The diligent monitoring of counterparties is applicable to all exposures under the SA. Banks would need to take reasonable and adequate steps to assess the operating and financial condition of each counterparty.
Rating System
The external credit assessment institutions (ECAIs) are credit rating agencies recognised by National supervisors. The External Credit ECAIs play a significant role in the SA through the mapping of each of their credit assessments to the corresponding risk weights. Supervisors will be responsible for assigning an eligible ECAI’s credit risk assessments to the risk weights available under the SA. The mapping of credit assessments should reflect the long-term default rate.
Exposures to banks, exposures to securities firms and other financial institutions and exposures to corporates will be risk-weighted based on the following hierarchy External Credit Risk Assessment Approach (ECRA) and the Standardised Credit Risk Assessment Approach (SCRA).
ECRA: Used in jurisdictions allowing external ratings. If an external rating is from an unrecognized or non-nominated ECAI, the exposure is considered unrated. Also, banks must perform due diligence to ensure ratings reflect counterparty creditworthiness and assign higher risk weights if due diligence reveals greater risk than the rating suggests.
SCRA: Used where external ratings are not allowed. Applies to all bank exposures in these jurisdictions and unrated exposures in jurisdictions allowing external ratings. Banks classify exposures into three grades:
- Grade A: Adequate capacity to meet obligations in a timely manner.
- Grade B: Substantial credit risk, such as repayment capacities that are dependent on stable or favourable economic or business conditions.
- Grade C: Higher credit risk, where the counterparty has material default risks and limited margins of safety
The CRR Final Agreement includes a new article (Article 495e) that allows competent authorities to permit institutions to use an ECAI credit assessment assuming implicit government support until December 31, 2029, despite the provisions of Article 138, point (g).
In cases where external credit ratings are used for risk-weighting purposes, due diligence should be used to assess whether the risk weight applied is appropriate and prudent.
If the due diligence assessment suggests an exposure has higher risk characteristics than implied by the risk weight assigned to the relevant Credit Quality Step (CQS) of an exposure, the bank would assign the risk weight at least one higher than the CQS indicated by the counterparty’s external credit rating.
Criticisms to this approach are:
- Banks are mandated to use nominated ECAI ratings consistently for all exposures in an asset class, requiring banks to carry out a due diligence on each and every ECAI rating goes against the principle of consistent use of these ratings.
- When banks apply the output floor, ECAI ratings act as a backstop to internal ratings. In case the due diligence would imply the need to assign a high-risk weight, the output floor could no longer be used consistently across banks to compare capital requirements.
Implementation Challenges
The regulation requires the bank to conduct due diligence to ensure a comprehensive understanding, both at origination and on a regular basis (at least annually), of the risk profile and characteristics of their counterparties. The challenges associated with implementing this regulation can be grouped into three primary categories: governance, business processes, and systems & data.
Governance
The existing governance framework must be enhanced to reflect the new responsibilities imposed by the regulation. This involves integrating the due diligence requirements into the overall governance structure, ensuring that accountability and oversight mechanisms are clearly defined. Additionally, it is crucial to establish clear lines of communication and decision-making processes to manage the new regulatory obligations effectively.
Business Process
A new business process for conducting due diligence must be designed and implemented, tailored to the size and complexity of the exposures. This process should address gaps in existing internal thresholds, controls, and policies. It is essential to establish comprehensive procedures that cover the identification, assessment, and monitoring of counterparties' risk profiles. This includes setting clear criteria for due diligence, defining roles and responsibilities, and ensuring that all relevant staff are adequately trained.
Systems & Data
The implementation of the regulation requires access to accurate and comprehensive data necessary for the rating system. Challenges may arise from missing or unavailable data, which are critical for assessing counterparties' risk profiles. Furthermore, reliance on manual solutions may not be feasible given the complexity and volume of data required. Therefore, it is imperative to develop robust data management systems that can capture, store, and analyse the necessary information efficiently. This may involve investing in new technology and infrastructure to automate data collection and analysis processes, ensuring data integrity and consistency.
Overall, addressing these implementation challenges requires a coordinated effort across the organization, with a focus on enhancing governance frameworks, developing comprehensive business processes, and investing in advanced systems and data management solutions.
How can Zanders help?
As a trusted advisor, we built a track record of implementing CRR3 throughout a heterogeneous group of financial institutions. This provides us with an overview of how different entities in the industry deal with the different implementation challenges presented above.
Zanders has been engaged to provide project management for these Basel IV implementation projects. By leveraging the expertise of Zanders' subject matter experts, we ensure an efficient and insightful gap analysis tailored to your bank's specific needs. Based on this analysis, combined with our extensive experience, we deliver customized strategic advice to our clients, impacting multiple departments within the bank. Furthermore, as an independent advisor, we always strive to challenge the status quo and align all stakeholders effectively.
In-depth Portfolio Analysis: Our initial step involves conducting a thorough portfolio scan to identify exposures to both currently unrated institutions and those that rely solely on government ratings. This analysis will help in understanding the extent of the challenge and planning the necessary adjustments in your credit risk framework.
Development of Tailored Models: Drawing from our extensive experience and industry benchmarks, Zanders will collaborate with your project team to devise a range of potential solutions. Each solution will be detailed with a clear overview of the required time, effort, potential impact on Risk-Weighted Assets (RWA), and the specific steps needed for implementation. Our approach will ensure that you have all the necessary information to make informed strategic decisions.
Robust Solutions for Achieving Compliance: Our proprietary Credit Risk Suite cloud platform offers banks robust tools to independently assess and monitor the credit quality of corporate and financial exposures (externally rated or not) as well as determine the relevant ECRA and SCRA ratings.
Strategic Decision-Making Support: Zanders will support your Management Team (MT) in the decision-making process by providing expert advice and impact analysis for each proposed solution. This support aims to equip your MT with the insights needed to choose the most appropriate strategy for your institution.
Implementation Guidance: Once a decision has been made, Zanders will guide your institution through the specific actions required to implement the chosen solution effectively. Our team will provide ongoing support and ensure that the implementation is aligned with both regulatory requirements and your institution’s strategic objectives.
Continuous Adaptation and Optimization: In response to the dynamic regulatory landscape and your bank's evolving needs, Zanders remains committed to advising and adjusting strategies as needed. Whether it's through developing an internal rating methodology, imposing new lending restrictions, or reconsidering business relations with unrated institutions, we ensure that your solutions are sustainable and compliant.
Independent and Innovative Thinking: As an independent advisor, Zanders continuously challenges the status quo, pushing for innovative solutions that not only comply with regulatory demands but also enhance your competitive edge. Our independent stance ensures that our advice is unbiased and wholly in your best interest.
By partnering with Zanders, you gain access to a team of dedicated professionals who are committed to ensuring your successful navigation through the regulatory complexities of Basel IV and CRR3. Our expertise and tailored approaches enable your institution to manage and mitigate risks efficiently while aligning with the strategic goals and operational realities of your bank. Reach out to Tim Neijs or Marco Zamboni for further comments or questions.
REFERENCE
[1] BCBS, The Basel Framework, Basel https://www.bis.org/basel_framework
[2] Regulation (EU) No 575/2013
[3] Directive 2013/36/EU
[4] EBA Roadmap on strengthening the prudential framework
[5] EBA REPORT ON RELIANCE ON EXTERNAL CREDIT RATINGS

An overview of how the new CRR3 regulation impacts banks’ capital requirements for credit risk and its implications for the 2025 EU-wide stress test, based on EBA’s findings.
With the introduction of the updated Capital Requirements Regulation (CRR3), which has entered into force on 9 July 2024, the European Union's financial landscape is poised for significant changes. The 2025 EU-wide stress test will be a major assessment to measure the resilience of banks under these new regulations. This article summarizes the estimated impact of CRR3 on banks’ capital requirements for credit risk based on the results of a monitoring exercise executed by the EBA in 2022. Furthermore, this article comments on the potential impact of CRR3 to the upcoming stress test, specifically from a credit risk perspective, and describes the potential implications for the banking sector.
The CRR3 regulation, which is the implementation of the Basel III reforms (also known as Basel IV) into European law, introduces substantial updates to the existing framework [1], including increased capital requirements, enhanced risk assessment procedures and stricter reporting standards. Focusing on credit risk, the most significant changes include:
- The phased increase of the existing output floor to internally modelled capital requirements, limiting the benefit of internal models in 2028 to 72.5% of the Risk Weighted Assets (RWA) calculated under the Standardised Approach (SA), see Table 1. This floor is applied on consolidated level, i.e. on the combined RWA of all credit, market and operational risk.

- A revised SA to enhance robustness and risk sensitivity, via more granular risk weights and the introduction of new asset classes.1
- Limiting the application of the Advanced Internal Ratings Based (A-IRB) approach to specific asset classes. Additionally, new asset classes have been introduced.2
After the launch of CRR3 in January 2025, 68 banks from the EU and Norway, including 54 from the Euro area, will participate in the 2025 EU-wide stress test, thus covering 75% of the EU banking sector [2]. In light of this exercise, the EBA recently published their consultative draft of the 2025 EU-wide Stress Test Methodological Note [3], which reflects the regulatory landscape shaped by CRR3. During this forward-looking exercise the resilience of EU banks in the face of adverse economic conditions will be tested within the adjusted regulatory framework, providing essential data for the 2025 Supervisory Review and Evaluation Process (SREP).
The consequences of the updated regulatory framework are an important topic for banks. The changes in the final framework aim to restore credibility in the calculation of RWAs and improve the comparability of banks' capital ratios by aligning definitions and taxonomies between the SA and IRB approaches. To assess the impact of CRR3 on the capital requirements and whether this results in the achievement of this aim, the EBA executed a monitoring exercise in 2022 to quantify the impact of the new regulations, and published the results (refer to the report in [4]).
For this monitoring exercise the EBA used a sample of 157 banks, including 58 Group 1 banks (large and internationally active banks), of which 8 are classified as a Global Systemically Important Institution (G-SII), and 99 Group 2 banks. Group 1 banks are defined as banks that have Tier 1 capital in excess of EUR 3 billion and are internationally active. All other banks are labelled as Group 2 banks. In the report the results are separated per group and per risk type.
Looking at the impact on the credit risk capital requirements specifically caused by the revised SA and the limitations on the application of IRB, the EBA found that the median increase of current Tier 1 Minimum Required Capital3 (hereafter “MRC”) is approximately 3.2% over all portfolios, i.e. SA and IRB approach portfolios. Furthermore, the median impact on current Tier 1 MRC for SA portfolios is approximately 2.1% and for IRB portfolios is 0.5% (see [4], page 31). This impact can be mainly attributed to the introduction of new (sub) asset classes with higher risk weights on average. The largest increases are expected for ‘equities’, ‘equity investment in funds’ and ‘subordinated debt and capital instruments other than equity’. Under adverse scenarios the impact of more granular risk weights may be magnified due to a larger share of exposures having lower credit ratings. This may result in additional impact on RWA.
The revised SA results in more risk-sensitive capital requirements predictions over the forecast horizon due to the more granular risk weights and newly introduced asset classes. This in turn allows banks to more clearly identify their risk profile and provides the EBA with a better overview of the performance of the banking sector as a whole under adverse economic conditions. Additionally, the impact on RWA caused by the gradual increase of the output floor, as shown in Table 1, was estimated. As shown in Table 2, it was found that the gradual elevation of the output floor increasingly affects the MRC throughout the phase-in period (2023-2028).
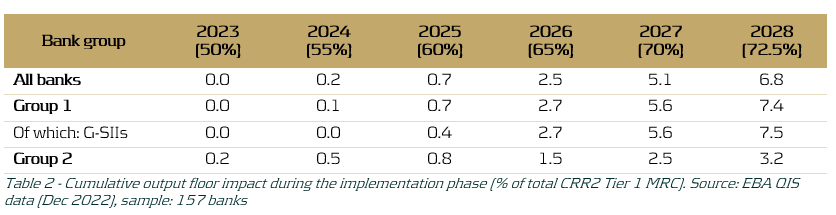
Table 2 demonstrates that the impact is minimal in the first three years of the phase-in period, but grows significantly in the last three years of the phase-in period, with an average estimated 7.5% increase in Tier 1 MRC for G-SIIs in 2028. The larger increase in Tier 1 MRC for Group 1 banks, and G-SIIs in particular, as compared to Group 2 banks may be explained by the fact that larger banks more often employ an IRB approach and are thus more heavily impacted by an increased IRB floor, relative to their smaller counterparts. The expected impact on Group 1 banks is especially interesting in the context of the EU-wide stress test, since for the regulatory stress test only the 68 largest banks in Europe participate. Assuming that banks need to employ an increasing version of the output floor for their projections during the 2025 EU-wide stress test, this could lead to significant increases in capital requirements in the last years of the forecast horizon of the RWA projections. These increases may not be fully attributed to the adverse effects of the provided macroeconomic scenarios.
Conversely, it is good to note that a transition cap has been introduced by the Basel III reforms and adopted in CRR3. This cap puts a limit on the incremental increase of the output floor impact on total RWAs. The transitional period cap is set at 25% of a bank’s year-to-year increase in RWAs and may be exercised at the discretion of supervisors on a national level (see [5]). As a consequence, this may limit the observed increase in RWA during the execution of the 2025 EU-wide stress test.
In conclusion, the implementation of CRR3 and its adoption into the 2025 EU-wide stress test methodology may have a significant impact on the stress test results, mainly due to the gradual increase in the IRB output floor but also because of changes in the SA and IRB approaches. However, this effect may be partly mitigated by the transitional 25% cap on year-on-year incremental RWA due to the output floor increase. Additionally, the 2025 EU-wide stress test will provide a comprehensive view of the impact of CRR3, including the closer alignment between the SA and the IRB approaches, on the development of capital requirements in the banking sector under adverse conditions.
References:
- final_report_on_amendments_to_the_its_on_supervisory_reporting-crr3_crd6.pdf (europa.eu)
- The EBA starts dialogue with the banking industry on 2025 EU-Wide stress test methodology | European Banking Authority (europa.eu)
- 2025 EU-wide stress test - Methodological Note.pdf (europa.eu)
- Basel III monitoring report as of December 2022.pdf (europa.eu)
- Basel III: Finalising post-crisis reforms (bis.org)
Citations
- This includes the addition of the ‘Subordinated debt exposures’ asset class, as well as an additional branch of specialized lending exposures within the corporates asset class. Furthermore, a more detailed breakdown of exposures secured by mortgages on immovable property and acquisition, development and construction financing? has been introduced. ↩︎
- For in detailed information on the added asset classes and limited application of IRB refer to paragraph 25 of the report in [1]. ↩︎
- Tier 1 capital refers to the core capital held in a bank's reserves. It includes high-quality capital, predominantly in the form of shares and retained earnings that can absorb losses. The Tier 1 MRC is the minimum capital required to satisfy the regulatory Tier 1 capital ratio (ratio of a bank's core capital to its total RWA) determined by Basel and is an important metric the EBA uses to measure a bank’s health. ↩︎

Defining the challenges that prevent increased Treasury participation in the commodity risk management strategy and operations and proposing a framework to address these challenges.
The heightened fluctuations observed in the commodity and energy markets from 2021 to 2022 have brought Treasury's role in managing these risks into sharper focus. While commodity prices stabilized in 2023 and have remained steady in 2024, the ongoing economic uncertainty and geopolitical landscape ensures that these risks continue to command attention. Building a commodity risk framework that is in-line with the organization’s objectives and unique exposure to different commodity risks is Treasury’s key function, but it must align with an over-arching holistic risk management approach.
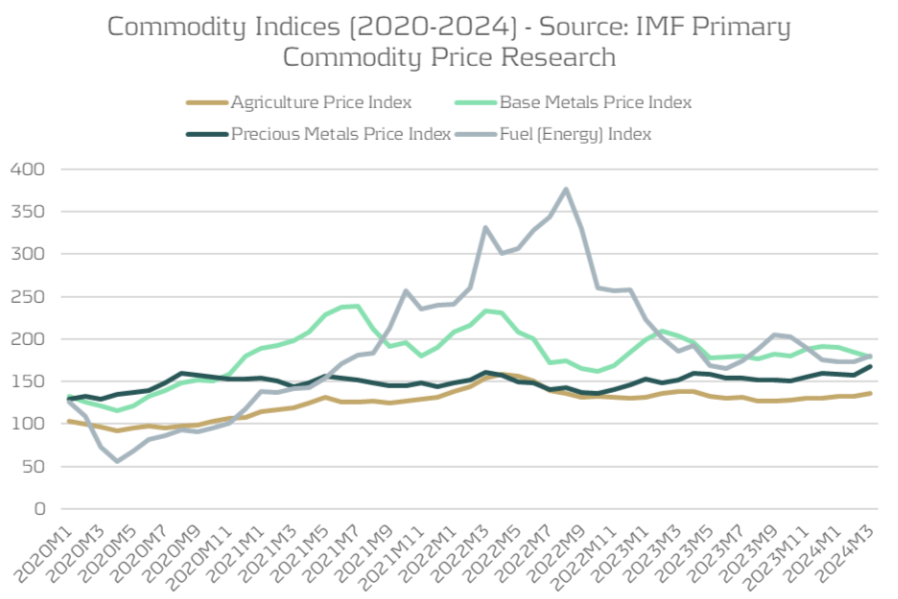
Figure 1: Commodity index prices (Source: IMF Primary Commodity Price Research)
Traditionally, when treasury has been involved in commodity risk management, the focus is on the execution of commodity derivatives hedging. However, rarely did that translate into a commodity risk management framework that is fully integrated into the treasury operations and strategy of a corporate, particularly in comparison to the common frameworks applied for FX and interest rate risk.
On the surface it seems curious that corporates would have strict guidelines on hedging FX transaction risk, while applying a less stringent set of guidelines when managing material commodity positions. This is especially so when the expectation is often that the risk bearing capacity and risk appetite of a company should be no different when comparing exposure types.
The reality though is that commodity risk management for corporates is far more diverse in nature than other market risks, where the business case, ownership of tasks, and hedging strategy bring new challenges to the treasury environment. To overcome these challenges, we need to address them and understand them better.
Risk management framework
To first identify all the challenges, we need to analyze a typical market risk management framework, encompassing the identification, monitoring and mitigation aspects, in order to find the complexities specifically related to commodity risk management.
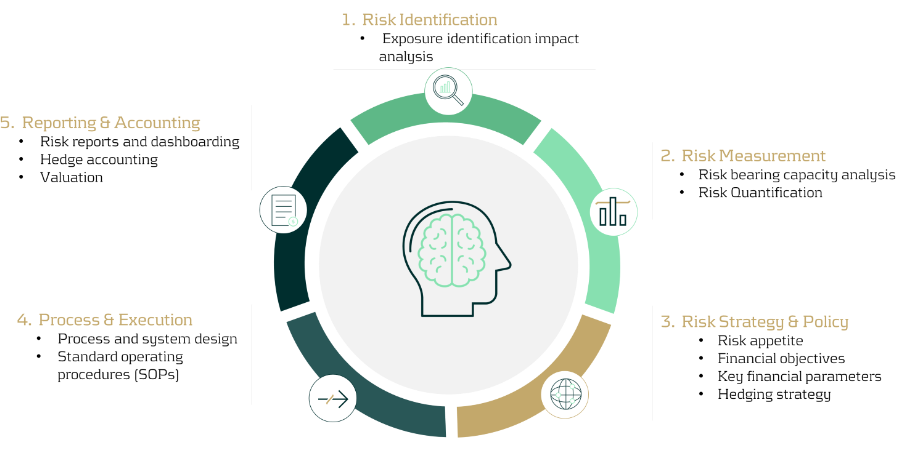
Figure 2: Zanders’ Commodity Risk Management Framework.
In the typical framework that Zanders’ advocates, the first step is always to gain understanding through:
- Identification: Establish the commodity exposure profile by identifying all possible sources of commodity exposure, classifying their likelihood and impact on the organization, and then prioritizing them accordingly.
- Measurement: Risk quantification and measurement refers to the quantitative analysis of the exposure profile, assessing the probability of market events occurring and quantifying the potential impact of the commodity price movements on financial parameters using common techniques such as sensitivity analysis, scenario analysis, or simulation analysis (pertaining to cashflow at risk, value at risk, etcetera).
- Strategy & Policy: With a clear understanding of the existing risk profile, the objectives of the risk management framework can be defined, giving special consideration to the specific goals of procurement teams when formulating the strategy and policy. The hedging strategy can then be developed in alignment with the established financial risk management objectives.
- Process & Execution: This phase directly follows the development of the hedging strategy, defining the toolbox for hedging and clearly allocating roles and responsibilities.
- Monitoring & Reporting: All activities should be supported by consistent monitoring and reporting, exception handling capabilities, and risk assessments shared across departments.
We will discuss each of these areas next in-depth and start to consider how teams of various skillsets can be combined to provide organizations with a best practice approach to commodity risk management.
Exposure identification & measurement is crucial
A recent Zanders survey and subsequent whitepaper revealed that the primary challenge most corporations face in risk management processes is data visibility and risk identification. Furthermore, identifying commodity risks is significantly more nuanced compared to understanding more straightforward risks such as counterparty or interest rate exposures.
Where the same categorization of exposures between transaction and economic risk apply to commodities (see boxout), there are additional layers of categorization that should be considered, especially in regard to transaction risk.
Transactions and economic risks affect a company's cash flows.
While transaction risk represents the future and known cash flows,
Economic risk represents the future (but unknown) cash flows.
Direct exposures: Certain risks may be viewed as direct exposures, where the commodity serves as a necessary input within the manufacturing supply chain, making it crucial for operations. In this scenario, financial pricing is not the only consideration for hedging, but also securing the delivery of the commodity itself to avoid any disruption to operations. While the financial risk component of this scenario sits nicely within the treasury scope of expertise, the physical or delivery component requires the expertise of the procurement team. Cross-departmental cooperation is therefore vital.
Indirect exposures: These exposures may be more closely aligned to FX exposures, where the risk is incurred only in a financial capacity, but no consideration is needed of physical delivery aspects. This is commonly experienced explicitly with indexation on the pricing conditions with suppliers, or implicitly with an understanding that the supplier may adjust the fixed price based on market conditions.
As with any market risk, it is important to maintain the relationship with procurement teams to ensure that the exposure identifications and assumptions used remain true
Indirect exposures may provide a little more independence for treasury teams in exercising the hedging decision from an operational perspective, particularly with strong systems support, reporting on and capturing the commodity indexation on the contracts, and analyzing how fixed price contracts are correlating with market movements. However, as with any market risk, it is important to maintain the relationship with procurement teams to ensure that the exposure identifications and assumptions used remain true.
Only once an accurate understanding of the nature and characteristics of the underlying exposures has been achieved can the hedging objectives be defined, leading to the creation of the strategy and policy element in the framework.
Strategy & Policy
Where all the same financial objectives of financial risk management such as ‘predictability’ and ‘stability’ are equally applicable to commodity risk management, additional non-financial objectives may need to be considered for commodities, such as ensuring delivery of commodity materials.
In addition, as the commodity risk is normally incurred as a core element of the operational processes, the objective of the hedging policy may be more closely aligned to creating stability at a product or component level and incorporated into the product costing processes. This is in comparison to FX where the impact from FX risk on operations falls lower in priority and the financial objectives at group or business unit level take central focus.
The exposure identification for each commodity type may reveal vastly different characteristics, and consequently the strategic objectives of hedging may differ by commodity and even at component level. This will require unique knowledge in each area, further confirming that a partnership approach with procurement teams is needed to adequately create effective strategy and policy guidelines.
Process and Execution
When a strategy is in place, the toolbox of hedging instruments available to the organization must be defined. For commodities, this is not only limited to financial derivatives executed by treasury and offsetting natural hedges. Strategic initiatives to reduce the volume of commodity exposure through manufacturing processes, and negotiations with suppliers to fix commodity prices within the contract are only a small sample of additional tools that should be explored.
Both treasury and procurement expertise is required throughout the commodity risk management Processing and Execution steps. This creates a challenge in defining a set of roles and responsibilities that correctly allocate resources against the tasks where the respective treasury and procurement subject matter experts can best utilize their knowledge.
As best practice, Treasury should be recognized as the financial market risk experts, ideally positioned to thoroughly comprehend the impact of commodity market movements on financial performance. The Treasury function should manage risk within a comprehensive, holistic risk framework through the execution of offsetting financial derivatives. Treasurers can use the same skillset and knowledge that they already use to manage FX and IR risks.
Procurement teams on the other hand will always have greater understanding of the true nature of commodity exposures, as well as an understanding of the supplier’s appetite and willingness to support an organizations’ hedging objectives. Apart from procurements understanding of the exposure, they may also face the largest impact from commodity price movements. Importantly, the sourcing and delivery of the actual underlying commodities and ensuring sufficient raw material stock for business operations would also remain the responsibility of procurement teams, as opposed to treasury who will always focus on price risk.
Clearly both stakeholders have a role to play, with neither providing an obvious reason to be the sole owner of tasks operating in isolation of the other. For simplicity purposes, some corporates have distinctly drawn a line between the procurement and treasury processes, often with procurement as the dominant driver. In this common workaround, Treasury is often only used for the hedging execution of derivatives, leaving the exposure identification, impact analysis and strategic decision-making with the procurement team. This allocation of separate responsibilities limits the potential of treasury to add value in the area of their expertise and limits their ability to innovate and create an improved end-to-end process. Operating in isolation also segregates commodity risk from a greater holistic risk framework approach, which the treasury may be trying to achieve for the organization.
One alternative to allocating tasks departmentally and distinctly would be to find a bridge between the stakeholders in the form of a specialized commodity and procurement risk team with treasury and procurement acting together in partnership. Through this specialized team, procurement objectives and exposure analysis may be combined with treasury risk management knowledge to ensure the most appropriate resources perform each task in-line with the objectives. This may not always be possible with the available resources, but variations of this blended approach are possible with less intrusive changes to the organizational structure.
Conclusion
With treasury trends pointing towards adopting a holistic view of risk management, together with a backdrop of global economic uncertainty and geopolitical instability, it may be time to face the challenges limiting Treasury’s role in commodity risk management and set up a framework that addresses these challenges. Treasury’s closer involvement should best utilize the talent in an organization, gain transparency to the exposures and risk profile in times of uncertainty and enable agile end-to-end decision-making with improved coordination between teams.
These advantages carry substantial potential value in fortifying commodity risk management practices to uphold operational stability across diverse commodity market conditions.

Learn more about automating VaR attribution with Component VaR (CVaR), and how it can enhance efficiency and accuracy by replacing traditional, labor-intensive manual processes.
VaR has been one of the most widely used risk measures in banks for decades. However, due to the non-additive nature of VaR, explaining the causes of changes to VaR has always been challenging. VaR attribution techniques seek to identify the individual contributions, from specific positions, assets or risk factors to the portfolio-level VaR. For larger portfolios with many risk factors, the process can be complicated, time-consuming and computationally expensive.
In this article, we discuss some of the challenges with VaR attribution and describe some of the common methods for successful and efficient attribution. We also share insights into our own approach to performing VaR attribution, alongside our experience with delivering successful attribution frameworks for our clients.
The challenge of VaR attribution
Providing attribution for changes in VaR due to day-on-day market moves and model changes is a common task for risk teams. The typical attribution approach is a manual investigation, drilling down into the data to isolate and identify VaR drivers. However, this can be a complex and time-consuming process, with thousands of potential factors that need to be analysed. This, compounded by the non-additive nature of VaR, can lead to attributions that may be incorrect or incomplete.
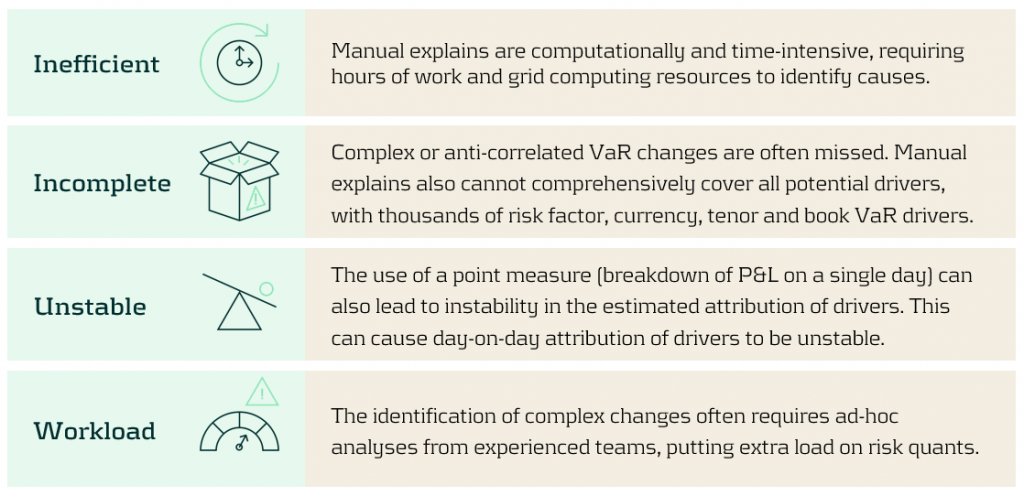
How is a manual explain performed?
The manual explain is a common approach to attributing changes in VaR, which is often performed by inefficient ad-hoc analyses. A manual explain is an iterative approach where VaR is computed at increasingly higher granularities until VaR drivers can be isolated. This iterative drill-down is both computationally and time inefficient, often taking many iterations and hours of processing to isolate VaR drivers with sufficient granularity.
What problems are there with manual VaR explains?
There are several problems teams face when conducting manual VaR explains:
Our approach to performing VaR attribution
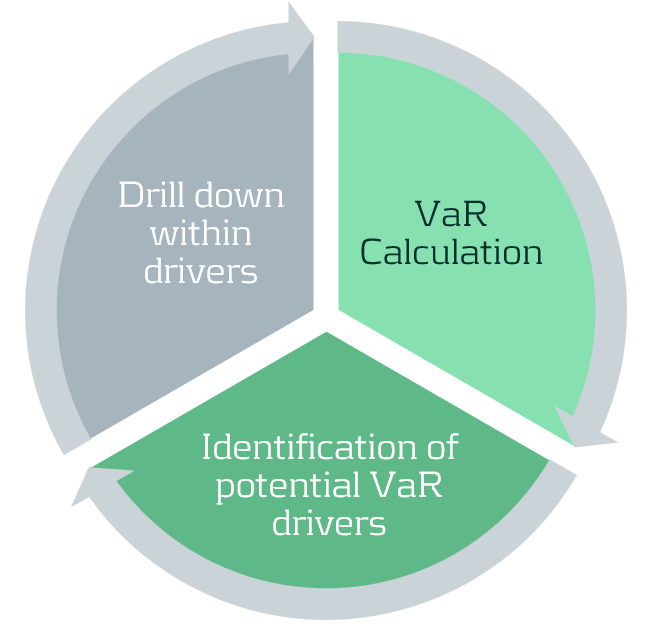
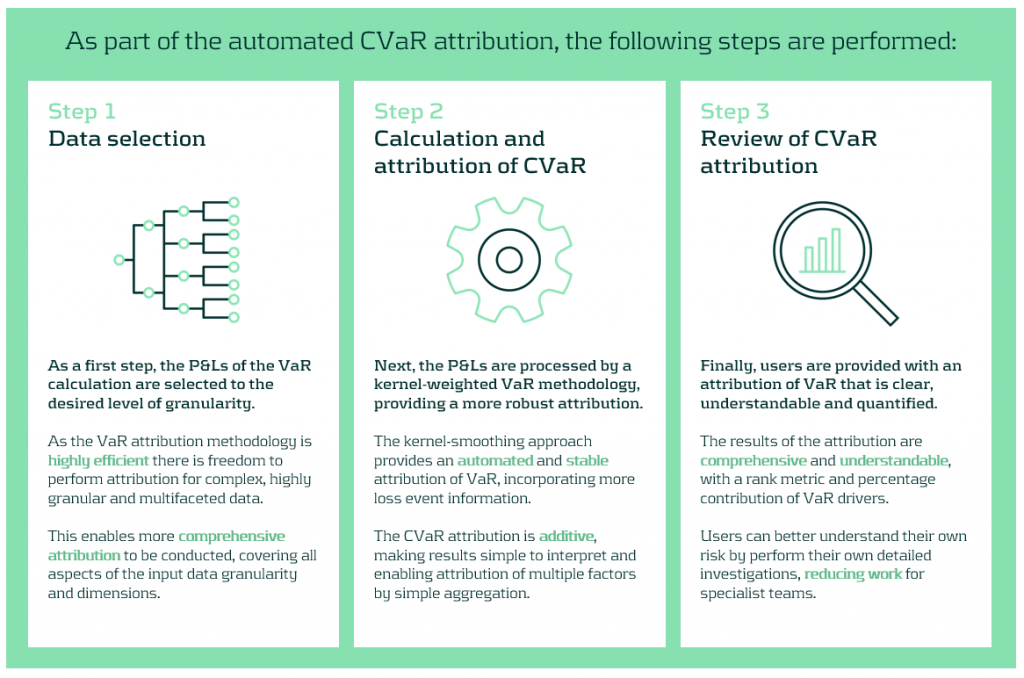
We propose an automated attribution approach to improve the efficiency and coverage of VaR explains. Our component VaR (CVaR) explain approach replaces the iterative and manual explain process with an automated process with three main steps.
First, risk P&Ls are selected at the desired level of granularity for attribution. This can cover a large number of dimensions at high granularity. Next, the data are analysed by a kernel-smoothed algorithm, which increases the stability and automates the attribution of VaR. Finally, users are provided with a comprehensive set of attribution results, enabling users to investigate their risk, determining and quantifying their core VaR drivers.
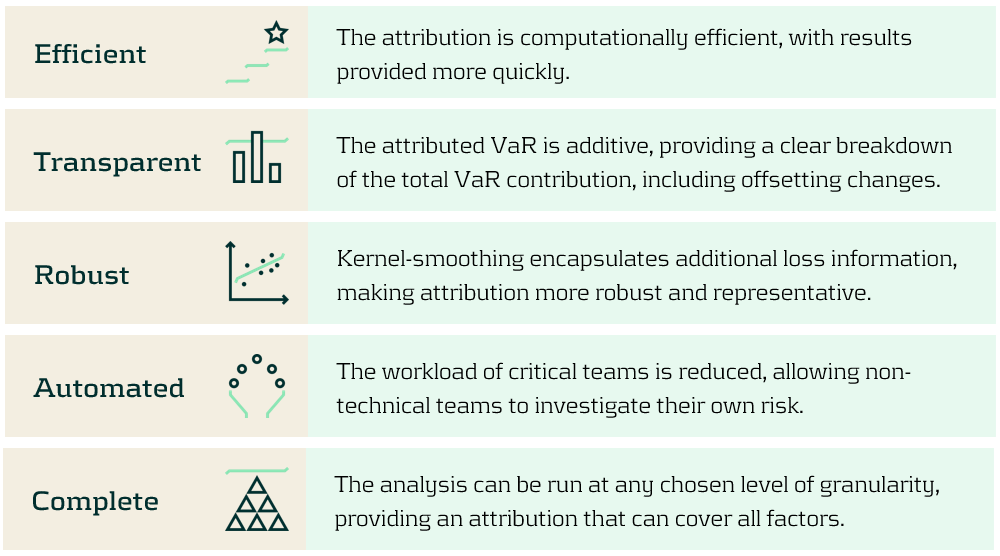
Benefits of the CVaR attribution methodology
CVaR attribution empowers users, enabling them to conduct their own VaR attribution analyses. This accelerates attribution for VaR and other percentile-based models, reducing the workload of specialised teams. The benefits our automated CVaR attribution methodology provides are presented below:
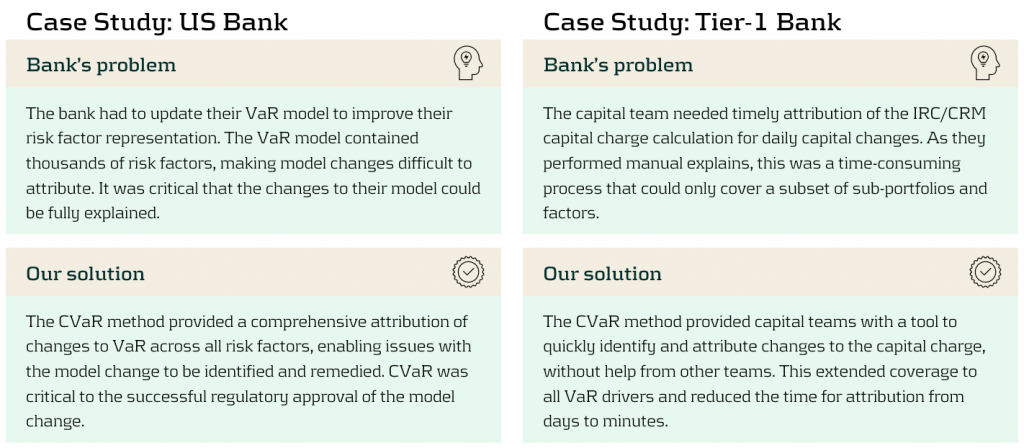
Zanders’ experiences with CVaR
We have implemented CVaR attribution for several large and complex VaR models, greatly improving efficiency and speed.
Conclusion
Although VaR attribution offers vital insights into the origins and drivers of risk, it is often complex and computationally demanding, particularly for large portfolios. Traditional manual methods are both time-consuming and inefficient. To address these challenges, we have proposed an automated CVaR attribution approach, which enhances efficiency, reduces workload, and provides timely and detailed risk driver insights. Our case studies demonstrate clear improvements in the coverage of VaR drivers and overall speed, enabling better risk management.
For more information on this topic, contact Dilbagh Kalsi (Partner) or Mark Baber (Senior Manager).

Covid-19 exposed flaws in banks’ risk models, prompting regulatory exemptions, while new EBA guidelines aim to identify and manage future extreme market stresses.
The Covid-19 pandemic triggered unprecedented market volatility, causing widespread failures in banks' internal risk models. These backtesting failures threatened to increase capital requirements and restrict the use of advanced models. To avoid a potentially dangerous feedback loop from the lower liquidity, regulators responded by granting temporary exemptions for certain pandemic-related model exceptions. To act faster to future crises and reduce unreasonable increases to banks’ capital requirements, more recent regulation directly comments on when and how similar exemptions may be imposed.
Although FRTB regulation briefly comments on such situations of market stress, where exemptions may be imposed for backtesting and profit and loss attribution (PLA), it provides very little explanation of how banks can prove to the regulators that such a scenario has occurred. On 28th June, the EBA published its final draft technical standards on extraordinary circumstances for continuing the use of internal models for market risk. These standards discuss the EBA’s take on these exemptions and provide some guidelines on which indicators can be used to identify periods of extreme market stresses.
Background and the BCBS
In the Basel III standards, the Basel Committee on Banking Supervision (BCBS) briefly comment on rare occasions of cross-border financial market stress or regime shifts (hereby called extreme stresses) where, due to exceptional circumstances, banks may fail backtesting and the PLA test. In addition to backtesting overages, banks often see an increasing mismatch between Front Office and Risk P&L during periods of extreme stresses, causing trading desks to fail PLA.
The BCBS comment that one potential supervisory response could be to allow the failing desks to continue using the internal models approach (IMA), however only if the banks models are updated to adequately handle the extreme stresses. The BCBS make it clear that the regulators will only consider the most extraordinary and systemic circumstances. The regulation does not, however, give any indication of what analysis banks can provide as evidence for the extreme stresses which are causing the backtesting or PLA failures.
The EBA’s standards
The EBA’s conditions for extraordinary circumstances, based on the BCBS regulation, provide some more guidance. Similar to the BCBS, the EBA’s main conditions are that a significant cross-border financial market stress has been observed or a major regime shift has taken place. They also agree that such scenarios would lead to poor outcomes of backtesting or PLA that do not relate to deficiencies in the internal model itself.
To assess whether the above conditions have been met, the EBA will consider the following criteria:
- Analysis of volatility indices (such as the VIX and the VSTOXX), and indicators of realised volatilities, which are deemed to be appropriate to capture the extreme stresses,
- Review of the above volatility analysis to check whether they are comparable to, or more extreme than, those observed during COVID-19 or the global financial crisis,
- Assessment of the speed at which the extreme stresses took place,
- Analysis of correlations and correlation indicators, which adequately capture the extreme stresses, and whether a significant and sudden change of them occurred,
- Analysis of how statistical characteristics during the period of extreme stresses differ to those during the reference period used for the calibration of the VaR model.
The granularity of the criteria
The EBA make it clear that the standards do not provide an exhaustive list of suitable indicators to automatically trigger the recognition of the extreme stresses. This is because they believe that cases of extreme stresses are very unique and would not be able to be universally captured using a small set of prescribed indicators.
They mention that defining a very specific set of indicators would potentially lead to banks developing automated or quasi-automated triggering mechanisms for the extreme stresses. When applied to many market scenarios, this may lead to a large number of unnecessary triggers due the specificity of the prescribed indicators. As such, the EBA advise that the analysis should take a more general approach, taking into consideration the uniqueness of each extreme stress scenario.
Responses to questions
The publication also summarises responses to the original Consultation Paper EBA/CP/2023/19. The responses discuss several different indicators or factors, on top of the suggested volatility indices, that could be used to identify the extreme stresses:
- The responses highlight the importance of correlation indicators. This is because stress periods are characterised by dislocations in the market, which can show increased correlations and heightened systemic risk.
- They also mention the use of liquidity indicators. This could include jumps of the risk-free rates (RFRs) or index swap (OIS) indicators. These liquidity indicators could be used to identify regime shifts by benchmarking against situations of significant cross-border market stress (for example, a liquidity crisis).
- Unusual deviations in the markets may also be strong indicators of the extreme stresses. For example, there could be a rapid widening of spreads between emerging and developed markets triggered by regional debt crisis. Unusual deviations between cash and derivatives markets or large difference between futures/forward and spot prices could also indicate extreme stresses.
- They suggest that restrictions on trading or delivery of financial instruments/commodities may be indicative of extreme stresses. For example, the restrictions faced by the Russian ruble due to the Russia-Ukraine war.
- Finally, the responses highlighted that an unusual amount of backtesting overages, for example more than 2 in a month, could also be a useful indicator.
Zanders recommends
It’s important that banks are prepared for potential extreme stress scenarios in the future. To achieve this, we recommend the following:
- Develop a holistic set of indicators and metrics that capture signs of potential extreme stresses,
- Use early warning signals to preempt potential upcoming periods of stress,
- Benchmark the indicators and metrics against what was observed during the great financial crisis and Covid-19,
- Create suitable reporting frameworks to ensure the knowledge gathered from the above points is shared with relevant teams, supporting early remediation of issues.
Conclusion
During extreme stresses such as Covid-19 and the global financial crisis, banks’ internal models can fail, not because of modeling issues but due to systemic market issues. Under FRTB, the BCBS show that they recognise this and, in these rare situations, may provide exemptions. The EBA’s recently published technical standards provide better guidance on which indicators can be used to identify these periods of extreme stresses. Although they do not lay out a prescriptive and definitive set of indicators, the technical standards provide a starting point for banks to develop suitable monitoring frameworks.
For more information on this topic, contact Dilbagh Kalsi (Partner) or Hardial Kalsi (Manager).

Explore how ridge backtesting addresses the intricate challenges of Expected Shortfall (ES) backtesting, offering a robust and insightful approach for modern risk management.
Challenges with backtesting Expected Shortfall
Recent regulations are increasingly moving toward the use of Expected Shortfall (ES) as a measure to capture risk. Although ES fixes many issues with VaR, there are challenges when it comes to backtesting.
Although VaR has been widely-used for decades, its shortcomings have prompted the switch to ES. Firstly, as a percentile measure, VaR does not adequately capture tail risk. Unlike VaR, which gives the maximum expected portfolio loss in a given time period and at a specific confidence level, ES gives the average of all potential losses greater than VaR (see figure 1). Consequently, unlike Var, ES can capture a range of tail scenarios. Secondly, VaR is not sub-additive. ES, however, is sub-additive, which makes it better at accounting for diversification and performing attribution. As such, more recent regulation, such as FRTB, is replacing the use of VaR with ES as a risk measure.
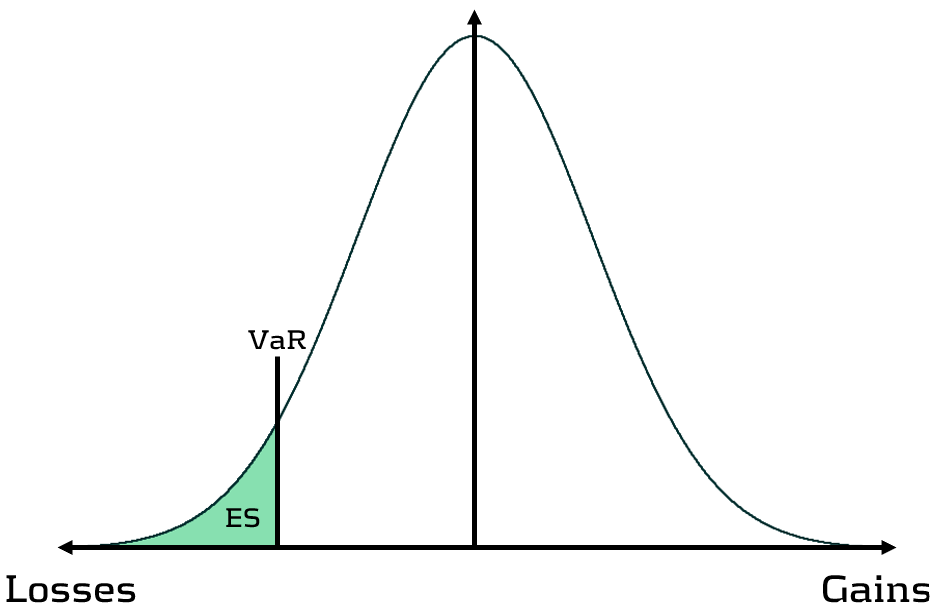
Figure 1: Comparison of VaR and ES
Elicitability is a necessary mathematical condition for backtestability. As ES is non-elicitable, unlike VaR, ES backtesting methods have been a topic of debate for over a decade. Backtesting and validating ES estimates is problematic – how can a daily ES estimate, which is a function of a probability distribution, be compared with a realised loss, which is a single loss from within that distribution? Many existing attempts at backtesting have relied on approximations of ES, which inevitably introduces error into the calculations.
The three main issues with ES backtesting can be summarised as follows:
- Transparency
- Without reliable techniques for backtesting ES, banks struggle to have transparency on the performance of their models. This is particularly problematic for regulatory compliance, such as FRTB.
- Sensitivity
- Existing VaR and ES backtesting techniques are not sensitive to the magnitude of the overages. Instead, these techniques, such as the Traffic Light Test (TLT), only consider the frequency of overages that occur.
- Stability
- As ES is conditional on VaR, any errors in VaR calculation lead to errors in ES. Many existing ES backtesting methodologies are highly sensitive to errors in the underlying VaR calculations.
Ridge Backtesting: A solution to ES backtesting
One often-cited solution to the ES backtesting problem is the ridge backtesting approach. This method allows non-elicitable functions, such as ES, to be backtested in a manner that is stable with regards to errors in the underlying VaR estimations. Unlike traditional VaR backtesting methods, it is also sensitive to the magnitude of the overages and not just their frequency.
The ridge backtesting test statistic is defined as:

where 𝑣 is the VaR estimation, 𝑒 is the expected shortfall prediction, 𝑥 is the portfolio loss and 𝛼 is the confidence level for the VaR estimation.
The value of the ridge backtesting test statistic provides information on whether the model is over or underpredicting the ES. The technique also allows for two types of backtesting; absolute and relative. Absolute backtesting is denominated in monetary terms and describes the absolute error between predicted and realised ES. Relative backtesting is dimensionless and describes the relative error between predicted and realised ES. This can be particularly useful when comparing the ES of multiple portfolios. The ridge backtesting result can be mapped to the existing Basel TLT RAG zones, enabling efficient integration into existing risk frameworks.
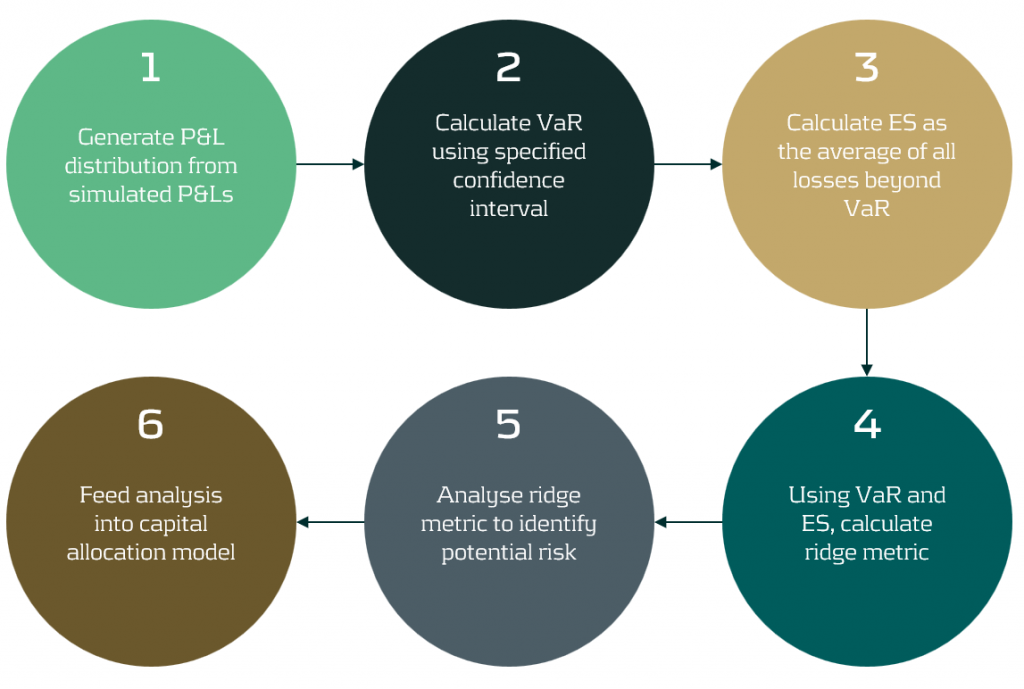
Figure 2: The ridge backtesting methodology
Sensitivity to Overage Magnitude
Unlike VaR backtesting, which does not distinguish between overages of different magnitudes, a major advantage of ES ridge backtesting is that it is sensitive to the size of each overage. This allows for better risk management as it identifies periods with large overages and also periods with high frequency of overages.
Below, in figure 3, we demonstrate the effectiveness of the ridge backtest by comparing it against a traditional VaR backtest. A scenario was constructed with P&Ls sampled from a Normal distribution, from which a 1-year 99% VaR and ES were computed. The sensitivity of ridge backtesting to overage magnitude is demonstrated by applying a range of scaling factors, increasing the size of overages by factors of 1, 2 and 3. The results show that unlike the traditional TLT, which is sensitive only to overage frequency, the ridge backtesting technique is effective at identifying both the frequency and magnitude of tail events. This enables risk managers to react more quickly to volatile markets, regime changes and mismodeling of their risk models.
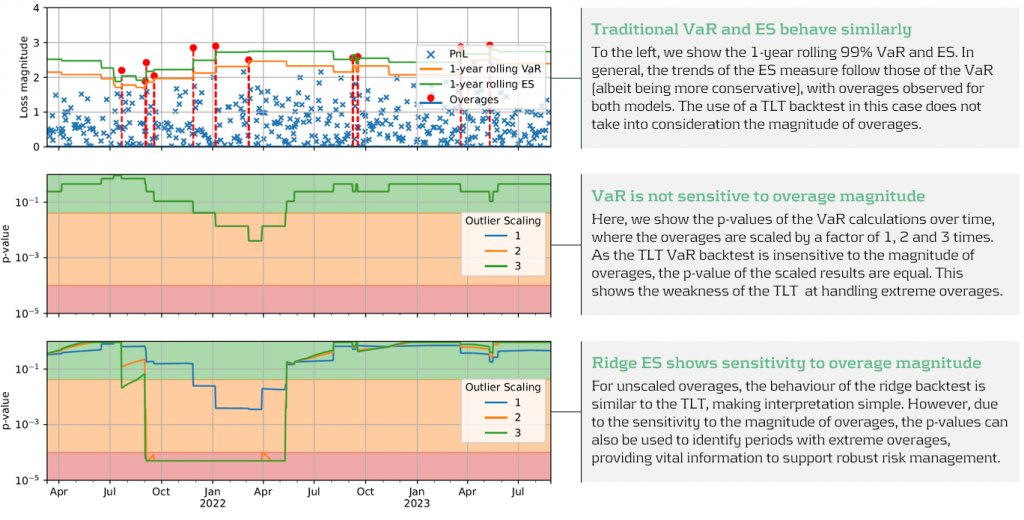
Figure 3: Demonstration of ridge backtesting’s sensitivity to overage magnitude.
The Benefits of Ridge Backtesting
Rapidly changing regulation and market regimes require banks enhance their risk management capabilities to be more reactive and robust. In addition to being a robust method for backtesting ES, ridge backtesting provides several other benefits over alternative backtesting techniques, providing banks with metrics that are sensitive and stable.
Despite the introduction of ES as a regulatory requirement for banks choosing the internal models approach (IMA), regulators currently do not require banks to backtest their ES models. This leaves a gap in banks’ risk management frameworks, highlighting the necessity for a reliable ES backtesting technique. Despite this, banks are being driven to implement ES backtesting methodologies to be compliant with future regulation and to strengthen their risk management frameworks to develop a comprehensive understanding of their risk.
Ridge backtesting gives banks transparency to the performance of their ES models and a greater reactivity to extreme events. It provides increased sensitivity over existing backtesting methodologies, providing information on both overage frequency and magnitude. The method also exhibits stability to any underlying VaR mismodeling.
In figure 4 below, we summarise the three major benefits of ridge backtesting.
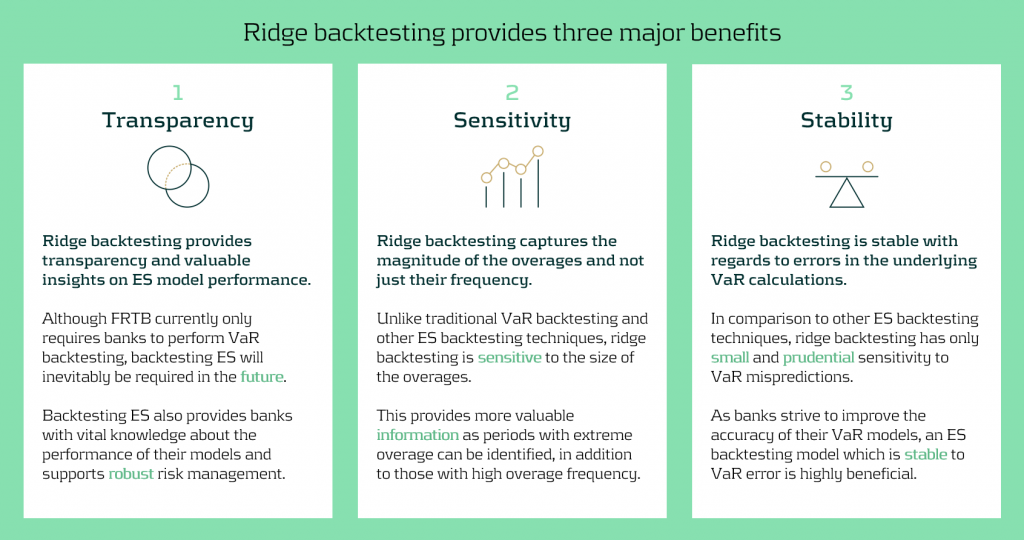
Figure 4: The three major benefits of ridge backtesting.
Conclusion
The lack of regulatory control and guidance on backtesting ES is an obvious concern for both regulators and banks. Failure to backtest their ES models means that banks are not able to accurately monitor the reliability of their ES estimates. Although the complexities of backtesting ES has been a topic of ongoing debate, we have shown in this article that ridge backtesting provides a robust and informative solution. As it is sensitive to the magnitude of overages, it provides a clear benefit in comparison to traditional VaR TLT backtests that are only sensitive to overage frequency. Although it is not a regulatory requirement, regulators are starting to discuss and recommend ES backtesting. For example, the PRA, EBA and FED have all recommended ES backtesting in some of their latest publications. However, despite the fact that regulation currently only requires banks to perform VaR backtesting, banks should strive to implement ES backtesting as it supports better risk management.
For more information on this topic, contact Dilbagh Kalsi (Partner) or Hardial Kalsi (Manager).


A comprehensive summary of a recent webinar on diverse modeling techniques and shared challenges in expected credit losses
Across the whole of Europe, banks apply different techniques to model their IFRS9 Expected Credit Losses on a best estimate basis. The diverse spectrum of modeling techniques raises the question: what can we learn from each other, such that we all can improve our own IFRS 9 frameworks? For this purpose, Zanders hosted a webinar on the topic of IFRS 9 on the 29th of May 2024. This webinar was in the form of a panel discussion which was led by Martijn de Groot and tried to discuss the differences and similarities by covering four different topics. Each topic was discussed by one panelist, who were Pieter de Boer (ABN AMRO, Netherlands), Tobia Fasciati (UBS, Switzerland), Dimitar Kiryazov (Santander, UK), and Jakob Lavröd (Handelsbanken, Sweden).
The webinar showed that there are significant differences with regards to current IFRS 9 issues between European banks. An example of this is the lingering effect of the COVID-19 pandemic, which is more prominent in some countries than others. We also saw that each bank is working on developing adaptable and resilient models to handle extreme economic scenarios, but that it remains a work in progress. Furthermore, the panel agreed on the fact that SICR remains a difficult metric to model, and, therefore, no significant changes are to be expected on SICR models.
Covid-19 and data quality
The first topic covered the COVID-19 period and data quality. The poll question revealed widespread issues with managing shifts in their IFRS 9 model resulting from the COVID-19 developments. Pieter highlighted that many banks, especially in the Netherlands, have to deal with distorted data due to (strong) government support measures. He said this resulted in large shifts of macroeconomic variables, but no significant change in the observed default rate. This caused the historical data not to be representative for the current economic environment and thereby distorting the relationship between economic drivers and credit risk. One possible solution is to exclude the COVID-19 period, but this will result in the loss of data. However, including the COVID-19 period has a significant impact on the modeling relations. He also touched on the inclusion of dummy variables, but the exact manner on how to do so remains difficult.
Dimitar echoed these concerns, which are also present in the UK. He proposed using the COVID-19 period as an out-of-sample validation to assess model performance without government interventions. He also talked about the problems with the boundaries of IFRS 9 models. Namely, he questioned whether models remain reliable when data exceeds extreme values. Furthermore, he mentioned it also has implications for stress testing, as COVID-19 is a real life stress scenario, and we might need to think about other modeling techniques, such as regime-switching models.
Jakob found the dummy variable approach interesting and also suggested the Kalman filter or a dummy variable that can change over time. He pointed out that we need to determine whether the long term trend is disturbed or if we can converge back to this trend. He also mentioned the need for a common data pipeline, which can also be used for IRB models. Pieter and Tobia agreed, but stressed that this is difficult since IFRS 9 models include macroeconomic variables and are typically more complex than IRB.
Significant Increase in Credit Risk
The second topic covered the significant increase in credit risk (SICR). Jakob discussed the complexity of assessing SICR and the lack of comprehensive guidance. He stressed the importance of looking at the origination, which could give an indication on the additional risk that can be sustained before deeming a SICR.
Tobia pointed out that it is very difficult to calibrate, and almost impossible to backtest SICR. Dimitar also touched on the subject and mentioned that the SICR remains an accounting concept that has significant implications for the P&L. The UK has very little regulations on this subject, and only requires banks to have sufficient staging criteria. Because of these reasons, he mentioned that he does not see the industry converging anytime soon. He said it is going to take regulators to incentivize banks to do so. Dimitar, Jakob, and Tobia also touched upon collective SICR, but all agreed this is difficult to do in practice.
Post Model Adjustments
The third topic covered post model adjustments (PMAs). The results from the poll question implied that most banks still have PMAs in place for their IFRS 9 provisions. Dimitar responded that the level of PMAs has mostly reverted back to the long term equilibrium in the UK. He stated that regulators are forcing banks to reevaluate PMAs by requiring them to identify the root cause. Next to this, banks are also required to have a strategy in place when these PMAs are reevaluated or retired, and how they should be integrated in the model risk management cycle. Dimitar further argued that before COVID-19, PMAs were solely used to account for idiosyncratic risk, but they stayed around for longer than anticipated. They were also used as a countercyclicality, which is unexpected since IFRS 9 estimations are considered to be procyclical. In the UK, banks are now building PMA frameworks which most likely will evolve over the coming years.
Jakob stressed that we should work with PMAs on a parameter level rather than on ECL level to ensure more precise adjustments. He also mentioned that it is important to look at what comes before the modeling, so the weights of the scenarios. At Handelsbanken, they first look at smaller portfolios with smaller modeling efforts. For the larger portfolios, PMAs tend to play less of a role. Pieter added that PMAs can be used to account for emerging risks, such as climate and environmental risks, that are not yet present in the data. He also stressed that it is difficult to find a balance between auditors, who prefer best estimate provisions, and the regulator, who prefers higher provisions.
Linking IFRS 9 with Stress Testing Models
The final topic links IFRS 9 and stress testing. The poll revealed that most participants use the same models for both. Tobia discussed that at UBS the IFRS 9 model was incorporated into their stress testing framework early on. He pointed out the flexibility when integrating forecasts of ECL in stress testing. Furthermore, he stated that IFRS 9 models could cope with stress given that the main challenge lies in the scenario definition. This is in contrast with others that have been arguing that IFRS 9 models potentially do not work well under stress. Tobia also mentioned that IFRS 9 stress testing and traditional stress testing need to have aligned assumptions before integrating both models in each other.
Jakob agreed and talked about the perfect foresight assumption, which suggests that there is no need for additional scenarios and just puts a weight of 100% on the stressed scenario. He also added that IFRS 9 requires a non-zero ECL, but a highly collateralized portfolio could result in zero ECL. Stress testing can help to obtain a loss somewhere in the portfolio, and gives valuable insights on identifying when you would take a loss.
Pieter pointed out that IFRS 9 models differ in the number of macroeconomic variables typically used. When you are stress testing variables that are not present in your IFRS 9 model, this could become very complicated. He stressed that the purpose of both models is different, and therefore integrating both can be challenging. Dimitar said that the range of macroeconomic scenarios considered for IFRS 9 is not so far off from regulatory mandated stress scenarios in terms of severity. However, he agreed with Pieter that there are different types of recessions that you can choose to simulate through your IFRS 9 scenarios versus what a regulator has identified as systemic risk for an industry. He said you need to consider whether you are comfortable relying on your impairment models for that specific scenario.
This topic concluded the webinar on differences and similarities across European countries regarding IFRS 9. We would like to thank the panelists for the interesting discussion and insights, and the more than 100 participants for joining this webinar.
Interested to learn more? Contact Kasper Wijshoff, Michiel Harmsen or Polly Wong for questions on IFRS 9.

Unlock Treasury Efficiency: Exploring SAP’s GROW and RISE Cloud Solutions
As organizations continue to adapt to the rapidly changing business landscape, one of the most pivotal shifts is the migration of enterprise resource planning (ERP) systems to the cloud. The evolution of treasury operations is a prime example of how cloud-based solutions are revolutionizing the way businesses manage their financial assets. This article dives into the nuances between SAP’s GROW (public cloud) and RISE (private cloud) products, particularly focusing on their impact on treasury operations.
The "GROW" product targets new clients who want to quickly leverage the public cloud's scalability and standard processes. In contrast, the "RISE" product is designed for existing SAP clients aiming to migrate their current systems efficiently into the private cloud.
Public Cloud vs. Private Cloud
The public cloud, exemplified by SAP's "GROW" package, operates on a shared infrastructure hosted by providers such as SAP, Alibaba, or AWS. Public cloud services are scalable, reliable, and flexible, offering key business applications and storage managed by the cloud service providers. Upgrades are mandatory and occur on a six-month release cycle. All configuration is conducted through SAP Fiori, making this solution particularly appealing to upper mid-market net new customers seeking to operate using industry-standard processes and maintain scalable operations.
In contrast, the private cloud model, exemplified by the “RISE” package, is used exclusively by a single business or organization and must be hosted at SAP or an SAP-approved hyperscaler of their choice. The private cloud offers enhanced control and security, catering to specific business needs with personalized services and infrastructure according to customer preferences. It provides configuration flexibility through both SAP Fiori and the SAP GUI. This solution is mostly preferred by large enterprises, and many customers are moving from ECC to S/4HANA due to its customizability and heightened security.
Key Differences in Cloud Approaches
Distinguishing between public and private cloud methodologies involves examining factors like control, cost, security, scalability, upgrades, configuration & customization, and migration. Each factor plays a crucial role in determining which cloud strategy aligns with an organization's vision for treasury operations.
- Control: The private cloud model emphasizes control, giving organizations exclusive command over security and data configurations. The public cloud is managed by external providers, offering less control but relieving the organization from day-to-day cloud management.
- Cost: Both the public and private cloud operate on a subscription model. However, managing a private cloud infrastructure requires significant upfront investment and a dedicated IT team for ongoing maintenance, updates, and monitoring, making it a time-consuming and resource-intensive option. Making the public cloud potentially a more cost-effective option for organizations.
- Security: Both GROW and RISE are hosted by SAP or hyperscalers, offering strong security measures. There is no significant difference in security levels between the two models.
- Scalability: The public cloud offers unmatched scalability, allowing businesses to respond quickly to increased demands without the need for physical hardware changes. Private clouds can also be scaled, but this usually requires additional hardware or software and IT support, making them less dynamic.
- Upgrades: the public cloud requires mandatory upgrades every six months, whereas the private cloud allows organizations to dictate the cadence of system updates, such as opting for upgrades every five years or as needed.
- Configuration and Customization: in the public cloud configuration is more limited with fewer BAdIs and APIs available, and no modifications allowed. The private cloud allows for extensive configuration through IMG and permits SAP code modification, providing greater flexibility and control.
- Migration: the public cloud supports only greenfield implementation, which means only current positions can be migrated, not historical transactions. The private cloud offers migration programs from ECC, allowing historical data to be transferred.
Impact on Treasury Operations
The impact of SAP’s GROW (public cloud) and RISE (private cloud) solutions on treasury operations largely hinges on the degree of tailoring required by an organization’s treasury processes. If your treasury processes require minimal or no tailoring, both public and private cloud options could be suitable. However, if your treasury processes are tailored and structured around specific needs, only the private cloud remains a viable option.
In the private cloud, you can add custom code, modify SAP code, and access a wider range of configuration options, providing greater flexibility and control. In contrast, the public cloud does not allow for SAP code modification but does offer limited custom code through cloud BADI and extensibility. Additionally, the public cloud emphasizes efficiency and user accessibility through a unified interface (SAP Fiori), simplifying setup with self-service elements and expert oversight. The private cloud, on the other hand, employs a detailed system customization approach (using SAP Fiori & GUI), appealing to companies seeking granular control.
Another important consideration is the mandatory upgrades in the public cloud every six months, requiring you to test SAP functionalities for each activated scope item where an update has occurred, which could be strenuous. The advantage is that your system will always run on the latest functionality. This is not the case in the private cloud, where you have more control over system updates. With the private cloud, organizations can dictate the cadence of system updates (e.g., opting for yearly upgrades), the type of updates (e.g., focusing on security patches or functional upgrades), and the level of updates (e.g., maintaining the system one level below the latest is often used).
To accurately assess the impact on your treasury activities, consider the current stage of your company's lifecycle and identify where and when customization is needed for your treasury operations. For example, legacy companies with entrenched processes may find the rigidity of public cloud functionality challenging. In contrast, new companies without established processes can greatly benefit from the pre-delivered set of best practices in the public cloud, providing an excellent starting point to accelerate implementation.
Factors Influencing Choices
Organizations choose between public and private cloud options based on factors like size, compliance, operational complexity, and the degree of entrenched processes. Larger companies may prefer private clouds for enhanced security and customization capabilities. Startups to mid-size enterprises may favor the flexibility and cost-effectiveness of public clouds during rapid growth. Additionally, companies might opt for a hybrid approach, incorporating elements of both cloud models. For instance, a Treasury Sidecar might be deployed on the public cloud to leverage scalability and innovation while maintaining the main ERP system on-premise or on the private cloud for greater control and customization. This hybrid strategy allows organizations to tailor their infrastructure to meet specific operational needs while maximizing the advantages of both cloud environments.
Conclusion
Migrating ERP systems to the cloud can significantly enhance treasury operations with distinct options through SAP's public and private cloud solutions. Public clouds offer scalable, cost-effective solutions ideal for medium-to upper-medium-market enterprises with standard processes or without pre-existing processes. They emphasize efficiency, user accessibility, and mandatory upgrades every six months. In contrast, private clouds provide enhanced control, security, and customization, catering to larger enterprises with specific regulatory needs and the ability to modify SAP code.
Choosing the right cloud model for treasury operations depends on an organization's current and future customization needs. If minimal customization is required, either option could be suitable. However, for customized treasury processes, the private cloud is preferable. The decision should consider the company's lifecycle stage, with public clouds favoring rapid growth and cost efficiency and private clouds offering long-term control and security.
It is also important to note that SAP continues to offer on-premise solutions for organizations that require or prefer traditional deployment methods. This article focuses on cloud solutions, but on-premises remains a viable option for businesses that prioritize complete control over their infrastructure and have the necessary resources to manage it independently.
If you need help thinking through your decision, we at Zanders would be happy to assist you.

Are you leveraging the SAP Credit Risk Analyzer to its full potential?
While many business and SAP users are familiar with its core functionalities, such as limit management applying different limit types and the core functionality of attributable amount determination, several less known SAP standard features can enhance your credit risk management processes.
In this article, we will explore these hidden gems, such as Group Business Partners and the ways to manage the limit utilizations using manual reservations and collateral.
Group Business Partner Use
One of the powerful yet often overlooked features of the SAP Credit Risk Analyzer is the ability to use Group Business Partners (BP). This functionality allows you to manage credit and settlement risk at a bank group level rather than at an individual transactional BP level. By consolidating credit and settlement exposure for related entities under a single group business partner, you can gain a holistic view of the risks associated with an entire banking group. This is particularly beneficial for organizations dealing with banking corporations globally and allocating a certain amount of credit/settlement exposure to banking groups. It is important to note that credit ratings are often reflected at the group bank level. Therefore, the use of Group BPs can be extended even further with the inclusion of credit ratings, such as S&P, Fitch, etc.
Configuration: Define the business partner relationship by selecting the proper relationship category (e.g., Subsidiary of) and setting the Attribute Direction to "Also count transactions from Partner 1 towards Partner 2," where Partner 2 is the group BP.
Master Data: Group BPs can be defined in the SAP Business Partner master data (t-code BP). Ensure that all related local transactional BPs are added in the relationship to the appropriate group business partner. Make sure the validity period of the BP relationship is valid. Risk limits are created using the group BP instead of the transactional BP.
Reporting: Limit utilization (t-code TBLB) is consolidated at the group BP level. Detailed utilization lines show the transactional BP, which can be used to build multiple report variants to break down the limit utilization by transactional BP (per country, region, etc.).
Having explored the benefits of using Group Business Partners, another feature that offers significant flexibility in managing credit risk is the use of manual reservations and collateral contracts.
Use of Manual Reservations
Manual reservations in the SAP Credit Risk Analyzer provide an additional layer of flexibility in managing limit utilization. This feature allows risk managers to manually add a portion of the credit/settlement utilization for specific purposes or transactions, ensuring that critical operations are not hindered by unexpected credit or settlement exposure. It is often used as a workaround for issues such as market data problems, when SAP is not able to calculate the NPV, or for complex financial instruments not yet supported in the Treasury Risk Management (TRM) or Credit Risk Analyzer (CRA) settings.
Configuration: Apart from basic settings in the limit management, no extra settings are required in SAP standard, making the use of reservations simpler.
Master data: Use transaction codes such as TLR1 to TLR3 to create, change, and display the reservations, and TLR4 to collectively process them. Define the reservation amount, specify the validity period, and assign it to the relevant business partner, transaction, limit product group, portfolio, etc. Prior to saving the reservation, check in which limits your reservation will be reflected to avoid having any idle or misused reservations in SAP.
While manual reservations provide a significant boost to flexibility in limit management, another critical aspect of credit risk management is the handling of collateral.
Collateral
Collateral agreements are a fundamental aspect of credit risk management, providing security against potential defaults. The SAP Credit Risk Analyzer offers functionality for managing collateral agreements, enabling corporates to track and value collateral effectively. This ensures that the collateral provided is sufficient to cover the exposure, thus reducing the risk of loss.
SAP TRM supports two levels of collateral agreements:
- Single-transaction-related collateral
- Collateral agreements.
Both levels are used to reduce the risk at the level of attributable amounts, thereby reducing the utilization of limits.
Single-transaction-related collateral: SAP distinguishes three types of collateral value categories:
- Percentual collateralization
- Collateralization using a collateral amount
- Collateralization using securities
Configuration: configure collateral types and collateral priorities, define collateral valuation rules, and set up the netting group.
Master Data: Use t-code KLSI01_CFM to create collateral provisions at the appropriate level and value. Then, this provision ID can be added to the financial object.
Reporting: both manual reservations and collateral agreements are visible in the limit utilization report as stand- alone utilization items.
By leveraging these advanced features, businesses can significantly enhance their risk management processes.
Conclusion
The SAP Credit Risk Analyzer is a comprehensive tool that offers much more than meets the eye. By leveraging its hidden functionalities, such as Group Business Partner use, manual reservations, and collateral agreements, businesses can significantly enhance their credit risk management processes. These features not only provide greater flexibility and control but also ensure a more holistic and robust approach to managing credit risk. As organizations continue to navigate the complexities of the financial landscape, unlocking the full potential of the SAP Credit Risk Analyzer can be a game-changer in achieving effective risk management.
If you have questions or are keen to see the functionality in our Zanders SAP Demo system, please feel free to contact Aleksei Abakumov or any Zanders SAP consultant.


