Overview of WACC Estimation
The WACC is recognized as one of the most critical parameters in strategic decision-making. It is relevant for business valuation, capital budgeting, feasibility studies and corporate finance decisions. When estimating the WACC for a company, there is a clear trade-off between theoretical purity and actual circumstances faced by a company. The decision in this context should reflect the actual environment in which a company operates. In general, the WACC is estimated using the following equation:
D: Market value of interest-bearing debt
E: Market value of common equity
H: Market value of hybrid capital
RD: Cost of interest-bearing debt
RE: Cost of common equity
RH: Cost of hybrid capital
Ô: Corporate tax rate
The estimation of the WACC is based on several key assumptions:
- It is market driven. It is the expected rate of return that the market requires to commit capital to an investment.
- It is a function of the investment, not the investor.
- It is forward looking, based on expected returns.
- The base against which the WACC is measured is market value, not book value.
- It is usually measured in nominal terms, which includes expected inflation.
- It is the link, called a discount rate, which equates expected future returns for the life of the investment with the present value of the investment at a given date.
The WACC seems easier to estimate than it really is. Just as two people will rarely interpret a piece of art the same way, neither will two people calculate the same WACC. Even if two people do reach the same WACC, all the other applied judgments and valuation methods are likely to ensure that each has a different opinion regarding the components that comprise the company value.
Therefore, the following sections of this article will discuss the different WACC components in more detail. Errors that are frequently encountered in practice will be highlighted as well as best market practice as a guide for estimating the WACC.
Capital Structure
The first step in developing an estimate of the WACC is to determine the capital structure for the company or project that is being valued. This provides the market value weights for the WACC formula. Best market practice is to define a target capital structure and this is for several reasons.
First, the current capital structure may not reflect the capital structure that is expected to prevail over the life of the business.
The second reason for using a target capital structure is that it solves the potential problem of circularity involved in estimating the WACC, which arises when calculating the WACC for private companies. For instance, we need to know market value weights to determine the WACC but we cannot know the market value weights without knowing what the market value is in the first place.
To develop a target capital structure, a combination of three approaches is suggested:
1. Estimate the current capital structure.
A capital structure can comprise three categories of financing: interest-bearing debt, common equity and hybrid capital. The best approach for estimating the current ‘market value-based’ capital structure is to identify the values of the capital structure elements directly from their prices in the marketplace, if available. For equity, market prices are available for public companies, but it is more difficult to identify the market value of equity for private companies, business units and also for illiquid stocks.
The same applies for public debt, such as bonds, where the market value can be identified from available market prices. In the case of private debt, however, such as bank loans and private placements, the current value needs to be calculated. (For discussion about the difficulties of calculating the market value of hybrid capital, please refer to the third article in this series on the WACC.) The conclusion is that estimating the current capital structure based on market values could be difficult when market prices are not available. The next approach could assist in solving this difficulty, by estimating a target capital structure based on information from comparable companies.
2. Review the capital structure of comparable companies.
In addition to estimating the market value-based capital structure currently and over time, it is useful to review the capital structures of comparable companies as well.
There are two reasons for this. First, comparing the capital structure of the company with those of similar companies will help to understand if the current estimate of the capital structure is unusual. It is perfectly acceptable that the company’s capital structure is different, but it is important to understand the reasons behind this.
The second reason is a more practical one because in some cases it is not possible to estimate the current financing mix for the company. For privately held companies, a market-based estimate of the current value of equity is not available.
3. Review senior management’s approach to financing.
It is important to discuss the company’s capital structure policy with senior management to determine their explicit or implicit target capital structure for the company and its businesses.
This discussion could give an explanation why a company’s capital structure may be different from comparable companies. For instance, is the company by philosophy more aggressive or innovative in the use of debt financing? Or is the current capital structure only a temporary deviation from a more conservative target?
Often companies finance acquisitions with debt they plan to amortize rapidly or refinance with equity in the near future. Alternatively, there could be a difference in the company’s cash flow or asset intensity, which results in a target capital structure that is fundamentally different from comparable companies.
Corporate Tax Rate
The WACC is a calculation of the ‘after tax’ cost of capital. The tax treatment for the different capital components – such as interest-bearing debt, common equity and hybrid capital – is different. The corporate tax rate in the earlier mentioned WACC equation is applicable to debt financing because in most countries interest expense on debt is a tax-deductible expense to a company.
It is appropriate, however, to take into consideration the fact that several countries apply thin capitalization rules that may limit tax deductibility of interest expenses to a maximum leverage.
Furthermore, in some countries, expenses on hybrid capital could be tax deductible as well. In that case the corporate tax rate should also be applied to hybrid financing and the WACC equation should be changed accordingly. (For more information on hybrid capital please refer to the third article of this series on the WACC.)
Finally, corporate tax can also have a positive impact on the cost of equity. An example is Belgium, which recently introduced a system of notional interest deduction, providing a tax deduction for the cost of equity. This system will be further explained in the fifth article of this series, which elaborates on the impact of notional interest deduction on the WACC. In other words, the calculation of the WACC for Belgian financing structures needs to be revised.
The main conclusion is that the application of the corporate tax rate in the WACC equation will differ per country. As mentioned before, when estimating the WACC for a company, there is a clear trade-off between theoretical purity and actual circumstances faced by the company. Best market practice is to reflect the actual environment in which a company operates. Therefore the WACC equation needs to be revised accordingly.
Cost of Interest-bearing Debt
The cost of interest-bearing debt can be estimated using the following equation:
RD = RF + DRP
RD: Cost of interest-bearing debt
RF: Risk-free rate
DRP: Debt risk premium
The category of interest-bearing debt consists of short-term debt, long-term debt and leases. Many companies have floating-rate debt, as an original issue or artificially created by interest rate derivatives. If floating-rate debt has no cap or floor, then it is best market practice to use the long-term debt interest rate. This is because the short-term rate will be rolled over and the geometric average of the expected short-term rates is equal to the long-term rate.
The cost of debt is calculated using the marginal cost of debt, i.e. the cost the company would incur for additional borrowing, or refinancing its existing interest-bearing debt. This cost is a combination of the risk-free rate and a debt risk premium. Credit ratings are the primary determinants of the debt risk premium. (More information on the relationship between the WACC, shareholder value and credit ratings can be read in the second article of this series on the WACC.)
The risk-free rate is the theoretical rate of return attributed to an investment with zero risk. The risk-free rate represents the interest that an investor would expect from an absolutely risk-free investment over a specified period of time. In theory, the risk-free rate is the minimum return an investor should expect for any investment.
In practice, however, the risk-free rate does not technically exist, since even the safest investments carry a very small amount of risk. Therefore best market practice for WACC estimations is to use the yield on a 10-year government bond as a proxy for the risk-free rate.
Estimating the WACC can be a challenging exercise, however, because a risk-free government bond is not always available in emerging markets. (This will be discussed further in article seven of this series.)
The cost of debt is the yield-to-maturity on publicly traded bonds of the company. Failing availability of that, the rates of interest charged by banks on recent loans to the company would also serve as a good cost of debt. When using yield-to-maturity to estimate the cost of debt it is important to make a distinction between investment and non-investment grade debt. Investment grade debt has a credit rating greater than or equal to BBB- (Standard & Poor’s). For investment grade debt, the risk of bankruptcy is relatively low.
Therefore, yield-to-maturity is usually a reasonable estimate of the opportunity cost. The coupon rate, which is the historical cost of debt, is irrelevant for determining the current cost of debt. Best market practice is to use the most current market rate on debt of equivalent risk. A reasonable proxy for the risk of debt is a credit rating.
When dealing with debt that is less than investment grade, pay attention to the difference between the expected yield-to-maturity and the promised yield-to-maturity. The latter assumes that all payments (coupon and principal) will be made as promised by the issuer. Therefore it is necessary to compute the expected yield-to-maturity, not the quoted, promised yield. This can be done based on the current market price of a low-grade bond and estimates of its expected default rate and value in default.
If the necessary data is not available, use the yield-to-maturity of BBB-rated debt, which reduces most of the effects of the differences between promised and expected yields.
Leases, both capital and operating, are substitutes for other types of debt. In many cases it is reasonable to assume that their opportunity cost is the same as for the company’s other long-term debt. Since capital leases are already shown as debt on the balance sheet, their market value can be estimated just like other debt.
Operating leases should also be treated like other forms of debt. As a practical matter, if operating leases are not significant, it could be decided not to treat them as debt. They can be left out of the capital structure and the lease payments could be treated as an operating cost.
Cost of Common Equity
For estimating the opportunity cost of common equity, best market practice is to use the expanded version of the capital asset pricing model (CAPM). The equation for the cost of equity is as follows:
RE = RF + [βL * MRP] + SRP
RE: Cost of common equity
RF: Risk-free rate
βL: Levered beta of equity
MRP: Market risk premium
SRP: Specific risk premium
The market risk premium is the extra return that the stock market provides over the risk-free rate to compensate for market risk. The estimate of the historically derived market risk premium is about 5 per cent. This estimate depends on how much history is used. Structural changes in the economy and markets, however, suggest that more recent data provides a better basis for predicting the future. Therefore, best market practice is to use data from the second half of the last century. This is a sufficiently long period to achieve statistical reliability, while avoiding the potentially less relevant market returns.
The historically derived market risk premium can be benchmarked against the implied market risk premium of today’s market capitalization and earnings. This can be done under different assumptions for future earnings growth and reinvestment. Recent studies show an implied market risk premium of 5-5.5 per cent, which is comparable to the historical derived estimate.
Beta is the measurement for the systematic risk of a company and is typically the regression coefficient between historical dividend-adjusted stock returns and market returns. For decades, investors were only concerned with one factor, beta, in their portfolio selection. Beta was considered to explain most of a portfolio’s return.
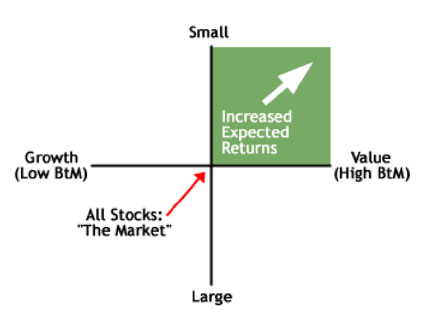
This one-factor model, otherwise known as standard CAPM, implies that there is a linear relationship between a company’s expected return and its corresponding beta. Beta is not the only determinant of stock returns though so CAPM has been expanded to include two other key risk factors that together better explain stock performance: market capitalization and book-to-market (BtM) value.
Recent empirical studies indicate that three risk factors – market (beta), size (market capitalization) and price (BtM value) – explain 96 per cent of historical equity performance. These three-factor models go further than CAPM to include the fact that two particular types of stocks outperform markets on a regular basis: small caps and value stocks (high BtM value).
The approach to estimate beta depends on whether the company’s equity is traded or not. Therefore the beta of a company can be estimated in two ways. The first and preferred solution for public companies is to use direct estimation, based on historical returns for the company in question.
The second way is to use indirect estimation. This solution is mainly applicable to business units and private companies, but also for illiquid stocks or public companies with very little useful historical data. This estimation is based on betas from comparable companies, which are used to construct an industry beta. When constructing the industry beta, it is important to ‘unlever’ the company betas and then apply the leverage of the specific company.
Best market practice is to incorporate a specific risk premium for small caps and value stocks when estimating the cost of equity. As mentioned earlier, this premium may be applicable to a specific company, based on its market capitalization and BtM value.
Cost of Hybrid Capital
Hybrids are financial instruments that combine certain elements of debt and equity, such as preferred equity, convertible bonds and subordinated debt. WACC estimations are complicated by the introduction of hybrid capital into the capital structure.
This is most easily resolved through an effective split of the instrument’s value into debt and equity to reflect the true debt-equity mix. (The fifth article of this series describes how issuing hybrids can optimize the WACC. The article outlines how hybrids are analyzed on their impact on shareholder value, but they are also analyzed from the perspective of treatment by accountants/IFRS and rating agencies.)
Conclusion
There are many ways to make errors both in estimating the WACC and applying it in practice and this article discussed the different WACC components in more detail. Attention was given to some of the errors frequently encountered in practice. Best market practice was provided as a guide for estimating the WACC while more practical guidance on estimation and application of the WACC will be discussed in the rest of the articles in this series.
Let’s return to the analogy at the beginning of this article. Is estimating the WACC comparable to interpreting a piece of art?
Again, just as two people will rarely interpret a piece of art the same way, neither will two people calculate the same WACC. The key message of this article is that both are based on assumptions before reaching a final estimation or interpretation.
The more time you spend on defining good assumptions for estimating the WACC, the better the quality of business valuation, capital budgeting and other financial decision-making will be. It is like discovering the real value of art; it all starts with a good interpretation.